
Batman Pattern in Trading: How to Identify a Trend Reversal and Enter a Trade

The Batman pattern (Batman Pattern) is a rare chart pattern in technical analysis that signals a possible price reversal near a strong support or resistance level. The pattern gets its name from its resemblance to the silhouette of Batman's head: two distinctive protrusions resemble ears, while the consolidation between them resembles the top of the head.
The pattern is based on the market's attempt to continue its previous move, which fails twice. Buyers or sellers cannot break through a key price level despite repeated impulses. This may indicate a weakening of the current trend and a shift in the balance of power between market participants.
The Batman pattern is interesting because it allows traders to look for entry points after a level is retested. However, the pattern alone does not guarantee a reversal. Before entering a trade, it is important to wait for confirmation and define in advance the level at which the trading hypothesis is no longer valid.
What the Batman pattern shows
Batman is a reversal pattern in Price Action. Its appearance reflects the market's inability to hold beyond a key level after several attempts to break through it.
For example, after a prolonged rise, the price reaches a strong resistance level. Buyers try to push prices higher but encounter sellers. A sharp upward impulse develops, which quickly ends in a pullback. The market then enters consolidation and, after some time, makes a second attempt to break out. This attempt also proves unsuccessful.
Two attempts to continue the rise form characteristic protrusions—Batman's “ears.” Between them is a consolidation area, conventionally referred to as the head of the pattern.
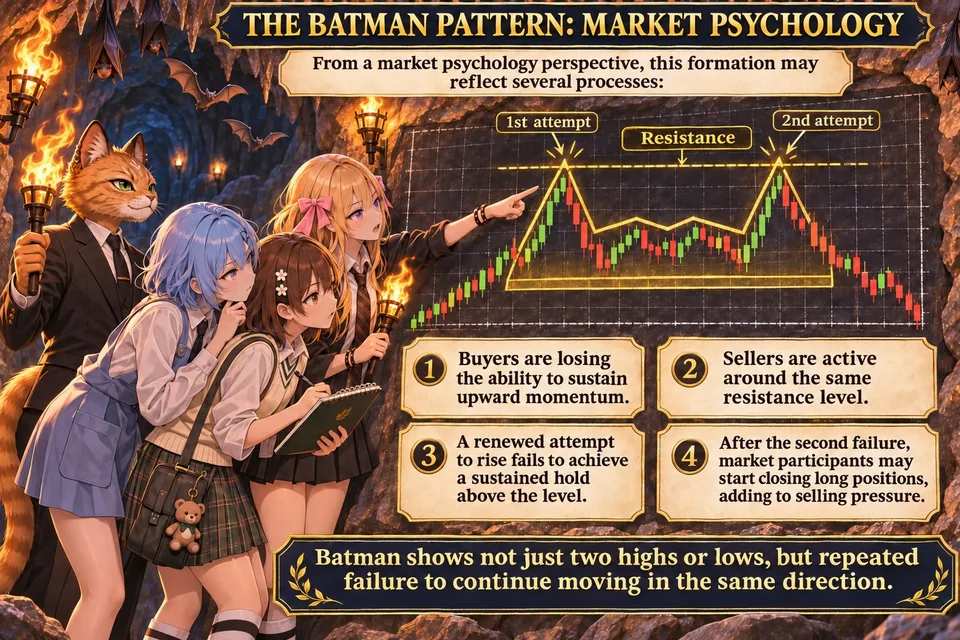
From the perspective of market psychology, such a structure may indicate several processes:
Buyers are losing their ability to sustain upward momentum.
Sellers are showing activity near the same resistance level.
A renewed attempt to move higher does not result in the price holding firmly above the level.
After the second failure, market participants may begin to close long positions, increasing the pressure from sellers.
Thus, Batman shows not just the presence of two highs or lows, but the market's repeated rejection of continued movement in one direction.
Bearish and bullish Batman
The pattern has two variations.
Bearish Batman (Bearish Batman) forms after an upward movement near resistance. The price attempts to move higher twice, but returns lower each time. Consolidation develops between the attempts. After a confirmed break below its lower boundary, a signal appears for a potential entry into a short position.
Bullish Batman (Bullish Batman) is a mirror image of this structure. It appears after a price decline near support. Sellers attempt to break below the level twice, but both impulses end in a bounce. After consolidation, the price breaks through its upper boundary, which may indicate the beginning of an upward movement.
The main requirement for both models is the presence of a significant level that repeatedly produces a pronounced price reaction.
How to find the Batman pattern on a chart
To find the pattern, you need to analyze both its appearance and the preceding price movement. Two similar peaks or troughs do not yet mean that a Batman pattern has formed on the chart.
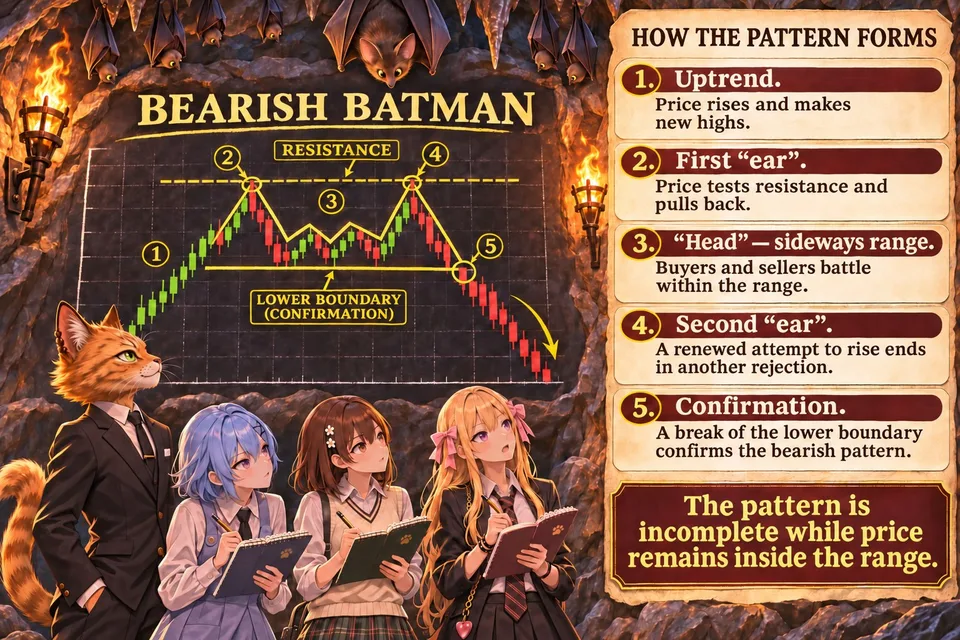
Let's look at the sequence in which a bearish pattern forms.
1. Strong preceding movement.
First, a clear uptrend must form on the chart. The price consistently makes new highs, and buyers control the movement.
2. First failed breakout attempt.
The price approaches a significant resistance zone and makes a sharp upward move. However, it fails to hold above it. The price returns below the level, forming the pattern's first “ear”.
3. Consolidation.
After the first rebound, the market moves sideways. Buyers and sellers battle within the range. This area forms the central part of the pattern — the “head”.
4. Second breakout attempt.
The price heads toward resistance again. Buyers try to resume the upward movement but once again encounter active selling. The second impulse ends in a rebound, forming the right “ear”.
5. Reversal confirmation.
After the second rejection, the price must break out of the consolidation area in the direction of the anticipated reversal. For a bearish pattern, this means a break below the lower boundary of the range; for a bullish pattern, a break above the upper boundary.
This final stage is especially important. As long as the price remains within the consolidation, the pattern's formation cannot be considered complete.
What signs to look for
When looking for the Batman pattern, it is useful to consider a few additional characteristics.
First, both impulses should show a pronounced reaction to the same price area. The highs or lows do not have to match down to the last point. What matters more is that they are within the same resistance or support zone.
Second, there should be noticeable consolidation between the impulses. If the price forms two consecutive peaks with virtually no pause, this looks more like a classic double top.
Third, ideally, the second impulse should not lead to a sustained hold beyond the level. A quick return of the price to the range shows that the attempt to continue the move was not sustained.
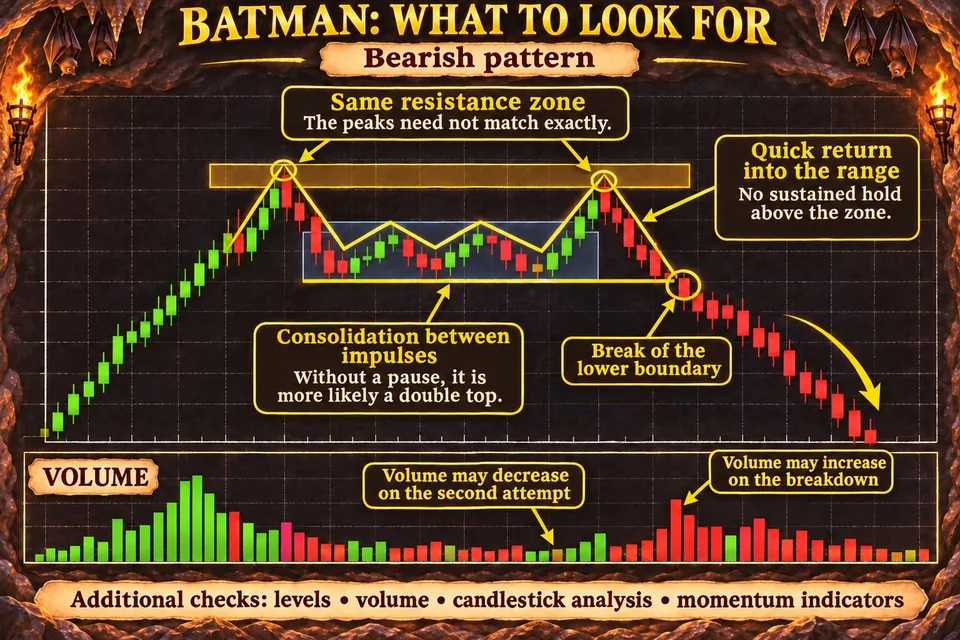
To validate the formation, you can use horizontal levels, volume, candlestick analysis and momentum indicators. For example, declining volume on the second attempt to rise and increasing volume when the consolidation boundary is broken may further confirm a change in market activity.
How often the Batman pattern occurs
Batman is one of the relatively rare and little-known chart patterns. Unlike the double top, triangle or head and shoulders pattern, it has not gained widespread recognition in classic technical analysis literature.
There is no single set of statistics showing how often it appears in different financial markets. In addition, since the pattern lacks generally accepted quantitative criteria for its construction, different traders may classify the same price formation differently.
Its frequency of occurrence is influenced by:
Timeframe. Such formations may occur more frequently on shorter timeframes, but they are more susceptible to market noise.
Instrument volatility. On assets with sharp price moves, the characteristic protrusions are easier to identify, but it is harder to distinguish a fully formed pattern from random fluctuations.
Market phase. Batman is of greatest interest after a pronounced directional move, when the price approaches a significant support or resistance zone.
Therefore, you should not try to find the pattern on every chart. It is far more important to wait for a situation in which its structure aligns with suitable market conditions. To look for the Batman pattern, you can use online charts on TLAP, TradingView or Bybit.
What Batman can be confused with
Because of its distinctive shape, the pattern is sometimes mistaken for other reversal patterns. It is especially important to distinguish it from a double top, “head and shoulders,” and the harmonic “Bat” pattern (Bat Pattern).
Double top and double bottom.
This is the structure closest to Batman. Both patterns involve two failed attempts to break through one level.
However, a conventional double top or double bottom is identified primarily by two approximately equal extremes with a correction between them. Batman is characterized by more pronounced impulsive breakout attempts and consolidation between them. It is the combination of two sharp moves and an intervening sideways section that creates its recognizable silhouette.
Head and shoulders (Head and Shoulders).
Both patterns are reversal patterns, but they have different structures.
In the classic “head and shoulders” pattern, three consecutive highs form: the left shoulder, the head, and the right shoulder. The central high is higher than the other two.
Batman has two characteristic protrusions—“ears”—with consolidation between them. Therefore, the presence of three distinct peaks is not a prerequisite for its formation.
Liquidity sweep (Liquidity Sweep).
A sharp move in price beyond support or resistance followed by a quick return may represent a liquidity sweep.
Such an impulse can also occur in Batman’s structure. However, they are not the same: a liquidity sweep describes price behavior relative to a level and the possible triggering of stop orders, while Batman is a more complex sequence of two failed impulses with consolidation between them.
Harmonic Bat pattern (Bat).
Despite their similar names, Bat Pattern and Batman Pattern are completely different formations.
The harmonic Bat pattern is built using five points, XABCD. Its formation is defined by specific ratios between price movements, calculated using Fibonacci levels. For example, point B usually corresponds to a 38.2–50% retracement of the XA move, while point D is at the 88.6% retracement of XA.
Batman has no mandatory Fibonacci ratios, and its structure is based on a sequence of price impulses and consolidation.
How Reliable Is the Batman Pattern
Batman can be a useful tool for identifying reversals, but it cannot be considered a standalone signal with a high probability of success.
First of all, there is no generally accepted method for constructing the pattern or verified universal statistics on its profitability. It is therefore incorrect to claim that it delivers a particular percentage of successful trades.
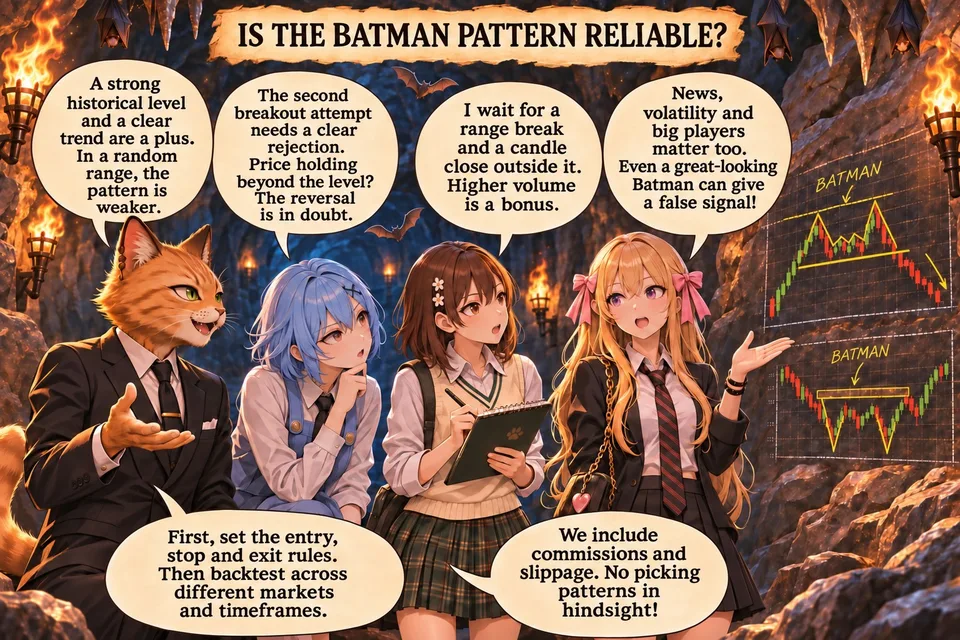
Signal quality depends on several factors.
Position relative to levels. The most interesting setups are those that form near strong historical support or resistance. If two impulses occur in the middle of random sideways movement, the pattern's significance is much lower.
The preceding trend. Batman involves an attempt to reverse a directional move. The more distinct the previous impulse was, the clearer the trading hypothesis.
The nature of the second impulse. A repeated breakout attempt should end with a pronounced rebound. If the price holds beyond the level or continues its move, there is less reason to expect a reversal.
Breakout confirmation. A breakout through the consolidation boundary and a candle closing beyond it improve signal quality. An increase in volume as price exits the range can provide additional confirmation.
Overall market context. News, broader market conditions, volatility, and the actions of major participants can affect the outcome. Even a well-formed pattern can turn out to be false.
To assess the pattern's reliability, a trader should conduct their own testing. They need to define the criteria for constructing the pattern and the rules for entry, stop placement, and taking profit in advance, then test them on historical data from different instruments and timeframes. It is important to account for commissions and slippage and to exclude from the sample patterns that became obvious only after the move had ended.
How to open a trade using the Batman pattern
Trading the Batman pattern involves three main entry options. They differ in the degree of signal confirmation and the ratio of potential profit to risk.
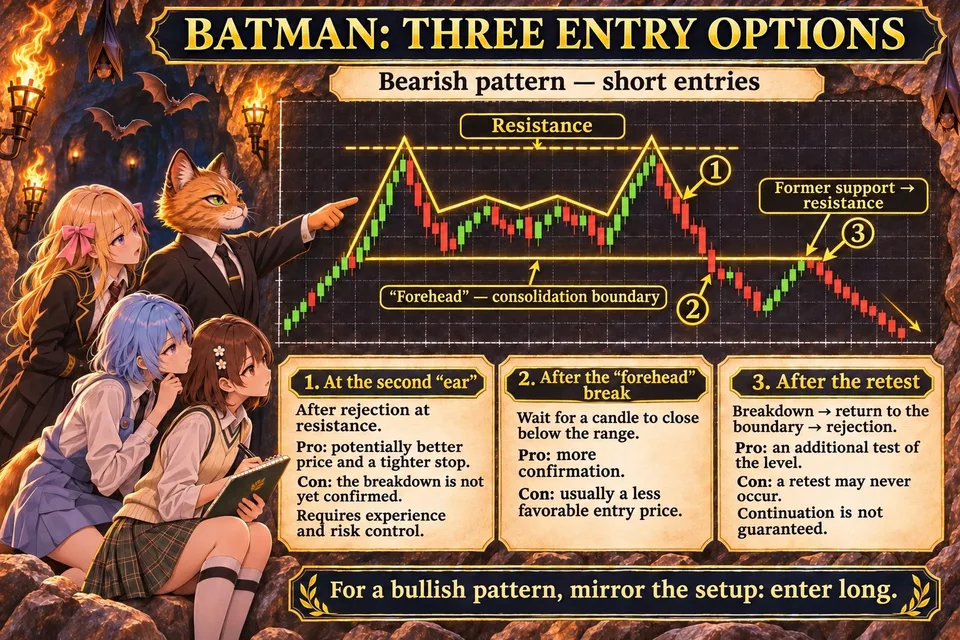
1. Aggressive entry at the second “ear”.
In this case, the trader opens a position after the second impulse forms and signs of another price rejection at the level appear.
For the bearish model, this means opening a short position near the high of the right “ear”. For the bullish model, it means buying near the low of the second impulse.
The advantage of this approach is the opportunity to get a better entry price and a tight stop-loss.
The disadvantage is the lack of final confirmation. The price may still continue moving in the direction of the previous trend and break through the level.
This method requires experience and particularly careful risk management.
2. Conservative entry after a breakout of the “forehead”.
A more cautious strategy involves waiting for the price to move out of the central part of the pattern.
For a bearish Batman pattern, the trader waits for a candle to close below the lower boundary of the consolidation. For a bullish one, above the upper boundary.
The breakout shows that the price has left the range in which buyers and sellers were battling.
An entry can be made after the confirming candle closes or after an additional test of the level. In the second case, the trader does not open a position immediately but waits for the price to return to the broken boundary and test it from the other side.
The advantage of a conservative entry is a higher degree of reversal confirmation. The disadvantage is a less favorable price compared with an aggressive trade.
3. Entry after a retest.
The third option is to wait for the broken consolidation boundary to be tested again.
With a bearish Batman pattern, the price first breaks out to the downside, then returns to the former support, which may now become resistance. If buyers fail to bring the price back above the level and sellers respond again, an additional opportunity to open a short position arises.
For the bullish pattern, everything is mirrored: after an upward breakout, the price returns to the former resistance, which becomes support.
A retest provides additional confirmation but does not guarantee that the move will continue. Sometimes the price does not return to the level and immediately continues the trend. In this case, trying to wait for a retest may lead to missing the trade.
Where to place a stop-loss for the Batman pattern
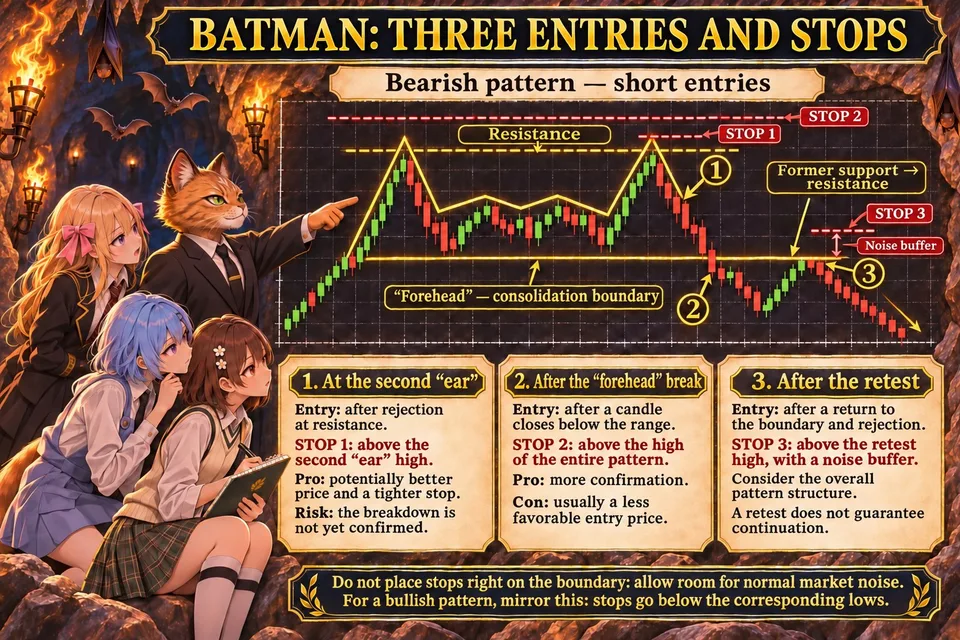
The stop-loss must be placed beyond the price extreme that formed the second “ear.” A break of this extreme shows that the market has overcome the resistance or support from which the price previously bounced twice.
For a bearish Batman pattern the stop is placed above the high of the right “ear.” It is advisable to leave a small buffer to account for volatility, the spread and the instrument’s normal fluctuations.
For a bullish Batman pattern the stop is placed below the low of the second “ear.”
The exact distance depends on the timeframe and the asset’s volatility. To determine the additional buffer, you can use ATR (Average True Range), which shows the average range of price movement over a selected number of candles.
The stop can also differ depending on the entry method:
For an aggressive entry at the second “ear,” the stop is placed beyond its extreme.
For an entry after a break of the consolidation boundary, a more conservative option is to place the stop beyond the high or low of the entire pattern.
For an entry after a retest, you can use the extreme of the retest itself, provided it is consistent with the overall structure of the pattern and offers sufficient protection against normal market noise.
You should not place the stop directly at the consolidation boundary: a normal price fluctuation could close the position before it becomes clear whether the pattern has actually failed.
Position size must be calculated based on the distance to the stop and the acceptable monetary risk. If a technically justified stop requires too great a distance, you should reduce the trade size rather than artificially move the stop closer to the entry price.
Where to Take Profit
The Batman pattern has no universal method for calculating the target move. Therefore, you can use the nearest significant support and resistance levels, previous local highs and lows, and zones where notable demand or supply has previously emerged as reference points.
For a bearish pattern, the nearest target may be the previous low of the upward impulse or the next support zone. For a bullish pattern, it may be the previous high or the nearest resistance zone.
Before opening a position, you need to assess the potential profit in relation to the possible loss. If the nearest level limits the move and does not allow for an acceptable risk-to-reward ratio, the trade may not be worthwhile.
Conclusion
The Batman pattern is a relatively rare reversal pattern based on two failed attempts to continue a move near an important price level. Its main feature is a combination of two impulse spikes and consolidation between them.
The formation helps identify a situation in which market participants lose the ability to break through support or resistance. However, the appearance of two “ears” does not yet mean that the trend will necessarily reverse.
For novice traders, it is more sensible to use a conservative trading approach: wait for a breakout of the consolidation boundary, check that the price holds beyond it and, if possible, wait for a retest. The stop-loss should be placed beyond the extreme of the second impulse, and the position size should be calculated based on a predefined risk.
Like other chart patterns, Batman is best used in combination with analysis of levels, volumes and market context. Before trading on a live account, the strategy must be checked against historical data and tested on a demo account.