
P&L Calculator: Calculate Trading Profit, Loss, ROI, ROE and Liquidation Price
What Does the P&L Calculator Show?
The TLAP P&L Calculator helps traders estimate the potential financial result of a trade and assess possible profit or loss under different market scenarios.
The calculator supports Forex, CFDs, and cryptocurrencies, as well as both spot and futures trading.
It accounts for the main factors that affect the final result, including position size, margin, leverage, trading fees, and funding costs. Depending on the selected trading mode, the calculator can estimate:
P&L (Profit & Loss);
ROI (Return on Investment);
ROE (Return on Equity);
Breakeven Price;
Estimated Liquidation Price for futures positions.
What the P&L Calculator Calculates
For spot trades, enter the entry price, exit price, trade direction, position size, and trading fee in percentage or monetary terms.
For futures trades, you can also specify the margin, leverage, Funding Rate, and number of funding periods during which the position is held.
The calculator then estimates the expected trading result based on the selected parameters.
Spot Trading
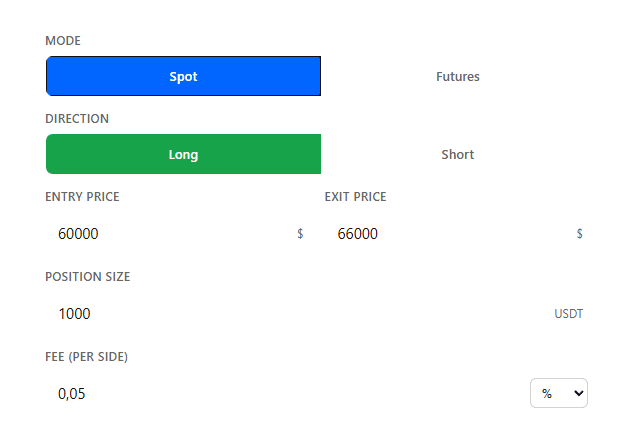
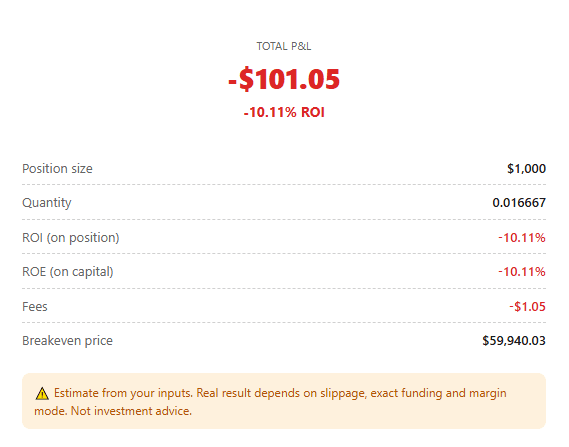
The calculator provides:
P&L — absolute profit or loss;
Position Size — the monetary value of the position;
Position Quantity — the amount of the underlying asset;
ROI — return relative to the position size;
ROE — return relative to the capital used;
Entry and Exit Fees — trading costs associated with opening and closing the position;
Breakeven Price — the price at which the trade reaches zero P&L after applicable trading costs.
Futures Trading
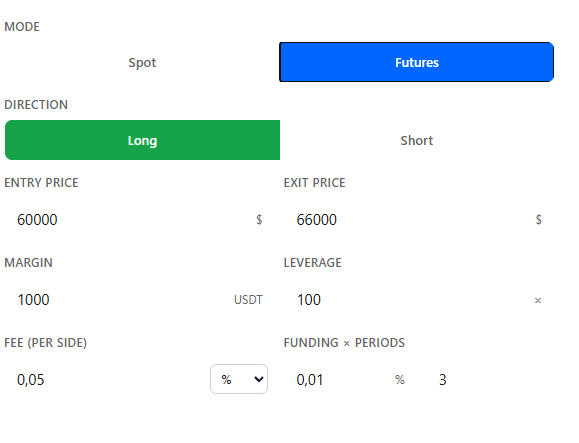
For futures positions, the calculator provides:
P&L — absolute profit or loss;
Position Size — the notional value of the position;
Position Quantity — the amount of the underlying asset or contract exposure;
ROI — return relative to the position size;
ROE — return relative to the margin used;
Entry and Exit Fees;
Funding Costs and their impact on futures P&L;
Breakeven Price after applicable trading costs and funding;
Estimated Liquidation Price for the futures position.
Calculations account for whether the position is Long or Short.
For a given price move, P&L is primarily determined by the position size and trade direction. Leverage does not increase the P&L of an unchanged position by itself. Instead, it allows a trader to control a larger position with less margin, which significantly affects ROE, margin requirements, and liquidation risk.
How to Use the P&L Calculator
1. Select the Trading Mode. Choose Spot or Futures.
2. Select the Position Direction. Choose Long for a bullish position or Short for a bearish position.
3. Enter the Entry and Exit Prices. Enter the opening price and your expected closing price.
4. Set the Trade Size. For spot trading, enter the position size directly.
For futures, specify the margin and leverage and the calculator will determine the resulting position size.
5. Add Trading Costs. Enter the applicable trading fee.
For futures, you can also include the Funding Rate and the number of funding periods.
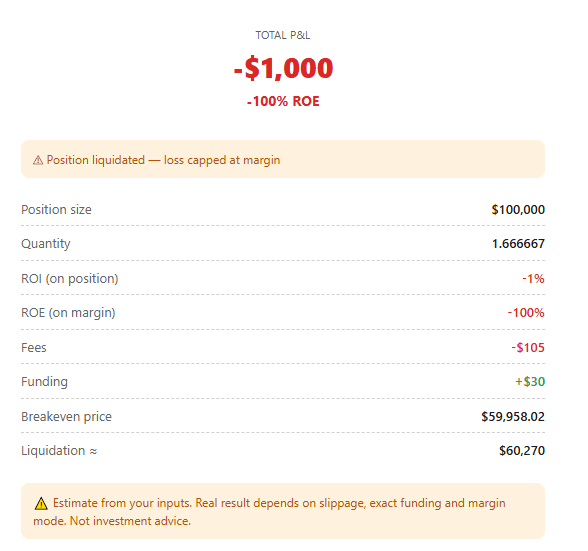
The calculator then estimates the expected P&L and other key trade parameters.
How to Use the Calculator in Trading
Evaluate a Trade Before Entry
Estimate potential P&L, ROI, and ROE at different exit prices before opening a position.
This helps determine whether the potential reward justifies the risk defined by your trading plan.
Compare the Impact of Leverage
For futures, compare the same position using different leverage levels, such as 5x, 10x, or 20x.
Focus not only on potential P&L but also on ROE, required margin, and distance to the estimated liquidation price.
Remember that leverage changes the amount of capital required to hold a given position and increases liquidation risk. It does not by itself change the P&L generated by a specific position size and price move.
Calculate the Breakeven Price
Trading fees and funding costs reduce the net result and can move the Breakeven Price away from the entry price.
Calculating breakeven before entering a trade is especially useful for short-term trading, where fees and funding can represent a meaningful share of the expected P&L.
Plan a Futures Trade
Use the calculator as part of your trading plan.
Define the expected entry, Stop Loss, and Take Profit, then estimate P&L after accounting for trading fees and, where applicable, funding costs.
Compare the potential reward with the maximum acceptable loss before entering the position.
Review a Closed Trade
Enter the actual entry and exit prices and applicable costs after closing a position.
This allows you to compare the expected and realized results and track trading performance through P&L, ROI, and ROE.
Important Note About Liquidation Price
The Estimated Liquidation Price is only an approximation.
The actual liquidation level depends on factors such as:
margin mode;
exchange-specific maintenance margin requirements;
initial margin;
trading fees;
funding payments;
contract specifications;
position size;
market conditions.
For this reason, the calculator's liquidation estimate should not be treated as an exact level for forced position closure. Always check the liquidation rules and margin requirements of the exchange and contract you trade.
Important Notice
The TLAP P&L Calculator is provided for informational and analytical purposes only. Its calculations are estimates and do not constitute investment, financial, or trading advice.
Actual trading results may differ because of slippage, trading fees, funding costs, margin requirements, liquidity, execution quality, and exchange-specific rules.
Leverage increases both the potential return on margin and the potential loss. Leveraged futures trading can result in partial or total loss of trading capital.