
Altcoin Season Index
TLAP Altseason Index: Measure Bitcoin Season vs. Altseason
The TLAP Altseason Index helps identify the current market regime by showing whether capital is primarily rotating into Bitcoin or altcoins.
The index measures the percentage of tracked altcoins that have outperformed Bitcoin over the past 90 days and displays the result on a simple scale from 0 to 100.
Instead of comparing dozens of individual charts, traders can quickly determine whether the market is in Bitcoin Season, Altseason, or a transitional phase.
What Is Altseason?
Altseason (Altcoin Season) is a market phase in which most altcoins outperform Bitcoin, reflecting increased investor risk appetite and capital rotation into higher-risk crypto assets.
The opposite regime is known as Bitcoin Season, when Bitcoin outperforms most altcoins and investors shift toward Bitcoin, which is generally viewed as the crypto market's more defensive asset.
The Altseason Index summarizes this market rotation into a single value, allowing traders and investors to assess the prevailing market regime at a glance.
How the TLAP Altseason Index Is Calculated
The index is calculated using proprietary TLAP daily market data.
For each tracked altcoin, its 90-day performance is compared with Bitcoin's performance over the same period.
The index value represents the percentage of tracked altcoins that have outperformed Bitcoin over the past 90 days.
The calculations are updated every three hours using daily closing price data.
Reading the Altseason Index
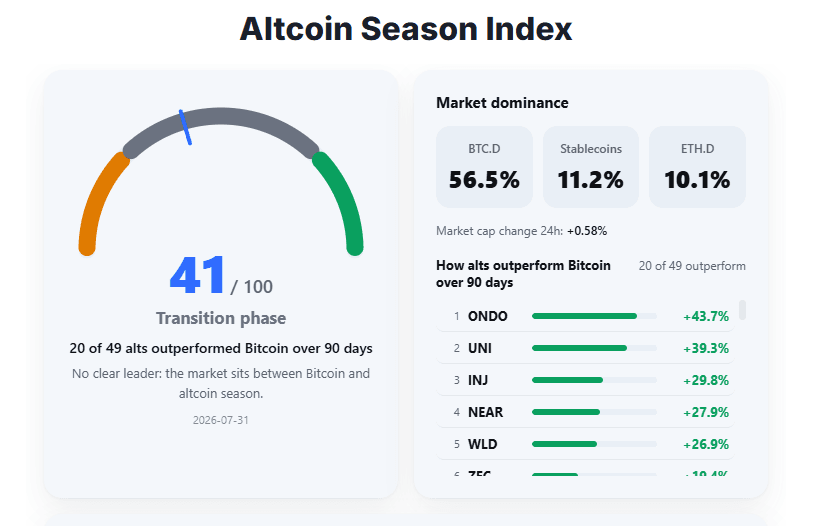
The gauge on the left displays the current index value, the active market regime, and the number of tracked altcoins outperforming Bitcoin.
Interpret the index as follows:
75–100: Altseason — most tracked altcoins are outperforming Bitcoin.
0–25: Bitcoin Season — Bitcoin is outperforming the majority of tracked altcoins.
26–74: Transition Phase — neither Bitcoin nor altcoins have established clear market leadership.
Market Dominance Metrics
The panel on the right displays three key market dominance metrics that indicate how capital is distributed across the cryptocurrency market:
Bitcoin Dominance (BTC.D)
Ethereum Dominance (ETH.D)
Stablecoin Dominance
These indicators provide valuable context alongside the Altseason Index.
For example:
Rising Bitcoin Dominance (BTC.D) often reflects capital rotating away from altcoins and into Bitcoin, indicating a more defensive market environment. Declining Bitcoin Dominance typically signals increasing risk appetite as capital flows into altcoins.
Rising Ethereum Dominance (ETH.D) frequently precedes broader strength across the altcoin market, as Ethereum often leads the early stages of capital rotation.
Rising Stablecoin Dominance generally reflects declining risk appetite, with investors moving capital into stablecoins while waiting for new market opportunities.
The dashboard also displays the 24-hour change in total cryptocurrency market capitalization (%), providing additional context for overall market conditions.
Altcoin Performance vs. Bitcoin
Below the dominance metrics, the Altcoin Performance table ranks tracked altcoins based on their relative performance versus Bitcoin over the past 90 days.
This allows traders to quickly identify which cryptocurrencies are leading or lagging the current market cycle.
Historical Altseason Index
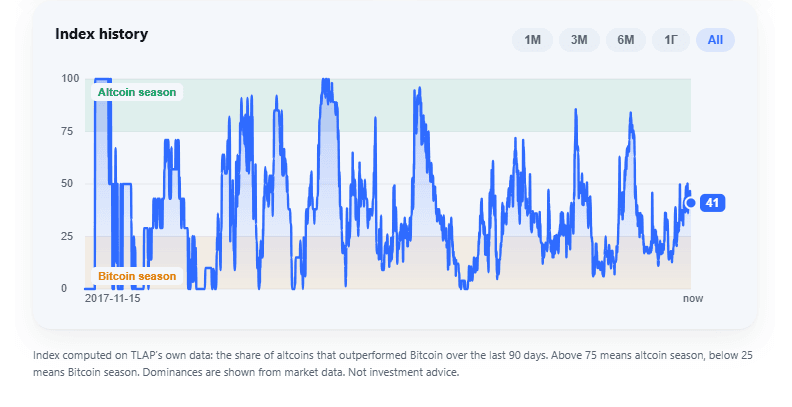
The Historical Altseason Index chart tracks market conditions from November 15, 2017, to the present.
Available time filters include: 1M; 3M; 6M; 1Y; All
The chart highlights two key market zones:
Above 75: Altseason
Below 25: Bitcoin Season
Historical data helps traders compare current conditions with previous crypto market cycles and identify recurring patterns in capital rotation.
Using the Altseason Index in Your Analysis
The Altseason Index is a market regime indicator that helps traders understand where capital is rotating before selecting individual trading opportunities.
It is particularly useful for portfolio allocation and evaluating overall market conditions.
Typical interpretations include:
High index values indicate broad participation across the altcoin market. Extended periods above 75 may also suggest increasingly crowded positioning.
Low index values indicate that capital is rotating back into Bitcoin. Combined with rising Stablecoin Dominance, this may signal a broader risk-off environment.
Transition phases suggest that neither Bitcoin nor altcoins have established clear leadership, making market direction less certain.
Crypto market cycles often develop gradually, with capital rotating first into Bitcoin, then Ethereum, and finally into small-cap altcoins. Monitoring both the Altseason Index and market dominance metrics can help traders recognize these transitions earlier.
Best Practices
The Altseason Index should be used as a market filter, not as a standalone trading signal.
For more robust analysis, combine it with:
technical analysis;
market structure;
volume analysis;
Bitcoin and Ethereum dominance;
risk management.
The Altseason Index reflects recent market behavior rather than forecasting future price movements. It is intended to provide market context and should not be interpreted as investment advice.