
Historical Quotes Download
Historical quotes (market data) contains past price data used to backtest trading strategies, analyze market behavior, and practice trading using real historical market conditions.
TLAP allows you to generate and download historical datasets for multiple markets, including Forex, cryptocurrencies, indices, metals, commodities, and stocks, in formats compatible with MetaTrader 4, MetaTrader 5, Soft4FX Forex Simulator, NinjaTrader 8, CSV, and JSON.
The main advantage is the combination of multiple markets, timeframes, and export formats in one place.
For example, a .ctf file for Soft4FX Forex Simulator can be placed directly into the simulator's data folder, while CSV data can be imported into MetaTrader 4 through the History Center (F2) and used for strategy testing.
One-minute M1 candles are available for 200 of 215 instruments. For the other 15, the data provider does not supply sufficient minute history; choose the minimum available M5 or H1 timeframe shown for the symbol. M1 history depth depends on the exchange and when the instrument began trading.
What Data Can You Download?
The page provides several asset classes:
Forex — currency pairs.
Cryptocurrencies — BTC, ETH and other digital assets.
Indices — S&P 500, Nasdaq, DAX and other major indices.
Metals & Commodities — gold, silver, crude oil, natural gas and other instruments.
U.S. Stocks — liquid U.S. equities.
Russian Stocks — liquid MOEX-listed stocks.
The available symbols and historical data coverage depend on the selected market. This lets you first choose the asset class and then generate historical data for a specific instrument.
How to Download Historical Quotes
The process consists of several steps.
1. Select a Market
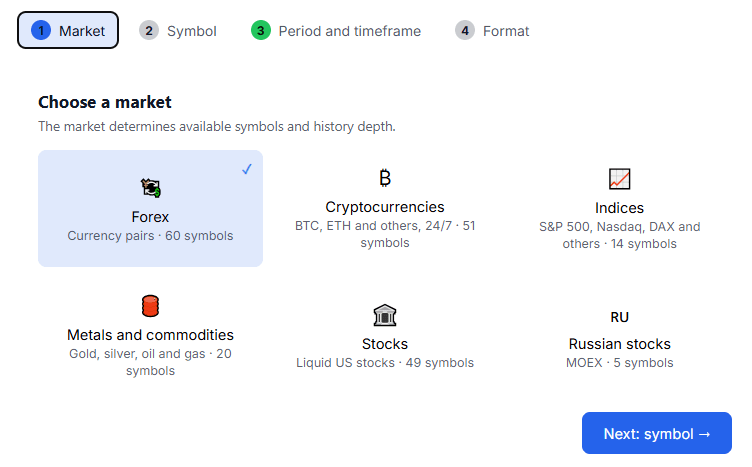
Choose Forex, cryptocurrencies, indices, metals and commodities, U.S. stocks, or Russian stocks.
The selected market determines the available symbols and historical data coverage.
2. Select a Symbol
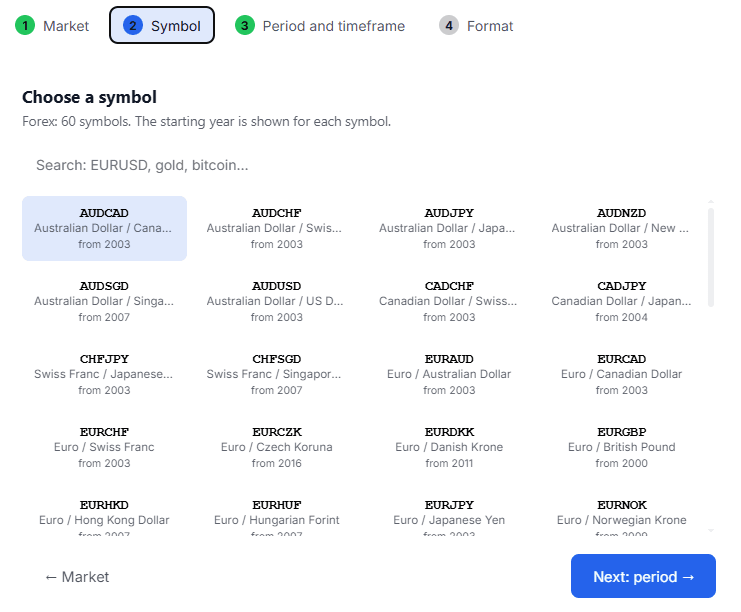
Choose the specific instrument you want to analyze, such as a currency pair, cryptocurrency, stock index, or individual stock.
3. Select the Period and Timeframe
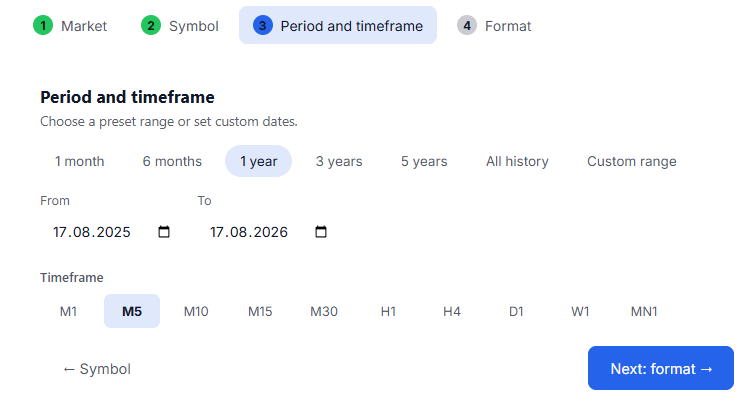
Choose a predefined period or enter custom dates.
For strategy research, use a sufficiently long historical sample to include different market regimes, such as:
trending markets;
range-bound conditions;
high-volatility periods;
low-volatility periods.
Available timeframes range from intraday to long-term: M1 / M5 / M10 / M15 / H1 / H4 / D1 / W1 / MN1.
Choose a timeframe that matches your trading system. Intraday strategies generally require more granular data, while medium- and long-term strategies can often be tested on higher timeframes.
4. Select a Format
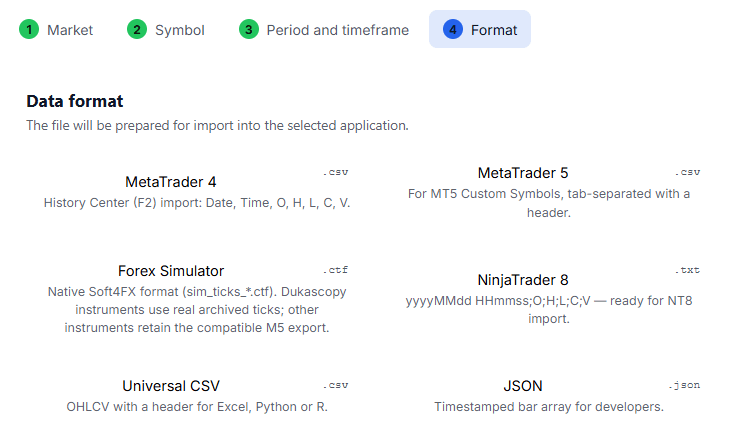
Choose the format that matches your trading platform or workflow: MetaTrader 4, MetaTrader 5, Soft4FX Forex Simulator, NinjaTrader 8, CSV, JSON.
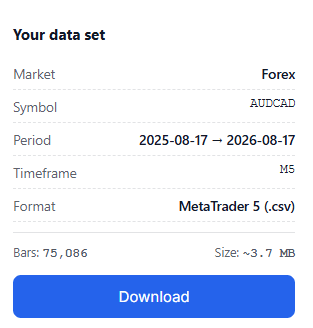
Once all parameters are selected, the generated dataset appears in the Your Dataset section. Review the market, symbol, period, timeframe, and format before downloading the file.
Economic Calendar
The page also provides Forex Factory economic calendar data for use with Soft4FX Forex Simulator.
Combining historical price data with historical economic events makes it possible to analyze not only price behavior but also how markets reacted to economic releases.
This is particularly useful when studying sharp price moves, volatility around major announcements, and strategy performance during news events.
How Historical Data Can Be Used in Trading
Algorithmic Trading
Historical market data is essential for backtesting algorithmic strategies.
You can test:
entry and exit rules;
stop-loss and take-profit settings;
indicator parameters;
filters;
risk-management rules;
position-sizing methods.
You can then compare profitability, drawdown, number of trades, and other performance metrics across different historical periods.
Do not focus only on optimizing parameters on historical data. Test the strategy on a separate out-of-sample period that was not used during optimization to reduce the risk of overfitting.
Manual Trading and Market Analysis
Historical data can also be used to practice recognizing trading setups, test hypotheses, and study how volatility, price behavior, and market reactions to economic news change over time.
Comparing multiple historical periods helps determine whether a trading strategy remains robust under different market conditions.
Historical price data can also be combined with trading simulators that replay the market chronologically, allowing traders to practice without knowing the outcome of future candles in advance.
Important Considerations When Using Historical Data
Historical market data is not a perfect representation of every live trading environment.
Prices, spreads, liquidity, execution quality, and other trading conditions can vary between brokers, exchanges, and data providers.
For this reason, backtest results should ideally be validated using data and trading conditions that closely match the environment in which the strategy is expected to operate.
A longer test period also provides exposure to a wider range of market regimes, reducing the risk of drawing conclusions from a short or unusual period.
TLAP Tools That Work with Historical Data
Downloaded historical data can be used together with other TLAP tools, including strategy tester, the economic calendar, currency pair correlation and the volatility indicator.
Using historical data alongside other TLAP tools can provide a broader view of market conditions and help traders evaluate whether a strategy remains robust across different environments.
Disclaimer
Historical market data is intended for analyzing and testing trading ideas and does not guarantee similar results in the future.
Market conditions can change, and live trading results depend on factors such as liquidity, spreads, slippage, commissions, and execution quality.
Trading financial instruments involves a risk of loss of capital. Information provided by TLAP is for informational and analytical purposes only and does not constitute investment, financial, or trading advice.