
Bitcoin NUPL — BTC Market Cycle Phases
NUPL (Net Unrealized Profit/Loss) is an on-chain indicator that shows whether the aggregate Bitcoin market is in unrealized profit or unrealized loss.
Unlike RSI or MACD, NUPL is not calculated solely from price movements. It also incorporates blockchain transaction data and Realized Cap.
The NUPL formula is:
NUPL = (Market Cap − Realized Cap) / Market Cap
where Market Cap is the current market capitalization of Bitcoin, while Realized Cap is an on-chain valuation metric that estimates the value of BTC based on the price at which coins were last moved.
A positive NUPL value means that Bitcoin's current market valuation is above its realized value. A negative value means that the market valuation is below realized value.
How to Read NUPL on the TLAP Chart
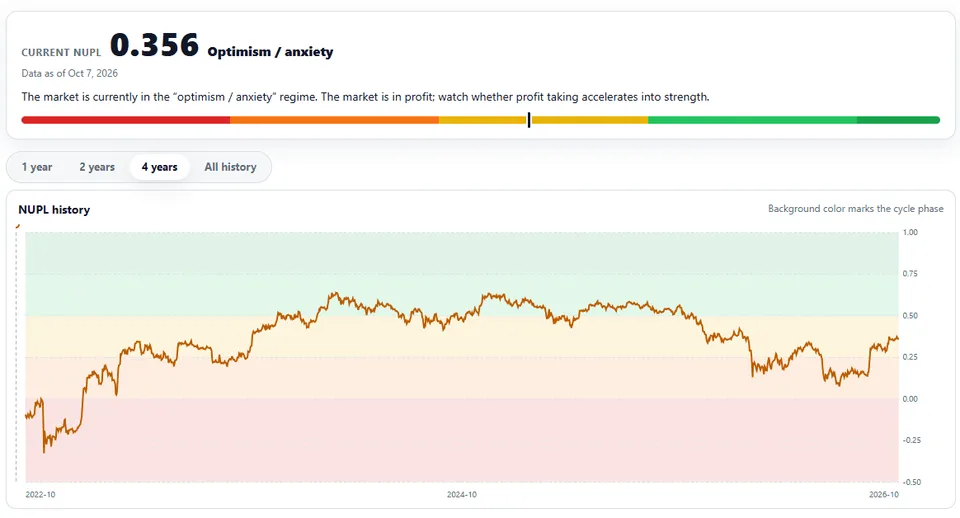
On TLAP, NUPL is divided into historical color-coded zones:
Below 0 — Capitulation.
Aggregate unrealized profit gives way to unrealized losses. This area is typically associated with weak market conditions and deep bear-market phases.
0–0.25 — Hope / Fear.
The market is gradually recovering from losses, but unrealized profits remain relatively limited. Market participants may still be cautious.
0.25–0.50 — Optimism / Anxiety.
Unrealized profits are positive and the market is recovering. However, relatively small corrections can still have a noticeable effect on market sentiment.
0.50–0.75 — Belief / Denial.
Holders have accumulated substantial unrealized profits. As the market continues to rise, the potential for profit-taking may also increase.
Above 0.75 — Euphoria / Greed.
Historically, this is an extreme area that has occurred near significant Bitcoin market-cycle extremes. However, a high NUPL reading is not, by itself, a signal to sell immediately and does not identify the exact timing of a market reversal.
For this reason, it is important to look not only at the zone where NUPL is trading, but also at the direction of the indicator.
A rising NUPL indicates that aggregate unrealized profit is increasing relative to Market Cap, while a falling NUPL indicates that unrealized profit is declining.
Comparing Bitcoin Cycles After the Halving
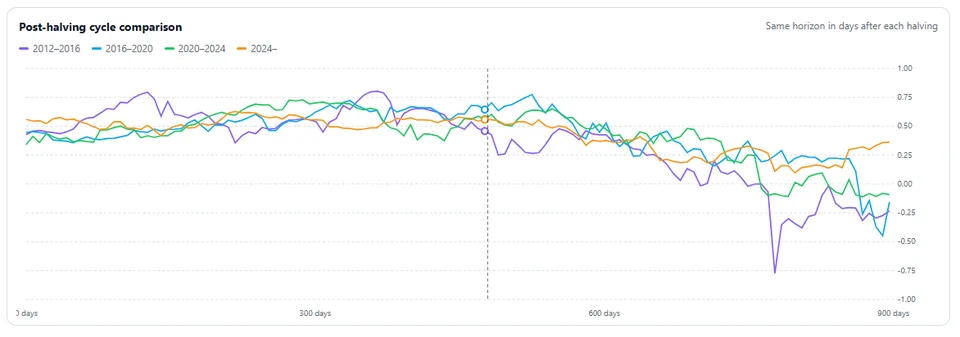
The second chart on the TLAP page compares NUPL across Bitcoin cycles, aligned by the number of days since the 2012, 2016, 2020 and 2024 halvings.
This makes it possible to compare how quickly unrealized profitability changed during different cycles and to see whether the current trajectory resembles previous market cycles.
Such comparisons can be useful for long-term cycle analysis, but they should not be treated as a forecast. Similar chart patterns across different cycles do not guarantee the same price trajectory, timing of a cycle top, or depth of a subsequent correction.
What Is NUPL Used For?
NUPL is best used as an indicator of overall market conditions and long-term Bitcoin cycle dynamics, rather than as a standalone entry or exit signal.
It can be analyzed alongside MVRV, SOPR, Bitcoin price, liquidity conditions and other on-chain metrics.
Combining these indicators can help distinguish ordinary price fluctuations from broader changes in the profitability of Bitcoin holders.
NUPL values may differ slightly across platforms because data sources and Realized Cap methodologies are not always identical.
On TLAP, current NUPL values are sourced from the public BTCFunk API, while the historical NUPL series is calculated using MVRV as:
NUPL = 1 − 1 / MVRV
Small differences from other platforms are therefore normal.
Risks and Limitations
NUPL is based on an on-chain model and does not show the actual purchase price of every individual BTC.
Transfers between self-controlled wallets, exchanges and other addresses can affect the underlying calculation.
In addition, long-dormant or lost coins can influence the estimate of aggregate unrealized profit and may distort the broader picture of market profitability.
For these reasons, NUPL should be used as part of a broader market-analysis framework rather than as a precise price-forecasting tool.
Disclaimer
NUPL and the other data presented on this page are provided for informational and educational purposes only.
The indicator does not guarantee future price movements and is not a standalone buy or sell signal. Historical market patterns may not repeat in the future.
Before making trading or investment decisions, consider market risks and use your own risk-management and capital-allocation strategy.
For the historical part, NUPL is derived from MVRV as 1 − 1/MVRV. Realized capitalization methodologies differ slightly between data providers, so values may vary by a few hundredths across sources.
Compare this cycle view with realized holder profit and loss in Bitcoin SOPR.