
Pi Cycle Top Indicator: Analyze Bitcoin Cycle-Top Conditions
The Pi Cycle Top Indicator is designed to analyze long-term Bitcoin market cycles and identify conditions that have historically occurred near major cycle tops. The methodology compares the 111-day Simple Moving Average (SMA) with 2× the 350-day SMA.
The traditional Pi Cycle Top signal occurs when the 111-day SMA crosses above the 350-day SMA × 2. Historically, this crossover has occurred close to major Bitcoin cycle highs. The indicator should therefore be viewed as a long-term cycle-analysis tool rather than a standalone sell signal.
Pi Cycle Top Indicator Interface
Cycle Top Gauge
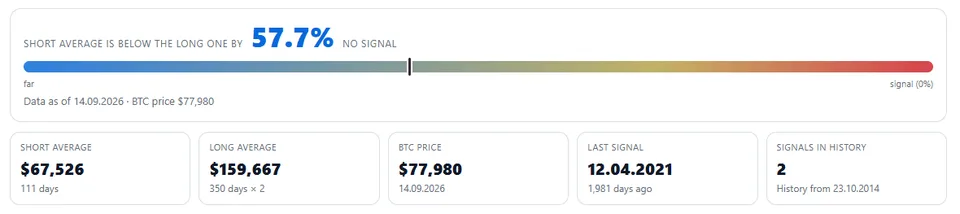
The upper panel shows the current distance between the 111-day SMA and the 350-day SMA × 2.
It displays:
the percentage distance between the two averages;
the current value of the 111-day SMA;
the current value of the 350-day SMA × 2;
the current Bitcoin price;
the date of the latest historical signal;
the total number of signals recorded in the TLAP dataset.
As the distance between the moving averages approaches zero, the market moves closer to the historical crossover condition used by the indicator.
The gauge helps traders monitor the proximity to the signal, rather than treating the percentage value itself as a direct trading signal.
Bitcoin Cycle Chart
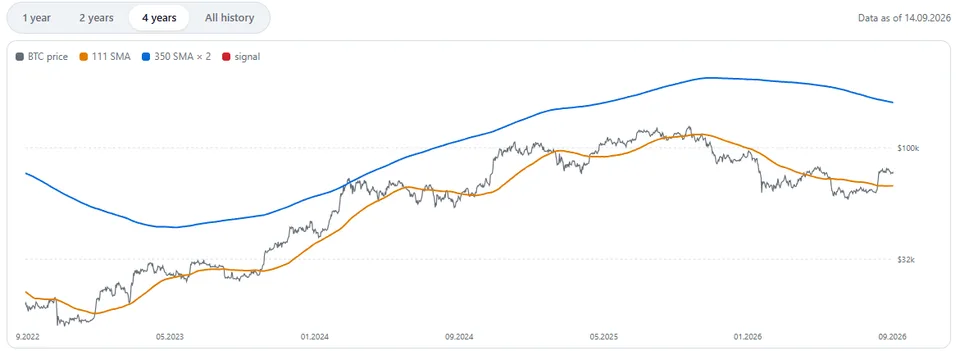
The main chart uses a logarithmic price scale to make Bitcoin's long-term price history easier to compare visually.
You can select different historical ranges: 1Y, 2Y, 4Y and All
The TLAP historical dataset begins in October 2014 and includes:
Bitcoin price;
111-day SMA;
350-day SMA × 2;
historical Pi Cycle Top signals.
This makes it possible to compare the moving-average crossover with major historical Bitcoin cycle highs.
Past Signals
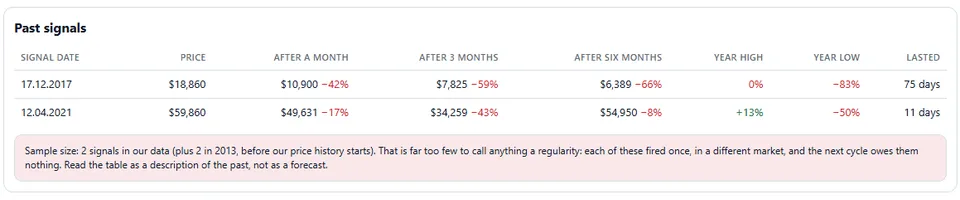
The Past Signals table provides additional statistics for each historical signal.
It includes Bitcoin price performance over: 1 month; 3 months; 6 months.
The table also shows the maximum and minimum Bitcoin price during the following year and the time from each signal to the subsequent reverse crossover.
These statistics provide historical context, but they should not be interpreted as a forecast of future Bitcoin price behavior.
How to Use Pi Cycle Top in Market Analysis
Pi Cycle Top is best used as a long-term cycle indicator. Its main purpose is to show when the current relationship between the two moving averages is approaching a historical cycle-top condition.
Monitor Proximity to the Crossover
When the two averages move closer together, the market approaches the condition monitored by the Pi Cycle Top methodology.
A narrowing gap can therefore be used as a reason to pay closer attention to broader cycle conditions, leverage, sentiment and market positioning.
Identify Potential Cycle-Top Conditions
The primary Pi Cycle Top condition is the 111-day SMA crossing above the 350-day SMA × 2.
Because similar crossovers have occurred near major Bitcoin cycle highs in the past, traders may use the condition as one component of a broader late-cycle analysis.
The crossover should not be treated as proof that Bitcoin has reached its absolute high. Historical relationships do not guarantee the same outcome in future market cycles.
Risk Management
A Pi Cycle Top signal can be useful for risk management rather than automatic position liquidation.
For example, traders may use a confirmed signal as a reason to reconsider position size, reduce excessive leverage, lock in part of accumulated gains, or move toward a more conservative risk profile.
The indicator does not determine how deep a subsequent correction may be or when the next major Bitcoin entry opportunity will occur.
Combine with Other Market Data
Pi Cycle Top becomes more useful when interpreted together with other market information, such as:
on-chain metrics;
trading volume;
derivatives positioning;
Open Interest;
Funding Rate;
market sentiment;
price structure and technical analysis.
The goal is to determine whether several independent measures are pointing toward similar market conditions rather than relying on one historical indicator.
Limitations
The TLAP historical database currently contains only two recorded Pi Cycle Top signals, based on daily closing-price data:
December 17, 2017;
April 12, 2021.
The available dataset begins in October 2014, so the historical sample is too small to draw strong statistical conclusions.
The indicator also has important practical limitations. It does not measure Bitcoin's intrinsic value, predict the exact market top, or estimate the size or duration of a future correction. The crossover can remain absent for long periods between major market-cycle events.
Historical performance should therefore be treated as context rather than as a guarantee of future results.
Important Notice
The Pi Cycle Top Indicator is provided for market analysis and educational purposes only. Historical crossover behavior does not guarantee future results. The indicator is not investment advice and should not be used as the sole basis for entering, exiting, or managing a Bitcoin position.
Always consider market conditions, liquidity, volatility, leverage, and your own risk tolerance before making trading decisions.
Compare this cycle view with realized holder profit and loss in Bitcoin SOPR.