
Crypto Correlation — TLAP cryptocurrency correlation tool
What Is Crypto Correlation?
Crypto correlation measures how closely digital assets move in relation to each other over a given period. By analyzing correlations between Bitcoin, Ethereum, Solana and other crypto assets , traders can better manage portfolio exposure, avoid concentrated exposure, and gain additional confidence in their trade setups.
Crypto correlations are highly dynamic. Relationships between digital assets evolve as liquidity rotates between Bitcoin and altcoins, market sentiment shifts, ETF flows change, and macroeconomic events influence the crypto market. Correlations should therefore be monitored regularly rather than treated as permanent market relationships.
How to Use the TLAP Crypto Correlation Tool
The TLAP Crypto Correlation Tool measures relationships between Bitcoin, Ethereum, Solana and other digital assets (BNB, XRP, ADA, DOGE, TRX) across multiple timeframes, from 1 hour to 1 year.
The platform provides two complementary views: Correlation Heatmap and
Correlation Matrix.
Together they allow traders to quickly identify highly correlated assets, monitor capital rotation, and avoid concentrated portfolio exposure.
Correlation Heatmap
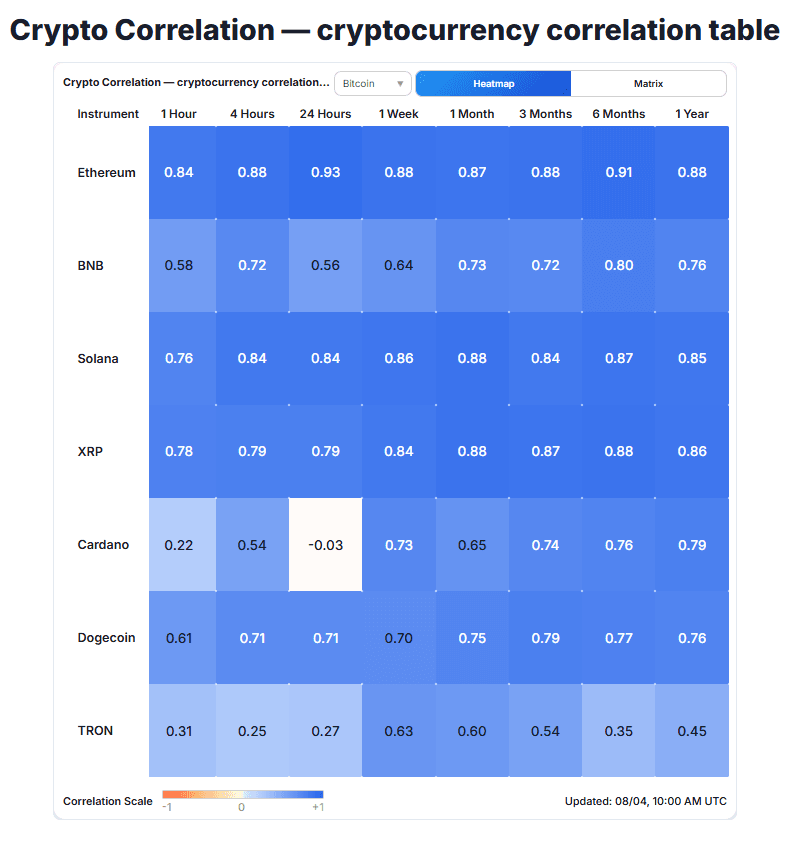
The Correlation Heatmap shows how closely the selected crypto asset is correlated with every other tracked asset.
The color scale represents both the strength and direction of the correlation:
Dark blue — strong positive correlation.
Light blue — moderate positive correlation.
White / beige — little or no correlation.
Orange to red — strong negative correlation.
The deeper the color, the stronger the correlation between the two crypto assets.
Correlation Matrix
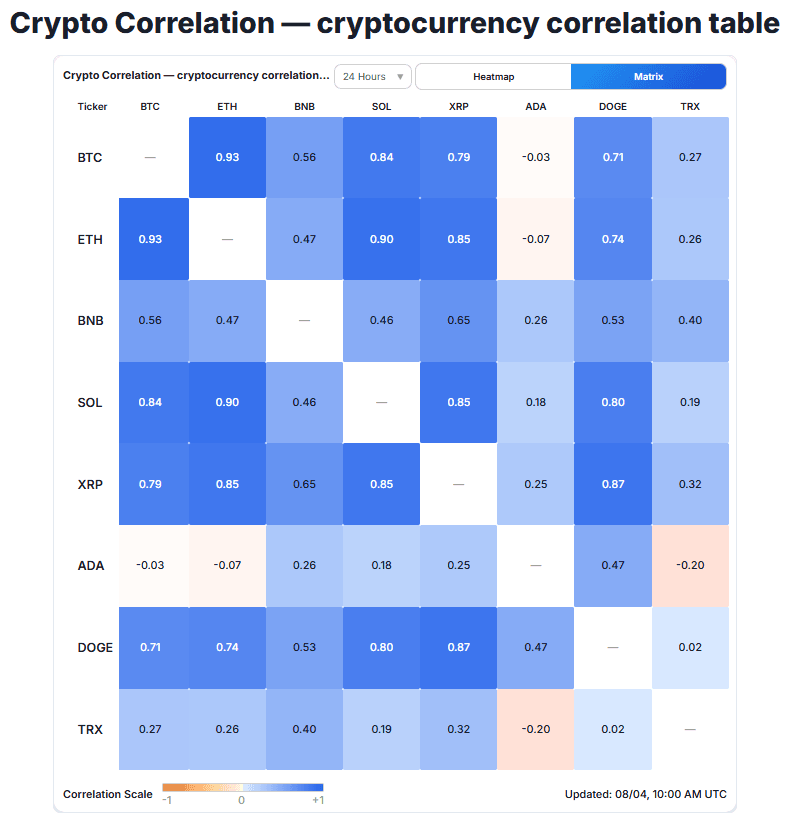
The Correlation Matrix displays correlations across the entire crypto market simultaneously.
Instead of comparing one asset against the rest, it visualizes how Bitcoin, Ethereum and leading altcoins move relative to one another.
This makes it easy to identify clusters of highly correlated assets and quickly spot coins beginning to decouple from the broader market.
Understanding the Correlation Coefficient
The correlation coefficient ranges from −1 to +1.
Interpret the values as follows:
+1.00 — the two assets move almost identically.
+0.70 to +1.00 — strong positive correlation. Holding both assets often results in nearly identical market exposure.
−0.70 to −1.00 — strong negative correlation. The assets typically move in opposite directions and may provide partial hedging opportunities.
−0.30 to +0.30 — weak or no meaningful correlation.
±0.30 to ±0.70 — moderate correlation that provides useful market context but should not be treated as a standalone trading signal.
Always evaluate correlations using the timeframe that matches your trading strategy. Two assets may be highly correlated on the daily chart while behaving independently during intraday trading.
How to Analyze Crypto Correlation
To get the most value from the tool:
Select the crypto asset you plan to trade.
Choose the calculation period and timeframe that match your trading style.
Identify assets with strong positive or negative correlations.
Compare price action, market structure, liquidity, and key support and resistance levels across correlated assets.
Check whether a new position simply increases exposure to the same market move.
Recalculate correlations regularly, especially after ETF approvals, Federal Reserve meetings, token unlocks, major exchange listings, significant liquidation events, or sharp changes in market volatility.
Practical Trading Applications
Avoid Concentrated Exposure
Buying BTC, ETH, SOL, and several Layer-1 tokens with strong positive correlations may appear diversified, while in reality you're simply increasing exposure to the same market trend.
The correlation tool helps identify hidden concentration risk before entering additional positions.
Confirm Trade Setups
When multiple correlated assets break key resistance levels or generate similar technical signals simultaneously, confidence in the trade setup increases.
Conversely, if only one coin is outperforming the broader market while the rest remain weak, the move may lack broad market participation.
Identify Market Leaders
Bull markets usually have clear market leaders.
If Bitcoin starts trending higher and Ethereum quickly follows while other large-cap altcoins remain in consolidation, those lagging coins may become the next candidates for capital rotation.
Recognizing leading and lagging assets can help traders position themselves before broader market momentum develops.
Spot Correlation Breakdowns
Sometimes a crypto asset stops following Bitcoin or Ethereum altogether.
This may reflect ecosystem-specific catalysts, growing on-chain activity, ETF-related capital flows, token unlocks, or genuine relative strength.
Correlation breakdowns often deserve closer attention because they can mark the beginning of an independent trend.
Risk Management
Correlation analysis helps build a more balanced crypto portfolio.
Instead of holding multiple assets that move almost identically, traders can diversify across coins with lower correlations, potentially reducing overall portfolio volatility without sacrificing market exposure.
Important Notice
The TLAP Crypto Correlation Tool is designed to help traders understand relationships across the cryptocurrency market and improve portfolio risk management.
It is not designed to generate trading signals or determine market entry timing.
Historical correlations do not guarantee future relationships. Crypto correlations are highly dynamic and can change rapidly as liquidity rotates between Bitcoin, Ethereum, stablecoins, and altcoins.
Always combine correlation analysis with price action, market structure, liquidity, volume, on-chain metrics, and sound risk management before making trading decisions.
This tool is provided for informational purposes only and does not constitute financial or investment advice.