
Crypto Open Interest — OI Across 5 Exchanges + CME
Open Interest (OI) measures the total number of outstanding futures contracts that remain open. Changes in OI show whether the amount of open futures exposure is expanding or contracting.
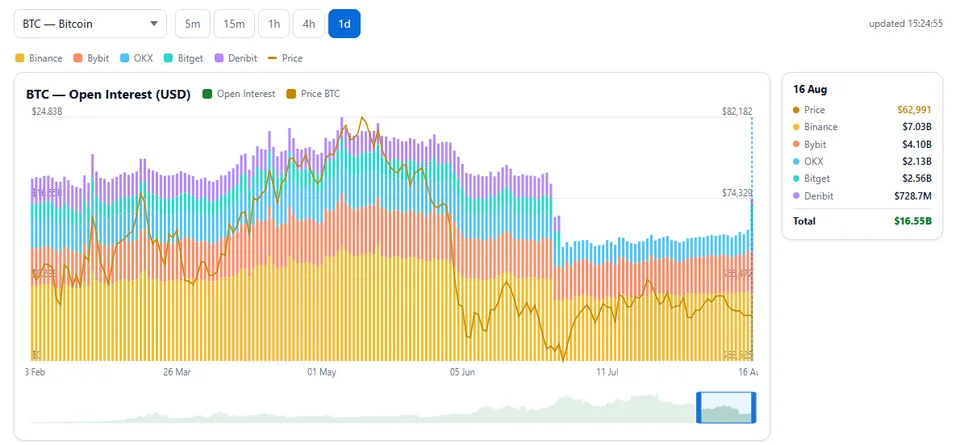
The TLAP Open Interest Indicator aggregates Open Interest data for perpetual futures across five major crypto exchanges: Binance, Bybit, OKX, Bitget, and Deribit.
The indicator also displays separate Bitcoin futures Open Interest from CME. This provides additional context on positioning in the CME Bitcoin futures market. CME data is sourced from the weekly CFTC Commitments of Traders (COT) report.
The main Open Interest metric shows the total value of outstanding open futures contracts in USD.
Indicator Overview
Crypto Exchanges
Select an Asset
Choose the cryptocurrency futures market you want to analyze, such as BTC.
Select a Timeframe
Available timeframes range from short-term to daily: 5m, 15m, 1h, 4h, 1d.
Open Interest History
Open Interest is displayed as a bar chart, making it easy to track increases and decreases in aggregate futures exposure.
Each bar combines data from the supported exchanges, allowing you to see how much each exchange contributes to total Open Interest.
Price Overlay
A price line is overlaid on the Open Interest chart, allowing you to compare changes in BTC price with changes in futures positioning.
Historical Data
Zoom and navigate through the chart to analyze longer-term changes in both price and Open Interest.
Hovering over an individual bar displays a breakdown of each exchange's contribution to total Open Interest for the relevant date, shown in USD.
CME Bitcoin Futures
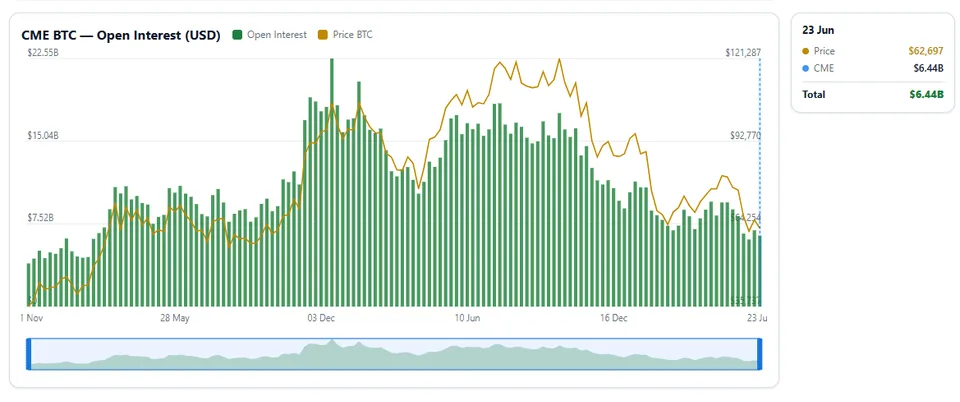
The main CME chart shows changes in Bitcoin futures Open Interest in USD.
A BTC price line is overlaid on the chart, allowing traders to compare price movements with changes in futures positioning in the CME Bitcoin futures market.
The smaller chart below the main visualization lets you select a specific historical period and examine BTC price and CME Open Interest in greater detail.
Hovering over an individual bar displays the Open Interest value and BTC price for the relevant reporting date.
How to Analyze Open Interest
The simplest approach is to compare price action, Open Interest, and volume.
An important point: rising OI does not necessarily mean that new capital is entering the market. It means that more futures contracts are remaining open. OI also cannot determine whether buyers or sellers are in control, because every futures contract has both a long and a short side.
Price Rising + OI Rising
Price is moving higher while Open Interest increases.
This combination indicates that open futures exposure is expanding as price moves higher and can provide additional confirmation of the prevailing bullish move.
For stronger confirmation, compare OI with volume, funding, liquidation data, and price structure.
Price Falling + OI Rising
Price is declining while Open Interest increases.
This can reinforce the prevailing bearish move by showing that open futures exposure is expanding as price moves lower. However, OI alone cannot show whether the additional exposure is predominantly long or short.
Price Rising + OI Falling
Price is rising while Open Interest declines.
The move may be driven partly by short covering or the closing of existing positions rather than by an increase in open futures exposure.
Such a move can be less persistent than a rally accompanied by rising OI, although the broader market context remains critical.
Price Falling + OI Falling
Price is declining while Open Interest decreases.
This can indicate position closing or deleveraging, including long liquidation.
The combination may signal that the current move is losing participation, but it can also occur during an aggressive liquidation event.
These four combinations should be treated as market context rather than standalone trading signals.
How Traders Use Open Interest
Confirming a Trend
When price breaks a key level while Open Interest increases, the move is accompanied by greater open futures exposure.
A breakout with rising OI can therefore provide stronger confirmation than a similar price move accompanied by falling OI.
For additional confirmation, compare the move with volume, market structure, and liquidation activity.
Identifying Potential Trend Exhaustion
If price continues to make new highs or lows while Open Interest stops increasing or begins to decline, the structure of the move may be changing.
For example, a rally may increasingly reflect short covering rather than continued growth in open positions.
Such divergences can serve as a warning that momentum may be weakening. Traders should then look for confirmation from price action, volume, or key technical levels.
Analyzing Breakouts
When price breaks out of a range, Open Interest helps assess how futures positioning is changing around the move.
A breakout accompanied by rising price, volume, and OI may indicate active expansion in futures exposure.
If price breaks a key level while OI declines, the move may be driven more by position closing or liquidation and may be less sustainable.
Analyzing Liquidations and Sharp Moves
In highly leveraged crypto markets, a sharp decline in Open Interest following a strong price move can indicate widespread position closures or liquidations.
For example, a rapid BTC sell-off accompanied by a sharp drop in OI may indicate that leveraged long positions are being liquidated or closed.
After a major deleveraging event, some of the previously crowded leverage may have been flushed out of the market. This can change market structure, but it does not guarantee a reversal.
Identifying Crowded Futures Positioning
A prolonged and rapid increase in Open Interest during a strong directional move can indicate that a large amount of futures exposure is accumulating.
When leverage and open positions become heavily concentrated, the market may become more vulnerable to sharp moves triggered by liquidations and forced position closures.
For this type of analysis, combine Open Interest with:
Funding Rate — to assess the cost of holding perpetual futures positions and identify whether funding is favoring longs or shorts;
Long/Short Ratio — to compare the reported distribution of long and short positioning;
Trading Volume — to assess participation and the strength of the move;
Support and Resistance — to identify key price levels;
Liquidation Data — to monitor potential liquidation clusters and cascading position closures.
Why Exchange and CME OI Should Be Viewed Separately
Exchange-level perpetual futures data and CME Bitcoin futures provide different market contexts.
Crypto exchange OI reflects activity in the highly leveraged perpetual futures market, where funding rates, liquidations, and leverage can have a major impact on price action.
CME Bitcoin futures provide a separate view of positioning in the CME futures market. CFTC-reported data can add additional context when analyzing the positioning of different trader categories.
Comparing exchange perpetual futures OI with CME futures data can help traders determine whether changes in derivatives positioning are broad-based or concentrated in a particular segment of the market.
Practical Open Interest Workflow
A practical workflow is:
Price → Open Interest → Volume → Funding → Liquidations → Market Structure → Trade Setup
Use OI to understand how futures exposure is changing, then combine it with other derivatives and price-based metrics before making a trading decision.
The goal is not to predict price direction from OI alone, but to understand whether a price move is being accompanied by position building, short covering, long liquidation, or broader deleveraging.
Important Notice
The TLAP Open Interest Indicator is provided for informational and educational purposes and is not an investment recommendation or standalone trading signal.
Open Interest does not determine future price direction and cannot, by itself, identify whether new positions are predominantly long or short.
OI should be analyzed together with price action, volume, funding rates, liquidation data, market structure, and other relevant market information.
Trading cryptocurrency and futures markets involves a high risk of loss, including the potential loss of the entire trading capital. Always assess your own risk and use appropriate position sizing and risk management.