
Volatility Indicator for Forex Trading | Risk & Range
Forex Volatility Indicator: How to Read the Data and Use the Tool
What Is the Forex Volatility Indicator?
The TLAP Forex Volatility Indicator helps traders measure and compare the historical volatility of Forex pairs across multiple timeframes.
Using historical market data, the indicator analyzes average price movement (measured in pips) over hourly, daily, monthly, and long-term periods. This allows traders to compare volatility across different markets, identify the most active trading sessions, and select instruments that best fit their trading strategy.
Instead of manually reviewing dozens of charts, you can quickly compare major and exotic currency pairs—as well as supported cryptocurrencies—and identify the instruments with the highest historical volatility.
Indicator Overview
The interface is divided into two main sections.
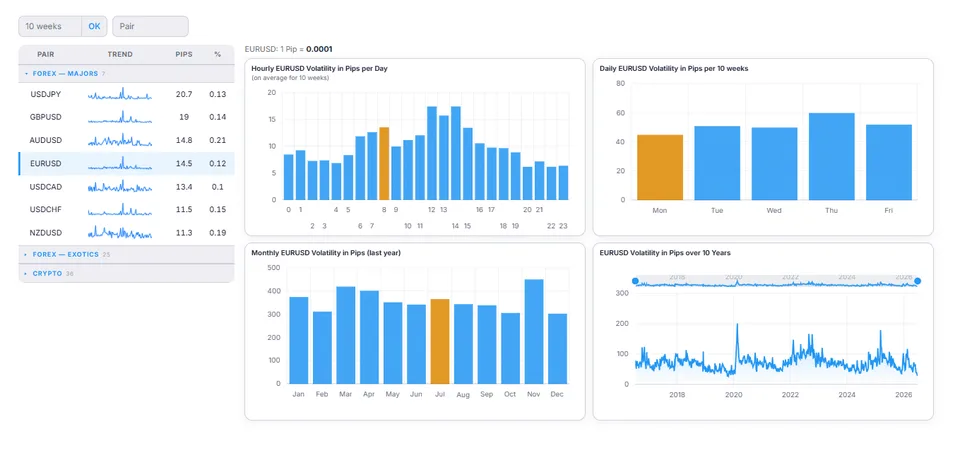
Left Panel: Market Overview
The left panel displays major and exotic Forex pairs together with supported cryptocurrencies. For each instrument, the indicator shows:
a sparkline illustrating recent volatility trends;
the average price movement, expressed in pips;
the instrument's relative volatility percentage.
This overview allows traders to compare market volatility across multiple instruments in seconds and quickly identify those with the largest average trading ranges.
At the top of the page, you can select both the analysis period (10 weeks by default) and the trading instrument.
Right Panel: Volatility Analysis
The right panel provides historical volatility statistics across several timeframes.
Average Hourly Volatility. Shows the average number of pips the market moves during each hour of the trading day over the selected period. This helps intraday traders identify the most volatile trading hours.
Average Daily Volatility by Weekday. Compares the average daily trading range for each weekday over the selected period. This helps traders identify which trading days typically experience higher or lower volatility.
Average Monthly Volatility. Displays the average monthly trading range over the previous year, making it easier to compare recurring volatility patterns throughout the calendar year.
10-Year Volatility History. A long-term chart showing how historical volatility has evolved over the past decade. This enables traders to compare current volatility with historical averages and identify periods of unusually high or unusually low market volatility.
How to Use the Indicator
Using the Forex Volatility Indicator is simple.
Select the currency pair you plan to trade.
Choose an analysis period. The default 10-week setting provides a balanced view for most trading strategies.
Review Average Hourly Volatility to identify the most volatile trading hours for intraday trading.
Compare volatility by weekday. If Fridays consistently show lower average trading ranges, you may choose to avoid opening new positions late in the week.
Adjust your risk management. Stop-loss and take-profit levels should reflect typical market volatility. For example, if a currency pair averages 80 pips per day, a 150-pip take-profit target may be unrealistic, while a 10-pip stop-loss may be too tight for normal market conditions.
Why Use the TLAP Forex Volatility Indicator?
The Forex Volatility Indicator supports a wide range of trading styles.
Compare Trading Instruments
Quickly compare multiple instruments and identify the currency pairs with the highest historical volatility and the largest average trading ranges.
Multi-Timeframe Volatility Analysis. Analyze hourly, weekday, monthly, and long-term volatility in one place without switching between multiple charts or analytical tools.
Scalping and Intraday Trading. Average hourly volatility helps traders focus on the most volatile trading sessions while avoiding periods that typically generate limited price movement.
Swing Trading. Monthly and long-term volatility statistics help determine whether an instrument's typical price movement matches your intended holding period.
Risk Management. Use historical volatility to set more realistic stop-loss and take-profit levels instead of relying on arbitrary distances.
Strategy Testing. Compare your strategy with typical market conditions. For example, if your trading system targets 200 pips per trade while the instrument's average daily range is only 50 pips, it may be worth reviewing your trade management parameters and profit objectives.