
Seasonal Currency Movements for Forex Traders
Forex Seasonality Indicator: Analyze Historical Seasonal Trends
What Is the Forex Seasonality Indicator?
The TLAP Forex Seasonality Indicator helps traders identify recurring seasonal trends across Forex, commodities, cryptocurrencies, indices, and stocks using historical price data.
Rather than generating buy or sell signals, the indicator reveals historical seasonal tendencies — showing when an instrument has typically strengthened, weakened, or traded within a range during different periods of the year.
Seasonality represents a statistical market bias, not a prediction. Used alongside technical and fundamental analysis, it can serve as a valuable directional filter when evaluating potential trade setups.
Dashboard Overview
The main chart displays the historical seasonal performance of the selected instrument.
Above the chart, you'll find the current market price together with percentage performance over the past 7, 30, 90, and 360 days, providing quick context for recent price action.
Seasonal Performance Chart
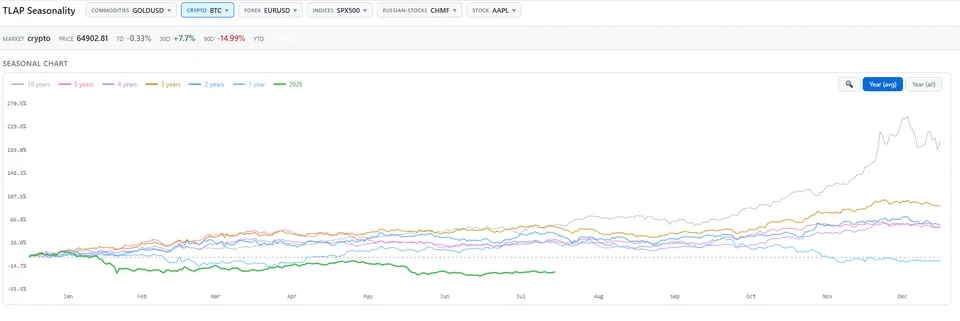
The chart compares historical seasonal trends over multiple lookback periods.
The X-axis represents the calendar year, from January through December.
The Y-axis shows cumulative percentage performance relative to the beginning of the year.
Each colored line represents a different historical dataset.
Available periods include:
10 Years — average seasonal performance over the last ten years;
5 Years — average performance over the last five years;
additional historical averages for shorter lookback periods;
Current Year (green) — the instrument's actual performance this year.
Individual datasets can be enabled or hidden to simplify the comparison.
The indicator offers two visualization modes:
Average by Period — compares averaged seasonal performance over different historical windows (1 year, 2 years, 3 years, etc.);
All Years — displays the actual seasonal performance for every available historical year.
Historical Returns Table
Below the chart, the Returns (%) table complements the visual analysis with historical return statistics.
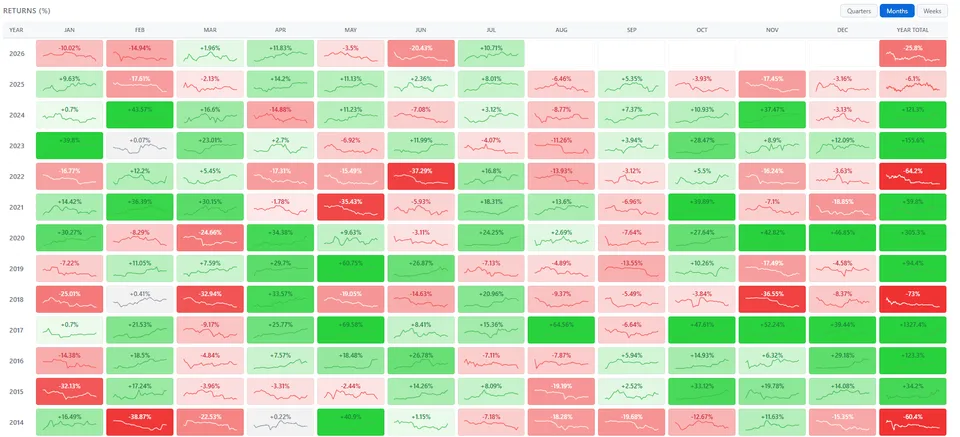
Historical data can be viewed by: quarter; month; week.
Each cell displays percentage performance for the selected period.
Green indicates historically positive performance.
Red indicates historically negative performance.
Color intensity reflects the magnitude of the move.
A miniature price chart inside each cell provides additional context, helping traders distinguish between steady trends, volatile swings, and range-bound conditions.
Combining the chart with historical statistics makes it easy to identify periods that have consistently delivered stronger or weaker performance and use seasonality as an additional market filter.
How to Interpret Seasonality
The primary objective is to compare current price action with historical seasonal behavior.
When multiple historical datasets point in the same direction, they suggest a stronger seasonal bias. While seasonality never guarantees future performance, consistent historical patterns may indicate periods when an instrument has historically been more likely to strengthen or weaken.
Comparing the Current Year with historical averages also helps identify whether price is following its typical seasonal pattern or diverging from it. Significant deviations may reflect changing macroeconomic conditions, unexpected news, or shifts in market sentiment.
Seasonality should be treated as a directional filter, not a standalone trading signal. It is most effective when combined with technical analysis, support and resistance levels, volume analysis, and a well-defined trading strategy.
Using Seasonality to Find Trade Setups
A common approach is to trade in the direction of the prevailing seasonal bias.
If historical seasonality favors higher prices, wait for confirmation from your trading strategy before entering a long position—for example, a breakout above resistance, a bullish price action pattern, or another validated technical signal.
Likewise, if seasonal analysis suggests a bearish bias, look for confirmation before considering short positions.
When current price action moves against a strong historical seasonal tendency, traders may choose to reduce position size, wait for additional confirmation, or avoid the trade altogether.
Seasonality is particularly valuable for swing traders and position traders holding trades for several days or weeks, where broader market tendencies tend to have a greater influence than short-term price fluctuations.