
Seasonal Cycles in Markets: How Copper, Oil, Wheat, and Currencies Move

Seasonality in financial markets is recurring price and volume patterns over time. It is perhaps one of the oldest and most intuitive pricing factors.
Long before exchange quotes and complex derivatives appeared, human activity obeyed the cycles of nature: harvesting, navigation of merchant ships, the heating season. These cyclical patterns became rooted in traders' collective unconscious and still influence price movements, although the very concept of seasonality has undergone a colossal transformation.
History of the Season's Influence on Pricing
In the classical sense, seasonality in financial markets is a statistically observable tendency of assets to rise or fall during certain calendar periods of the year. However, the strength and nature of these moves are not static. The evolution of seasonality can be roughly divided into three key historical eras: pre-industrial, industrial, and modern globalized.
In the agrarian era, seasonality was “rigid” and was determined solely by the physical availability of the commodity. Grain prices collapsed in autumn, immediately after the harvest, and soared in spring during “hungry disruptions,” while transport infrastructure was underdeveloped and did not allow stocks to be moved quickly between continents.
The Industrial Revolution of the 19th and 20th centuries blurred this rigidity. The development of railways, steam fleets, and then tankers led to the smoothing of interseasonal spreads. A new, industrial seasonality emerged, linked to cycles of business activity: metal purchases by construction companies in spring, rising consumption of coal and petroleum products in winter, summer maintenance shutdowns at plants. Seasonality turned from agricultural into industrial.
In those periods when commodity chains were less global, local production and transport constraints were reflected more strongly in prices.
As the market became international, some seasonality smoothed out: now the same industrial pause in China or Europe can affect global inventories and spreads far more than local weather. This is a good example of how seasonality does not disappear, but changes form.
In the financial era, especially after the expansion of futures, index strategies, and electronic markets, behavioral and portfolio effects were added to physical seasonality: rebalancing, hedging, fund positioning, and reactions to macro data.
Seasonality became more “regime-based”: in some periods it is clearly expressed, in others it is almost unnoticeable. This does not cancel seasonal patterns, but makes them dependent on the market structure and the time in which we measure them.
Seasonality in Modern Markets
Food Products (Using Wheat as an Example)
The grain market is the quintessence of seasonal trading. Unlike metals or oil, the supply of wheat cannot be distributed evenly throughout the year; it comes to the market in waves that depend on astronomical cycles.
In the past, seasonality was binary: shortage in spring and surplus in autumn. Today, global logistics have smoothed this imbalance. In addition, the special feature of wheat is that its seasonality is global and “shifted.”
The harvest in the Northern Hemisphere falls at one time of year, and in the Southern Hemisphere at the opposite time, so the global picture depends on which part of exports is currently in the harvesting phase and which is in the sowing or overwintering phase.
That is why seasonal analysis in the grain market is rarely limited to one country: one needs to look at the balance of the Northern and Southern Hemispheres, exporters' stocks, the weather, and when the market begins to reprice the new harvest long before physical delivery. The higher the share of stocks and the flexibility of logistics, the weaker the “pure” seasonality; the closer the market is to a point of physical shortage, the stronger its influence.
But weather risks in critical phases, such as sowing, overwintering, grain filling, and harvesting, can still sharply intensify seasonal fluctuations.
Moreover, wars, sanctions, or port blockades (as happened with Ukrainian exports in 2022) can return the market to the “wild” seasonality of past centuries, when every tonne counts in a specific region.
Winter to early spring (December to March). Winter wheat in Russia, the United States, and Europe is under snow and dormant. The market trades not the fact, but expectations. Any report of severe frosts without snow (winterkill) or a lack of moisture in the soil leads to a sharp rise in quotes. This is the season of “weather premiums” for risk.
Spring to early summer (May to June). Ripening and harvesting of winter wheat in India, and then in the Northern Hemisphere (United States, Russia, Ukraine, EU). As combines enter the fields and elevators fill with fresh grain, physical supply rises sharply. This almost always creates bearish pressure on prices.
Summer (June to August). The harvesting of spring wheat begins. Pressure intensifies. Futures often show annual lows at the peak of harvesting. The pressure is especially noticeable when cheap Russian grain arrives on the world market in July-August.
Autumn (September to November). Sowing of winter crops for the next year's harvest begins. The market watches the pace of work. At the same time, the harvest in Argentina and Australia comes into focus. The period from September to November is often a time of price recovery after harvesting, if demand from importers remains stable and farmers are in no hurry to sell grain at low prices.
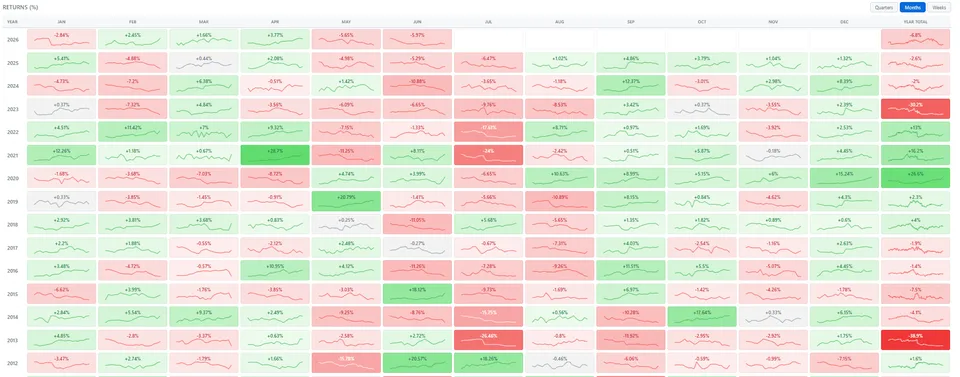
You can study seasonality in the wheat market and other food products on the seasonal movements page of TLAP.
Energy Resources
The oil market has perhaps the most complex and multilayered seasonality. Seasonality is often most noticeable not in crude oil itself, but in petroleum products and refining: demand for different refining components (gasoline, diesel, aviation kerosene, fuel oil) moves in counterphase at different times of the year, while the cost of crude oil changes less markedly.
Before the shale revolution of the 2010s, the seasonal peak in gasoline demand was the dominant force that almost reliably lifted the WTI and Brent markets in July. Now that the United States has become a net exporter and the structure of the global economy has changed, this pattern has become less pronounced. Horizontal drilling technology allows production to be increased quickly at the slightest rise in prices, smoothing the amplitude of seasonal waves. In addition, the OPEC+ factor, which manually regulates supply regardless of the time of year, introduces distortions into the natural rhythm.
Another important thing has historically happened with oil: part of its seasonality has become managed. Refineries, traders, and end consumers now know in advance about summer demand and plan maintenance, inventories, and hedging. Therefore, the seasonal effect in oil has largely shifted from “surprise” to “expected regularity”, which the market tries to price in ahead of time. This does not mean that seasonality has disappeared; rather, it has become more predictable and partly built into quotes before the season itself arrives.
The seasonal cycle of oil looks like this.
Winter (December - February). The heating season begins in the Northern Hemisphere. Demand for heating oil and diesel fuel rises, especially in Europe and the United States. This period supports oil prices, but is often restrained by the peak of tax payments and low automobile activity.
Spring (March - May). This is the classic off-season period. Refineries around the world shut down for scheduled maintenance, switching to production of summer fuel grades. Crude oil consumption by refineries falls, which often weighs on quotes. During this period, crude inventories traditionally accumulate in storage facilities.
Summer (June - August). The U.S. driving season is the strongest driver of gasoline demand. Millions of Americans go on vacation by car. Refinery utilization reaches peak levels to saturate the market with motor fuel. Crude oil is actively consumed, which almost always pushes prices upward. Demand for jet fuel also rises in parallel.
Autumn (September - October). Oil trading in autumn is trading risks. The Atlantic hurricane season in the Gulf of Mexico can temporarily halt up to 90% of production and refining in the region, causing sharp price spikes. The impact of hurricanes (Katrina, Harvey, Ida) has historically created powerful but short-lived volatility spikes.
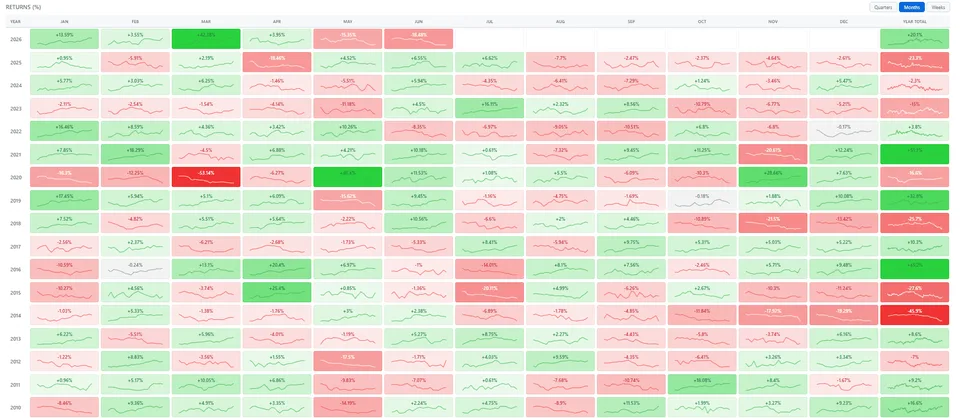
You can study seasonality in energy markets on TLAP's seasonal movements page.
Industrial Metals (Using Copper as an Example)
Copper is one of the best examples of how physical seasonality and the macroeconomic cycle overlap.
The World Bank directly notes that price cycles of major industrial metals, including copper, usually follow global economic cycles and industrial output. On the other hand, copper also has a noticeable calendar logic of inventories: the CME indicates that visible copper inventories usually rise between November/December and March, while in some years the peak shifts earlier because of Chinese holidays, including Lunar New Year.
In the 1970s and 1980s, copper seasonality was dictated almost exclusively by the U.S. housing market and automobile manufacturing. The peak fell strictly in spring.
At the beginning of the 21st century, the center of gravity shifted to China, which accounts for more than 50% of global consumption. This shifted the focus to February-March, immediately after the Chinese holidays.
In the 2020s, the market is driven by demand from energy companies that need to develop capacity to meet the needs of AI data centers.
Special attention should be paid to such a factor as “strike seasonality.” In producing countries such as Chile and Peru, labor contract negotiations often take place in the middle of the year, creating risks of supply disruptions precisely during a period of high demand.
The classic modern pattern of copper seasonality looks like this.
January - February. Copper quotes are usually inclined to rise at this time. The key driver is Asia, particularly China. After the celebration of Chinese New Year (which falls in late January - February), industry awakens. Plants resume work, warehouse inventories begin to be replenished, and the so-called “spring demand rally” forms. American and European consumers also start purchasing for the new construction season.
March - April. At this time, the construction sector in the Northern Hemisphere reaches planned capacity. Consumption of rolled copper products in infrastructure projects peaks. During this period, prices often reach local annual highs amid strong physical demand.
May - June. Cooling or “Sell in May.” The exchange-market folklore of “go away in May” has a fundamental basis for copper. The first wave of spring purchases is complete, market participants leave for summer holidays, and construction activity in some southern regions may slow because of extreme heat. However, this is not a collapse, but rather consolidation or a moderate correction before autumn.
July - September. Business activity returns. Purchases are made ahead of the fourth quarter, when contractors need to deliver projects before the cold weather. This creates a second, autumn impulse for quotes.
October - November. During this period, the market falls into hibernation. The main purchases have already been made. Investors prepare to work on the next projects.
Thus, seasonality in the copper market more often appears not as a simple scheme of “up in January, down in July,” but as a bundle of inventories, logistics, holiday shutdowns, and expectations for industrial demand.
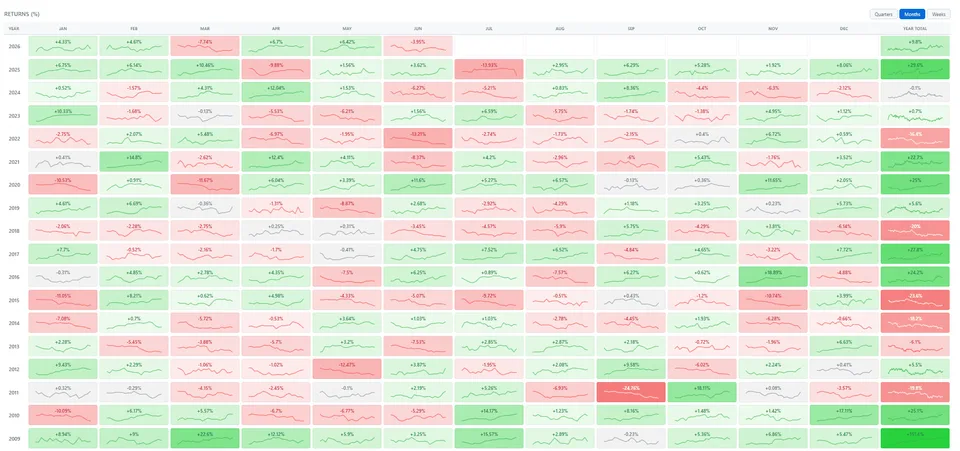
You can study seasonality in energy markets on TLAP's seasonal movements page.
Currencies
Does seasonality exist in the currency market? The classical school argues that currencies are the relative value of economies, and they are only weakly exposed to seasonal fluctuations.
It is especially worth noting that currency seasonality is extremely unreliable because of central bank intervention. At the same time, for currencies it is especially important not to confuse seasonality with a regime shift. What looks like a stable calendar pattern in one decade may disappear in another because of changes in interest rates, export structure, central bank policy, or the behavior of international investors.
However, practicing traders know that the “ghost of seasonality” wanders here too, although its nature is institutional and speculative rather than physical.
The key currency seasonal effects are as follows.
The Japanese fiscal year. Perhaps the most reliable currency seasonal factor. The fiscal year in Japan ends on March 31. Before this date, Japanese multinational corporations, insurers, and exporters actively repatriate profits, converting dollars and euros into yen to close their balance sheets. This often leads to yen strengthening in February-March against the dollar (USD/JPY declines), regardless of other fundamentals.
The September dollar effect. Historically, September is the worst month for the U.S. stock market and the best for the dollar index (DXY). The reason lies in the end of the summer vacation period, the resumption of treasury activity, large government bond placements, and a general tendency toward risk avoidance after summer. Investors flee to “quality” by buying the dollar.
Commodity currencies (AUD, CAD, RUB, NOK). Seasonality here is derived from commodities. The Canadian dollar tends to strengthen in spring and summer together with rising oil prices ahead of the driving season. The Australian dollar depends on the cycle of iron ore and coal purchases by Asian steelmakers. The Russian ruble has a weak but noticeable tax period: at the end of each month exporters sell foreign-currency revenue to pay taxes, creating regular points of demand for the ruble. This effect becomes especially strong during periods of large fiscal payments (MET, VAT) at the end of March, July, October, and December.
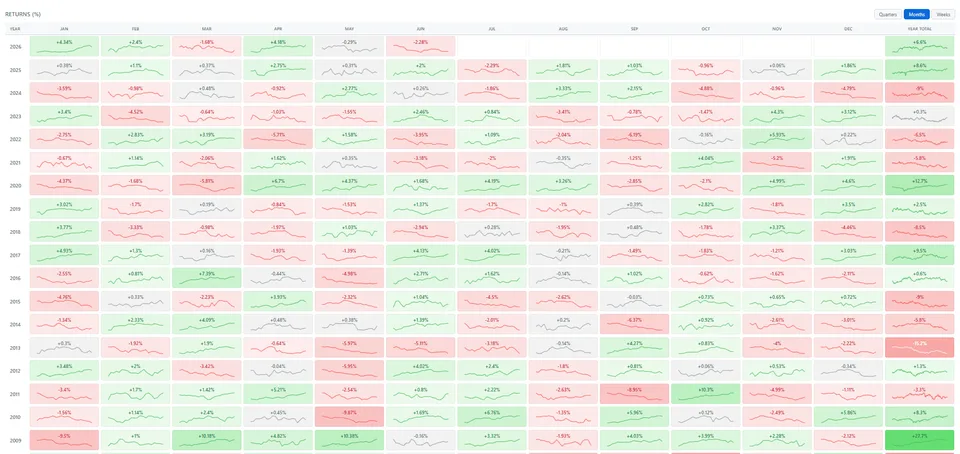
You can study seasonality in currency markets on TLAP's seasonal movements page.
Conclusion
Seasonality in markets is not the same phenomenon for all assets, but a refraction of natural phenomena (astronomy, climate, and biology), social dynamics (strikes and wars), and corporate accounting, as well as ordinary trader expectations. A disruption of a typical seasonal pattern (for example, oil falling at the height of the driving season) often signals the presence of a powerful structural force breaking the familiar order, whether it is a recession, a technological shift, or a geopolitical shock.
The more modern the market, the less seasonality resembles a rigid repetition of the previous year and the more it resembles a probabilistic scenario that changes along with infrastructure, politics, and global trade.
Seasonality cannot be ignored, but blindly following it is suicide for capital. The trader's biggest mistake is trading history rather than the current context: the shale revolution changed the oil rhythm, global warming is shifting harvest windows, and China's growing influence has redrawn the schedule of demand for copper. On the other hand, seasonality serves as an excellent filter for trades: entering a long position in an asset during its seasonally weak period is worthwhile only when exceptionally strong drivers are present.
Seasonality is more of a coordinate system showing where the market “should be” according to the nature of things, and the ability to read deviations from this norm makes analysis truly multidimensional. Therefore, competent seasonal analysis should always answer not only the question “when is it usually stronger?”, but also the question “why should the seasonal pattern persist right now at all?”.