
Forex Stop-Loss Clusters — Live Liquidity Zones Map
Forex Stop-Loss Indicator: How to Read the Data and Use the Tool
What the Indicator Shows
The TLAP Forex Stop-Loss Indicator identifies clusters of retail stop-loss orders using OANDA order and open position data.
Large stop-loss clusters frequently act as liquidity pools where trading activity increases as protective stop-loss orders are triggered. When price reaches these areas, the market may accelerate, perform a liquidity sweep, or reverse after absorbing available liquidity.
Rather than predicting future price direction, the indicator helps traders identify where significant liquidity is concentrated and where significant price reactions are more likely.
Indicator Layout
The interface consists of two main sections: the Price Chart with Stop-Loss Clusters on the left and the order statistics panel on the right.
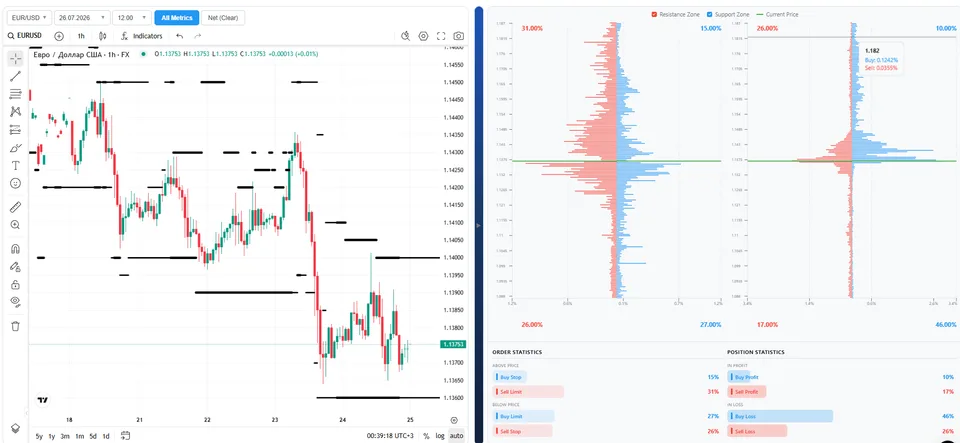
Left Panel: Price Chart with Stop-Loss Levels
The chart displays black horizontal levels representing the largest clusters of stop-loss orders identified from OANDA client data.
These levels highlight potential liquidity zones where traders may observe:
increased volatility;
stop run;
false breakout;
sharp momentum moves following stop-loss execution.
Right Panel: Order and Position Distribution
The upper section contains two distribution charts.
Pending Order Distribution shows the location of pending orders relative to the current market price, including:
Buy Stops
Sell Stops
Buy Limits
Sell Limits
Open Position Distribution displays the current positioning of OANDA clients:
Buy Profit
Sell Profit
Buy Loss
Sell Loss
Red bars indicate areas where sell-side activity dominates, while blue bars represent stronger buy-side positioning. The green horizontal line marks the current market price.
The lower section summarizes the percentage distribution of orders and open positions, allowing traders to quickly evaluate market positioning, identify buyer-seller imbalances, and locate areas where liquidity is concentrated.
How to Use the Indicator
The indicator is most effective when used alongside technical analysis rather than as a standalone trading signal.
A typical workflow includes:
Identify major stop-loss clusters. These areas frequently act as liquidity targets where volatility may increase.
Compare stop-loss clusters with key support and resistance levels. When both align, the probability of a failed breakout or a liquidity sweep often increases.
Determine the prevailing market trend. During strong trends, stop-loss orders positioned against the trend are more likely to be triggered before the primary trend resumes.
Plan entries, exits, and stop placement. The indicator can help identify more robust stop-loss locations beyond major liquidity clusters or provide confirmation after a liquidity sweep.
For best results, combine the indicator with market structure analysis, volume analysis, and conventional technical indicators.
Practical Trading Applications
The Stop-Loss Indicator can help traders:
Avoid liquidity traps. Entering a position immediately before a large stop-loss cluster may expose the trade to unnecessary volatility.
Confirm breakouts. When a breakout coincides with a stop run and strong momentum, the move is more likely to continue.
Optimize stop-loss placement. Positioning protective stops beyond major liquidity zones can reduce the probability of being stopped out by routine market noise.
Evaluate market positioning. Combined order and position data provide valuable insight into where retail traders are positioned and where liquidity is concentrated.
Key Benefits
The TLAP Forex Stop-Loss Indicator helps you:
identify real stop-loss clusters based on OANDA client positioning data;
locate potential liquidity zones before significant market activity develops;
recognize stop hunts, liquidity sweeps, and failed breakout scenarios;
improve stop-loss placement using objective market data;
analyze all major Forex currency pairs across multiple timeframes.
Using the Indicator in a Trading Strategy
The Stop-Loss Indicator is designed to enhance an existing trading strategy—not replace it.
It provides additional context by revealing where liquidity is concentrated and how retail traders are positioned before the market reaches those areas.
The indicator is particularly effective when combined with:
support and resistance levels;
market structure and trend analysis;
volume and order flow analysis;
classical technical indicators.
Combining these tools provides a more complete understanding of market behavior, helping traders understand both market direction and the liquidity landscape behind price movement.