
Crypto Long/Short Ratio
The Long/Short Ratio shows the balance between long and short positioning in the cryptocurrency futures market. The TLAP indicator is based on Binance Futures perpetual futures data.
It helps traders understand whether market participants are positioned more heavily for a price increase or a decline.
As a general guide:
Above 1.0 — long positions outweigh short positions.
Below 1.0 — short positions outweigh long positions.
The Long/Short Ratio describes market positioning, not future price direction. A high ratio can reflect strong bullish sentiment, but it can also indicate crowded longs and increased vulnerability to a pullback or long squeeze. Likewise, a high concentration of shorts does not guarantee that price will rise.
Long/Short Ratio Components
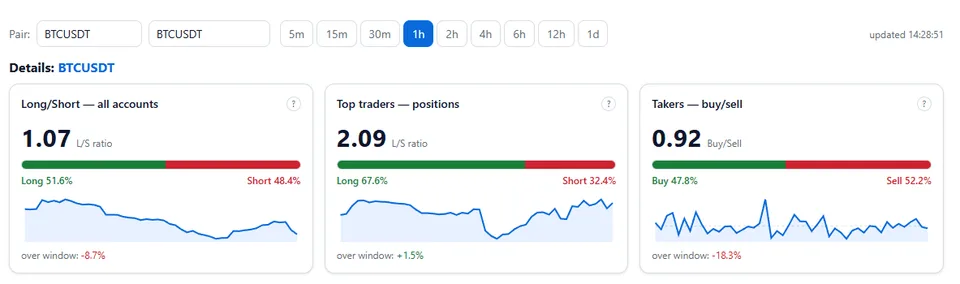
Select the cryptocurrency and timeframe at the top of the interface.
The indicator then provides three complementary positioning metrics.
All Accounts Long/Short Ratio
Shows the Long/Short Ratio across all accounts included in the underlying Binance Futures statistics.
It provides a broad view of overall market positioning and the current long/short bias.
Top Trader Position Ratio
Shows the positioning of top traders, allowing you to compare the exposure of larger market participants with the broader market.
This can help identify situations where top traders are positioned differently from the overall market.
Taker Buy/Sell Ratio
Shows the balance between aggressive market buying and selling.
Unlike the Long/Short Ratio, this metric reflects taker flow rather than the number of open long and short positions. It can therefore provide additional information about current buying and selling pressure.
For each metric, the interface provides:
current ratio;
Long/Short percentage;
historical percentage change.
Price Chart and L/S Zones
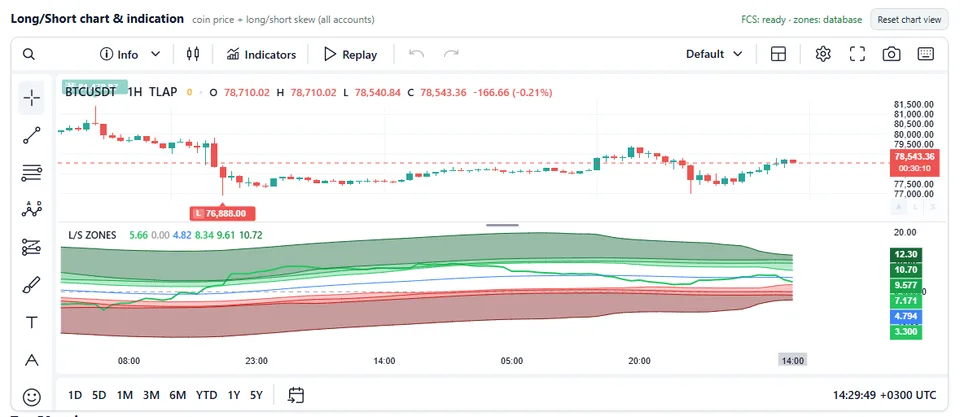
The chart combines cryptocurrency price action with changes in Long/Short positioning.
This makes it possible to compare price movements with shifts in trader positioning and identify periods when positioning becomes increasingly one-sided.
An L/S scale on the right side of the indicator shows the corresponding ratio ranges and their color coding.
Top 50 Major Cryptocurrencies
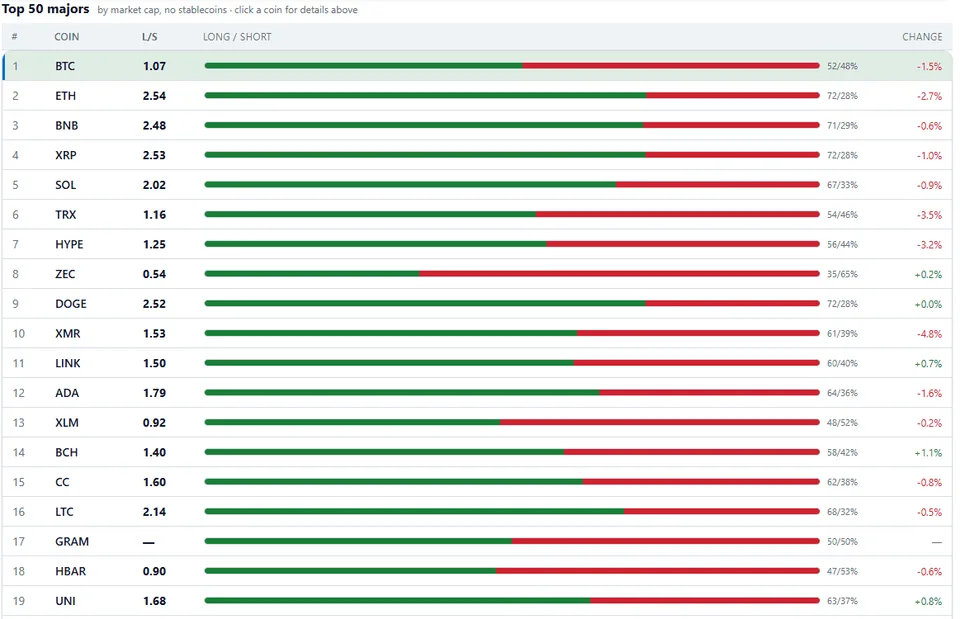
The table below the indicator ranks the Top 50 cryptocurrencies by:
The Top 50 cryptocurrencies table excludes currency stablecoins but includes tokenized gold XAUT and PAXG: their price is not fixed to a currency amount. Missing futures data is shown as unavailable, not as a zero ratio.
current Long/Short Ratio;
long/short positioning percentage;
change over the selected timeframe.
All values in the table depend on the selected timeframe, allowing you to compare positioning across different market horizons.
How to Use the Long/Short Ratio in Trading
The primary purpose of the indicator is to analyze futures positioning, not to predict price direction.
Typical interpretations include:
Rising Price + Rising Long/Short Ratio
Price is moving higher while long positioning increases.
This may indicate a strengthening bullish bias, especially when supported by rising Open Interest and healthy market structure.
However, if the ratio becomes extreme, the market may develop crowded long positioning, increasing the risk of a sharp pullback or long squeeze.
Extreme Long/Short Ratio
An unusually high or low ratio can indicate crowded positioning.
Extreme readings should be compared with the asset's own historical range rather than interpreted using a fixed threshold. A ratio that is extreme for one cryptocurrency may be normal for another.
Falling Price + Falling Long/Short Ratio
Price is declining while the Long/Short Ratio falls.
This may indicate weakening long positioning and a shift toward a more bearish market bias.
However, changes in the ratio can result from both new positions and position closures, so additional confirmation is required.
Compare All Three Metrics
The most useful approach is to analyze All Accounts, Top Trader positioning, and Taker Buy/Sell flow together.
For example, if retail or overall positioning becomes heavily long while top traders and taker flow fail to confirm the move, the market may have a conflicting structure.
Conversely, when positioning across major participant groups and aggressive order flow points in the same direction, the setup may have stronger confirmation.
The objective is not to find a single "correct" ratio, but to identify positioning imbalances and changes in market structure.
Combining Long/Short Ratio with Other Indicators
The Long/Short Ratio is most useful when combined with other derivatives and market data.
Open Interest
Open Interest (OI) helps determine whether futures exposure is expanding or contracting.
Combining OI with the Long/Short Ratio can help distinguish between increasing positioning and position unwinding.
Funding Rate
Funding Rate shows the cost of holding perpetual futures exposure and which side of the market is paying funding.
A high positive funding rate combined with an extreme long/short ratio may indicate crowded longs and elevated leverage.
Volume and CVD
Trading Volume and Cumulative Volume Delta (CVD) provide additional information about aggressive buying and selling.
These metrics can help determine whether price movement is supported by actual taker flow.
Liquidations
Liquidation data can reveal where leveraged positions are being forcibly closed and help identify conditions that may lead to a liquidation cascade.
Technical Levels
Support, resistance, market structure, and liquidity levels provide the price context needed to interpret positioning data.
Practical Trading Scenarios
Crowded Longs
A cryptocurrency is trending higher while the Long/Short Ratio and Funding Rate rise to unusually elevated levels.
This can signal crowded long positioning. If price reaches a major resistance level and momentum weakens, the risk of a long squeeze may increase.
The positioning data is therefore better used as a warning or confirmation tool rather than as an automatic short signal.
Crowded Shorts
Price is under pressure while the Long/Short Ratio falls sharply and funding becomes deeply negative.
This can indicate crowded short positioning. If price begins to reverse, short sellers may rush to close positions, potentially creating a short squeeze.
Divergence Between Traders and Takers
Overall Long/Short positioning becomes increasingly bullish, but the Taker Buy/Sell Ratio shows aggressive selling.
This mismatch may indicate that passive positioning and current execution flow are moving in different directions. Traders can use this as a reason to wait for additional confirmation from price action and market structure.
Limitations of the Long/Short Ratio
Keep the following limitations in mind:
The Long/Short Ratio is not a standalone trading signal.
A high percentage of long positions does not guarantee a price decline.
A high percentage of short positions does not guarantee a price increase.
Futures positions may be opened for hedging, arbitrage, or other purposes, not only to speculate on price direction.
The ratio does not by itself explain the leverage, size, or profitability of individual positions.
Positioning can change rapidly during periods of high volatility or major market events.
Important Notice
The TLAP Long/Short Ratio is provided for informational and analytical purposes only and does not constitute investment advice or a standalone trading signal.
Cryptocurrency futures trading involves substantial risk, particularly when leverage is used. Rapid price movements can result in forced liquidation and significant or total loss of trading capital.
Before making trading decisions, conduct your own market analysis and consider leverage, liquidity, position size, and overall portfolio risk.