
Magma Indicator — Forex market pressure online
MAGMA Indicator: How to Read the Data and Use the Tool
What Is the TLAP MAGMA Indicator?
The TLAP MAGMA Indicator is the next generation of the traditional Order Book Indicator, designed to provide a more accurate view of market liquidity.
Powered by OANDA Order Book data, MAGMA analyzes the structure of the order book to identify where resting liquidity is concentrated. It highlights not only clusters of limit orders but also potential breakout zones, giving traders a clearer picture of where price is likely to react or accelerate.
Unlike conventional order book indicators that simply display the largest liquidity clusters, MAGMA evaluates both the size and the proximity of liquidity to the current market price. Orders located closer to the market receive greater weight, while distant orders and market noise are filtered out.
The result is a cleaner, more actionable view of the order book, showing the liquidity levels that are most likely to influence price.
MAGMA Identifies Three Types of Liquidity Levels
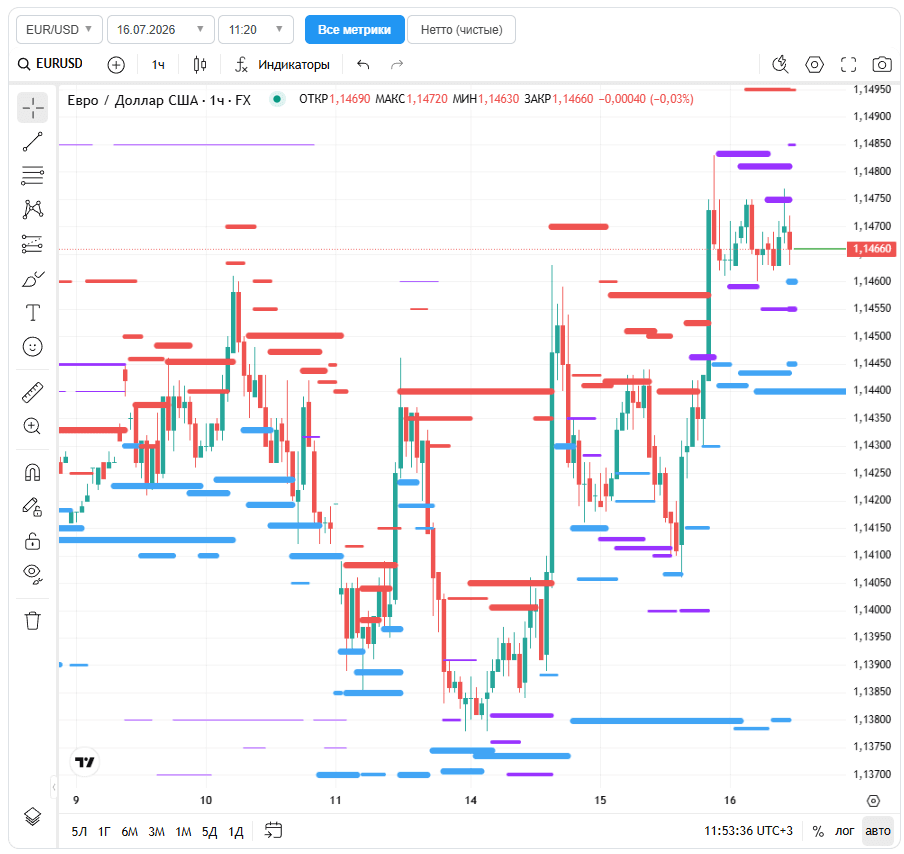
Each level is assigned a strength score ranging from 0 to 100. The higher the score—and the thicker the level displayed on the chart—the more significant the liquidity zone.
Resistance Levels (Red)
Resistance levels appear above the current market price and represent areas where significant sell-side resting liquidity is concentrated.
As price approaches these levels, bullish momentum may weaken, stall, or reverse as sellers absorb buying pressure.
Support Levels (Blue)
Support levels appear below the current market price and represent areas of concentrated buy-side resting liquidity.
These zones often slow or prevent further declines as buyers provide liquidity to the market.
Counter Levels (Purple)
Counter Levels are a distinctive feature of the MAGMA Indicator.
These zones identify buy-side liquidity above the current price and sell-side liquidity below the current price — an unusual order book structure that often reflects changing market sentiment.
When price successfully breaks through a Counter Level and establishes acceptance beyond it, the move frequently signals the end of consolidation and the beginning of a stronger directional impulse.
What the MAGMA Levels Reveal
Liquidity Walls
MAGMA highlights areas where large concentrations of resting limit orders are located.
The stronger and thicker the level, the more likely it is to influence price action. During trending markets, these zones often provide opportunities to enter in the direction of the prevailing trend after a pullback. During range-bound conditions, they may serve as areas to take profits or identify potential reversal setups.
Counter Levels
Counter Levels can act as early signals of changing market structure.
Their appearance often indicates that liquidity is beginning to shift before price fully reacts, making MAGMA a valuable leading analytical tool rather than simply a reactive support and resistance indicator.
A confirmed breakout through a Counter Level is frequently accompanied by expanding momentum and may signal the transition from consolidation to a trending market.
How to Use the MAGMA Indicator
MAGMA is designed to be straightforward while providing a comprehensive view of order book liquidity.
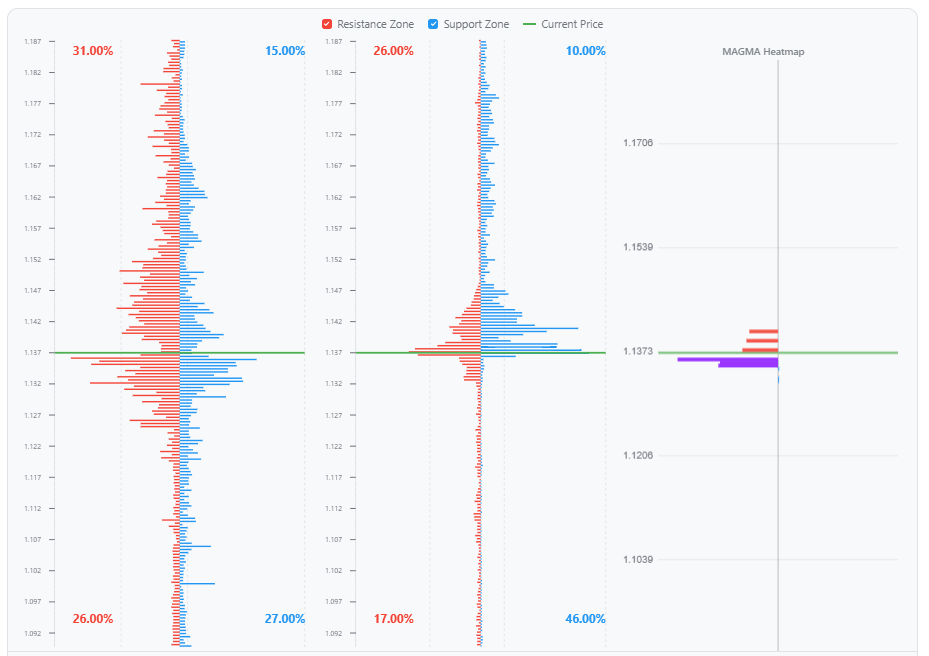
The price chart on the left displays all identified liquidity levels, while the histogram on the right represents a condensed heatmap of the order book, making it easy to evaluate the distribution and relative strength of nearby liquidity.
A typical analysis follows these steps:
Identify the current market environment. Determine whether the market is trending or consolidating.
Locate the strongest support and resistance levels. Focus on levels that are both close to the current market price and have the highest strength scores.
Monitor nearby Counter Levels. These areas may indicate increasing breakout potential or the early stages of a directional move.
Key Advantages of the MAGMA Indicator
More comprehensive market data. MAGMA analyzes the full order book, using real resting buy and sell limit orders across multiple price levels rather than relying solely on stop-order clusters.
Continuous liquidity heatmap. Instead of displaying only isolated liquidity zones, MAGMA visualizes the distribution of market pressure across the order book, making it easier to understand where price is likely to be attracted or rejected.
Reduced market noise. Distance weighting and statistical filtering prioritize structurally significant liquidity while suppressing less relevant order book fluctuations.
Complete market context. Support, resistance, and Counter Levels are displayed simultaneously, providing a unified view of market liquidity in a single indicator.
Limitations and Risk Management
Like any analytical tool, the MAGMA Indicator is based on current market conditions and historical order book data. It does not predict future price movements or guarantee trading outcomes.
Market conditions can change rapidly due to news releases, shifts in liquidity, widening spreads, changes in volatility, or technical disruptions.
Use MAGMA as part of a broader trading and risk management process rather than as a standalone trading signal. Always combine order book analysis with sound position sizing and disciplined risk management.