
TLAP Currency Correlation Tool
TLAP Currency Correlation Tool: Analyze Correlations Across Forex, Metals, Indices and CFDs
What Is Currency Correlation?
Currency correlation describes the degree to which two markets move in relation to each other over a given period. By analyzing correlations between currency pairs, precious metals, stock indices, and other CFDs, traders can better manage portfolio exposure, avoid overlapping exposure, and gain additional confidence in their trade setups.
Correlation changes over time. Relationships between markets evolve as interest rate expectations, central bank policy, macroeconomic releases, and overall market sentiment change. For this reason, correlation should be monitored regularly rather than treated as a permanent market characteristic.
How to Use the TLAP Currency Correlation Table
The TLAP Currency Correlation Table measures the relationship between currency pairs, gold, and other CFD markets across multiple timeframes, from 1 hour to 1 year.
The tool presents market correlations in two complementary formats: Correlation Heatmap and Correlation Matrix.
Together, they provide a fast and intuitive way to evaluate market relationships, identify correlated markets, and monitor overall portfolio exposure.
Correlation Heatmap
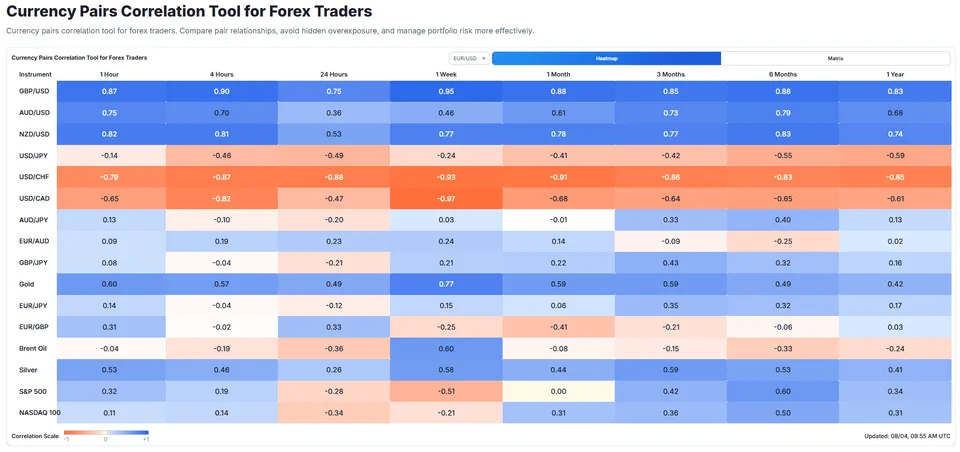
The Correlation Heatmap shows how closely the selected market is correlated with every other available market.
The color scale represents both the strength and direction of the correlation:
Dark blue — strong positive correlation.
Light blue — moderate positive correlation.
White / beige — little or no correlation.
Orange to red — strong negative correlation.
The deeper the color, the stronger the correlation between the two markets.
Correlation Matrix
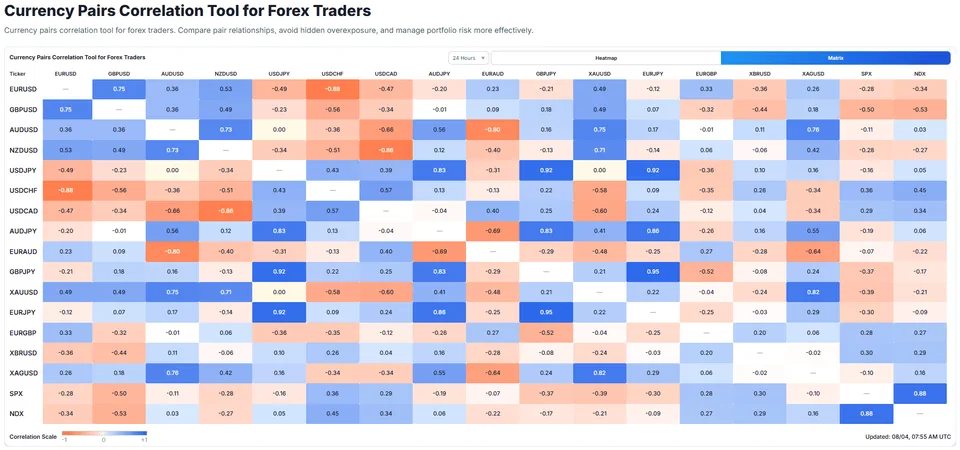
The Correlation Matrix displays correlations across all available markets simultaneously, including Forex pairs, precious metals, stock indices, and other CFDs.
Unlike the Heatmap, which compares one selected market with the rest of the watchlist, the Matrix provides a complete overview of relationships across all available markets.
The same color scale is used:
Dark blue — strong positive correlation.
Light blue — moderate positive correlation.
White / beige — weak or no correlation.
Orange to red — strong negative correlation.
Understanding the Correlation Coefficient
The TLAP Currency Correlation Tool calculates a correlation coefficient ranging from −1 to +1.
Interpret the values as follows:
+1.00 — perfect positive correlation. Both markets move almost identically.
+0.70 to +1.00 — strong positive correlation. Opening positions in both markets may significantly increase exposure to the same market move.
−0.70 to −1.00 — strong negative correlation. The markets tend to move in opposite directions and may offer partial hedging opportunities.
−0.30 to +0.30 — weak or no meaningful correlation. Price movements are largely independent.
±0.30 to ±0.70 — moderate correlation. A relationship exists, but it is generally not strong enough to use as a standalone trading signal.
Always evaluate correlation within the timeframe that matches your trading strategy. Two markets may be highly correlated on the daily chart while showing little relationship during intraday trading.
How to Analyze Correlation
To get the most value from the tool, follow this workflow:
Select the primary market you plan to trade.
Choose a calculation period and timeframe that match your trading style (for example, 30 days on H4 for swing trading or 90 days on D1 for position trading).
Identify markets with strong positive or negative correlations to evaluate overlapping exposure or potential hedging opportunities.
Compare price action across correlated markets, together with market structure and key support and resistance levels, to determine whether multiple markets confirm your trade setup.
Before opening another position, assess whether highly correlated trades would unnecessarily increase your overall portfolio exposure.
Review correlations regularly, especially after major economic releases or central bank meetings, as market relationships evolve over time.
Practical Trading Applications
Portfolio Risk Management
Before opening a new position, check whether it is highly correlated with your existing trades.
For example, holding long positions in both EUR/USD and GBP/USD may substantially increase your exposure to U.S. dollar movements instead of providing genuine diversification.
Trade Confirmation
When multiple positively correlated markets generate similar technical signals—such as breakouts, reversals, or trend continuation patterns—it adds confidence to the trade setup.
Conversely, if only one correlated market confirms the move while others do not, additional confirmation may be warranted.
Leading and Lagging Markets
Markets rarely move at exactly the same pace.
If EUR/USD breaks above a major resistance level while GBP/USD remains below a comparable level, GBP/USD may follow if the positive correlation remains intact.
Recognizing these leading and lagging relationships can help traders prepare for potential opportunities before the move develops.
Breakout Confirmation
A breakout is more likely to be genuine when several positively correlated markets break comparable technical levels at the same time.
If only one market breaks out while correlated markets fail to confirm the move, the breakout may represent a false signal.
Correlation Breakdown
Markets that normally move together occasionally begin to decouple.
A correlation breakdown may indicate changing market conditions, shifts in relative currency strength, or the impact of significant macroeconomic events.
When this occurs, review the economic calendar and broader market environment before making trading decisions.
Hedging Portfolio Exposure
Negatively correlated markets can sometimes be used to reduce overall portfolio exposure.
For example, traders holding a long EUR/USD position may use an inversely correlated market to partially offset adverse price movements.
Because correlations change over time, they should always be verified before being incorporated into a hedging strategy.
Important Notice
The TLAP Currency Correlation Tool is designed to help traders understand market relationships and manage portfolio exposure.
It is not designed to generate trading signals or determine market entry timing.
Historical correlations do not guarantee that the same relationships will persist in the future. Correlation should always be used alongside technical analysis, fundamental analysis, and sound risk management.
This information is provided for informational purposes only and does not constitute financial or investment advice.