
COT Reports: Institutional Positioning in Futures Markets
COT Report (Commitments of Traders): Track Major Market Participant Positioning
What Is the COT Report?
The Commitments of Traders (COT) Report is a weekly publication released by the U.S. Commodity Futures Trading Commission (CFTC). It shows how different categories of market participants — including Commercial Traders, Large Speculators (Non-Commercial Traders), and Non-Reportable Traders — are positioned across major futures markets.
The TLAP COT Indicator transforms official CFTC data into intuitive charts and statistics, making it easy to monitor how major market participant positioning changes over time and whether long or short exposure is increasing across different participant groups.
Rather than relying solely on price action, the COT Report provides valuable insight into how major market participants are positioned, helping traders understand the broader forces behind medium- and long-term market trends.
Indicator Overview
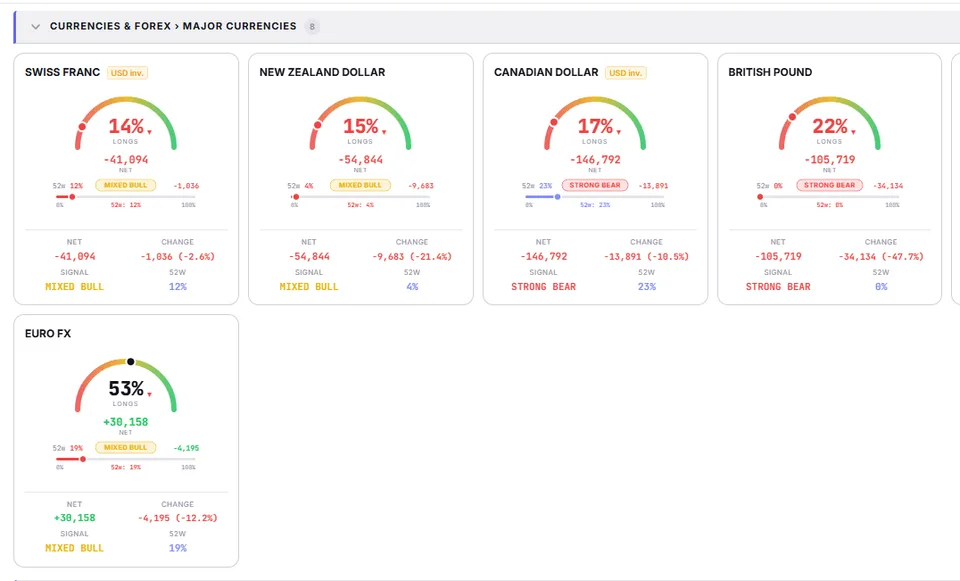
The TLAP COT dashboard allows you to browse reports across multiple asset classes, including:
Forex futures
Precious and industrial metals
Energy markets
Equity index futures
Cryptocurrency futures
A built-in search function makes it easy to find individual instruments.
Each market overview displays several key metrics.
Market Positioning Gauge
The semicircular gauge provides an instant snapshot of the overall market positioning bias, showing the balance between bullish and bearish positioning.
Positioning Scale (0–100%)
The horizontal scale presents the same positioning data in a simplified format, making it easier to compare instruments across different markets.
Net Position
Net Position — the difference between long and short contracts—is one of the most closely watched COT metrics and serves as a primary indicator of overall market sentiment.
Weekly Change
Shows how positioning has changed compared with the previous reporting week, helping traders identify accelerating accumulation or liquidation.
Positioning Signal
TLAP automatically classifies market positioning into six categories:
Strongly Bullish
Bullish
Moderately Bullish
Moderately Bearish
Bearish
Strongly Bearish
52-Week Position Range
Shows where current positioning stands relative to the past 52 weeks. Extreme readings often provide valuable context, particularly when accompanied by significant weekly changes.
Detailed Report
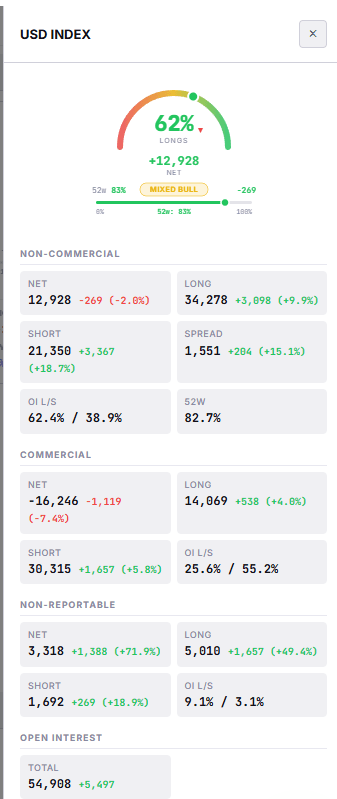
Selecting an instrument opens the complete COT report with additional analytics.
Market Positioning Gauge
A larger version of the positioning gauge summarizes the current market bias.
Participant Breakdown
Positioning is divided into three participant groups:
Large Speculators (Non-Commercial Traders)
Commercial Traders
Non-Reportable Traders
Each group includes several important metrics.
Net Position
The difference between long and short contracts clearly shows whether each participant group is net long or net short.
Divergences between participant groups can provide valuable market insight. For example, Commercial Traders may hold a substantial net long position while Large Speculators remain net short, reflecting different market objectives and expectations.
Long and Short Positions
Separate long and short contract totals allow traders to evaluate not only directional bias but also the absolute size of market exposure.
Spread Positions
Displays spread positions reported to the CFTC, offering additional insight into professional trading activity.
Long/Short Open Interest Ratio
Shows the percentage distribution of long and short open interest, helping identify whether positioning has become heavily concentrated in one direction.
Total Open Interest
Displays the total number of outstanding futures contracts for the selected market.
How to Use the COT Report
The COT Report is most effective for medium- and long-term market analysis.
A typical workflow includes:
Select a futures market such as currencies, crude oil, gold, or equity index futures.
Review the Net Position of Large Speculators. Increasing net long positions often confirm strengthening bullish momentum, while aggressive long liquidation may indicate weakening trend conditions.
Compare positioning with Commercial Traders. Because Commercials primarily hedge underlying business exposure, their positioning often differs from speculative flows and can provide valuable context near major turning points.
Focus on weekly changes rather than absolute values alone. Sharp shifts in positioning frequently provide more meaningful information than static readings.
Use the COT Report as a directional bias filter rather than a standalone trading signal.
Practical Trading Applications
Confirming Trend Strength
Large Speculators continue increasing net long exposure while price trends higher. This alignment supports maintaining a bullish market bias and looking for long opportunities confirmed by technical analysis.
Potential Trend Reversal
Speculative net long positions begin declining sharply while price remains near recent highs. This divergence may indicate weakening momentum and increase the probability of a correction or trend reversal.
Filtering Low-Probability Trades
Suppose your trading strategy generates a long signal, but the COT Report shows Large Speculators already holding historically elevated net long positions. Such crowded positioning may increase reversal risk, suggesting that additional technical confirmation is warranted before entering the trade.
Why Use the TLAP COT Indicator?
The TLAP COT Indicator helps traders:
monitor major market participant positioning using official CFTC data;
identify changes in speculative and commercial market sentiment;
strengthen trend analysis using Net Position data;
reduce the likelihood of trading against dominant market positioning;
place individual trades within a broader market context.
Unlike short-term technical indicators, the COT Report provides valuable insight into how major market participants are positioned over time, offering context that can influence market direction for weeks or even months.
Integrating the COT Report into Your Trading Strategy
The COT Report does not generate entry signals on its own. Instead, it provides market context and directional bias.
A practical approach is to first determine the dominant market positioning bias using COT data, then confirm that view with price action, support and resistance levels, volume analysis, or your preferred trading strategy before executing a trade.
Combining COT positioning with technical analysis helps traders align their trades with major market participant positioning, improving trade selection while reducing the likelihood of trading against prevailing market sentiment.