
COT Reports: A Guide to Analysis and Application in Trading
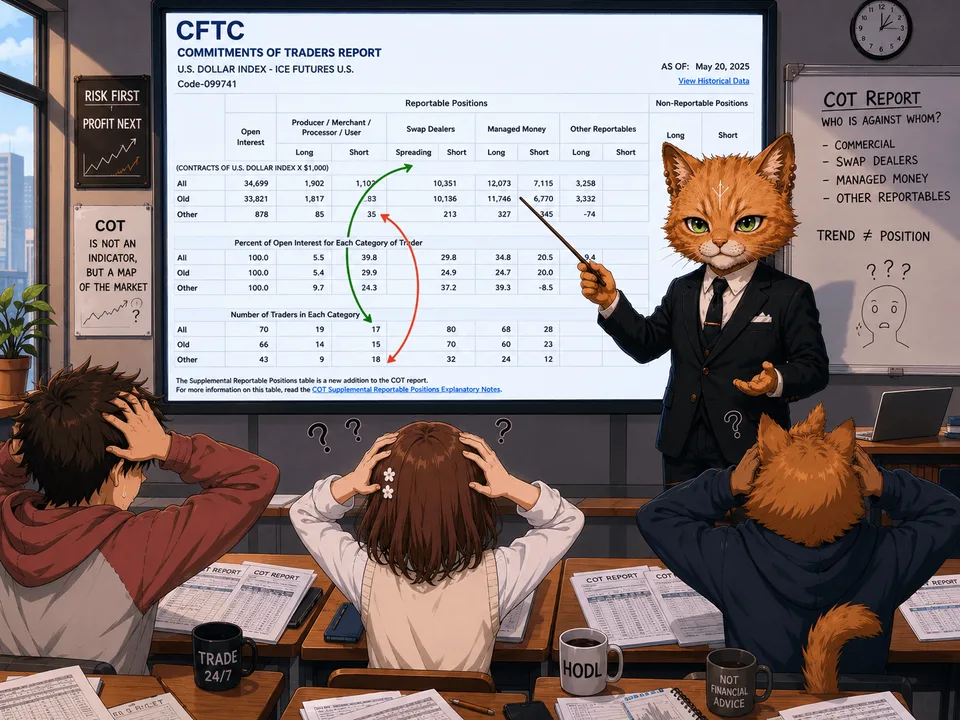
Commitments of Traders (COT) is a weekly report published by the CFTC that provides detailed information on the positions of participants in the U.S. futures market. The COT report shows how open interest is distributed among groups of traders, not just “where the price went.”
For a trader working on medium-term and long-term intervals (from at least several days to several months), COT is one of the few windows into “smart money”: large hedgers and institutional speculators are required to disclose their positions.
In this article, we will examine the history of the reports, where to find them, how to interpret the data correctly, and most importantly, how to integrate this tool into a system for making long-term trading decisions.
What COT Reports Are in Simple Terms
COT (Commitments of Traders) reports are a weekly positioning map of futures and options market participants, published by the CFTC. They show how open interest is distributed among groups of traders, not just “where the price went.”
Today, this is one of the best tools for understanding who is currently pulling the market: hedgers, large speculators, asset managers, or systematic funds.
Officially, the CFTC publishes current and historical data on its website: for futures, history is available from 1986; for futures and options, from 1995; for Supplemental (13 agricultural commodities), from 2007. The publication usually comes out on Friday at 15:30 Eastern Time and reflects positions as of the previous Tuesday.
History of the COT Report
The history of COT begins in the first half of the 20th century, when the American grain market was going through a period of wild speculation.
In the 1920s, sharp fluctuations in wheat and corn prices ruined producers, while public opinion saw the root of the evil in large speculators who were supposedly manipulating prices. After the 1929 crash and the Great Depression, pressure on regulators increased.
In 1936, the Commodity Exchange Act was passed, establishing the Commodity Futures Trading Commission (the predecessor of the modern CFTC). The law required large traders to report positions if they exceeded established limits.
The first public report summarizing these data appeared in 1962 and was released once a month. It contained only a general division into hedgers and speculators across a limited number of agricultural crops.
Then the format changed several times: in 1962 the report began to be released monthly, in 1990 twice a month, in 1992 once every two weeks, and from 2000 onward weekly.
With the development of financial futures (currencies, indices, bonds), the list of instruments expanded substantially. The real revolution came in 2009, when the CFTC introduced the so-called “Disaggregated” report (Disaggregated COT).
How to Read COT
To read COT, you first need to understand the structure. The CFTC has several main formats.
Legacy divides the market into commercial and non-commercial.
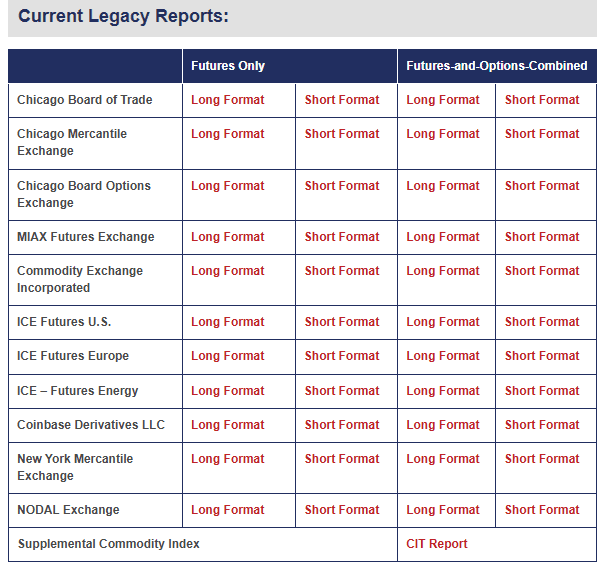
The old “Commercial” and “Non-Commercial” classification was recognized as too crude: under the umbrella of “commercials” fell both traditional hedgers (farmers, oil producers) and swap dealers, whose motives could differ greatly.
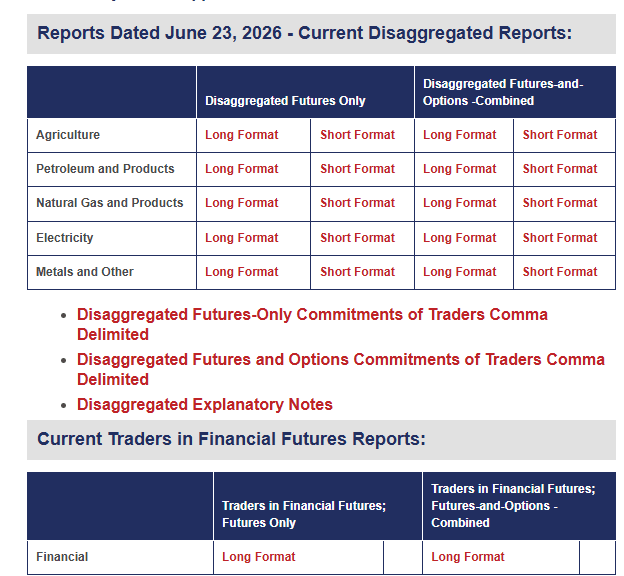
The new Disaggregated COT format divided participants into four main categories:
Producer / Merchant / Processor / User — “pure” hedgers working with a physical commodity.
Swap Dealers — swap dealers who manage the risks of OTC contracts through futures.
Managed Money — hedge funds and CTAs (Commodity Trading Advisors), that is, classic large speculators.
Other Reportables — other reportable traders not included in the previous groups.
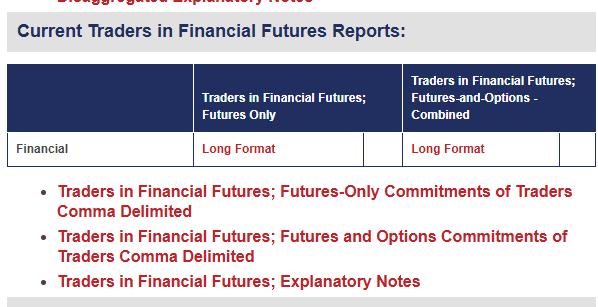
Traders in Financial Futures (TFF) is used for financial contracts and divides participants into Dealer/Intermediary, Asset Manager/Institutional, Leveraged Funds, and Other Reportables.
Later, Supplemental COT was added for selected commodities (grains, oil), which additionally breaks down positions by indices and swaps.
Today, COT is published every Friday at 15:30 U.S. Eastern Time and reflects positions as of Tuesday’s close. This three-day delay is a key nuance that we will discuss later.
Where to View COT
Where to view the report?
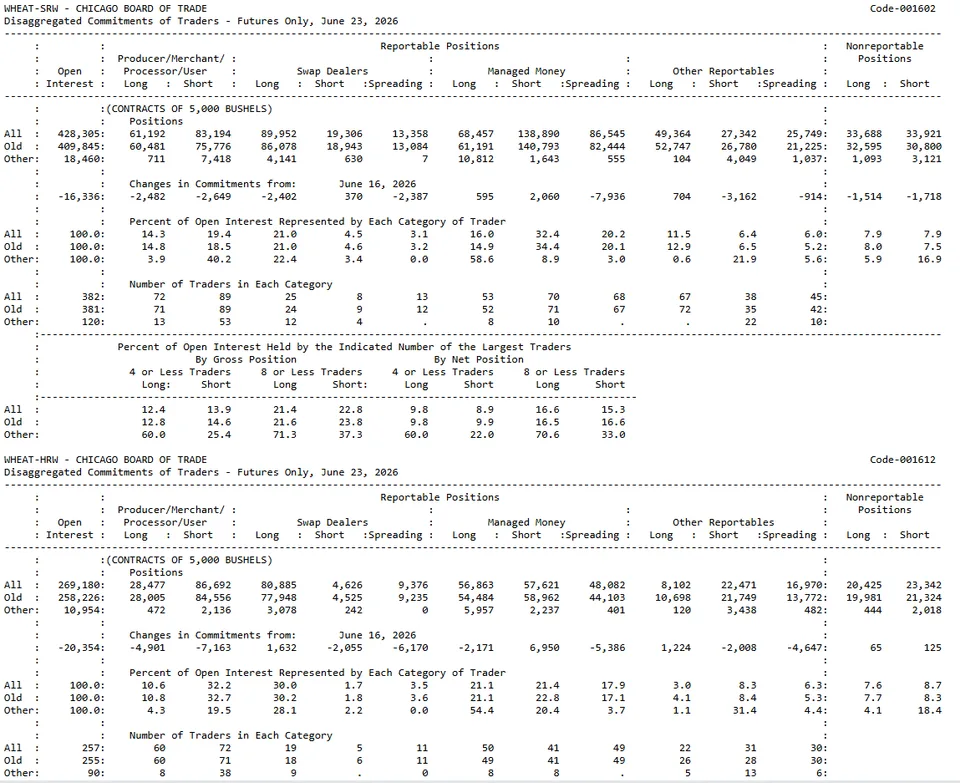
First of all, on the official CFTC website. It has a Commitments of Traders page. It looks like a typical fax message.
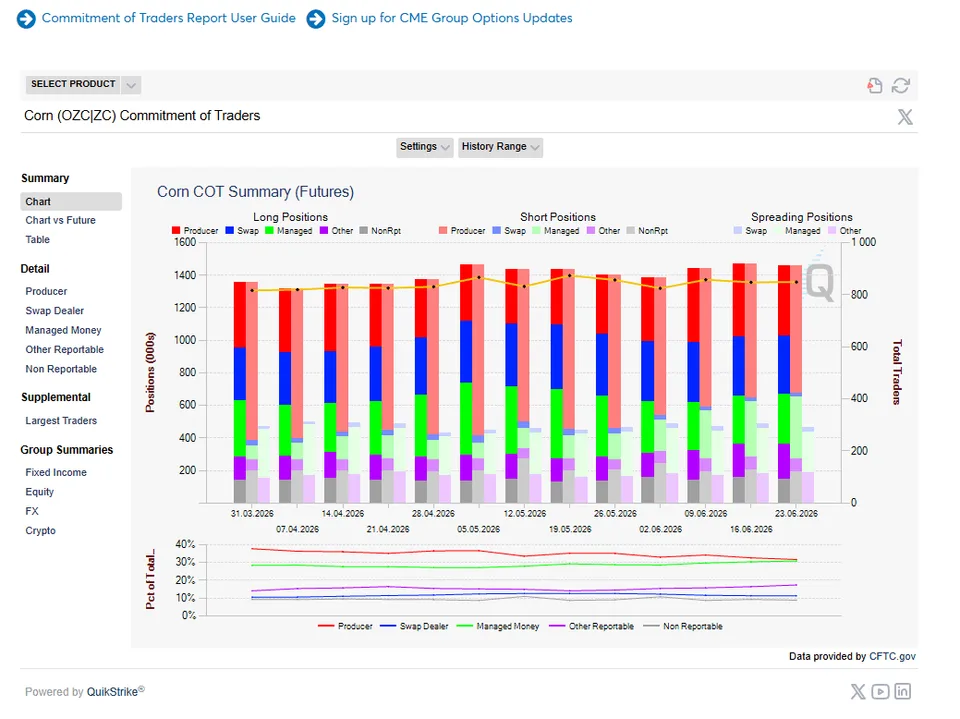
For visual analysis, the CME Group tool is also convenient, as it lets you assess the dynamics of change over time. And that is a significant advantage.
But the simplest and most reliable way to study the COT report is to use the tool on TLAP.
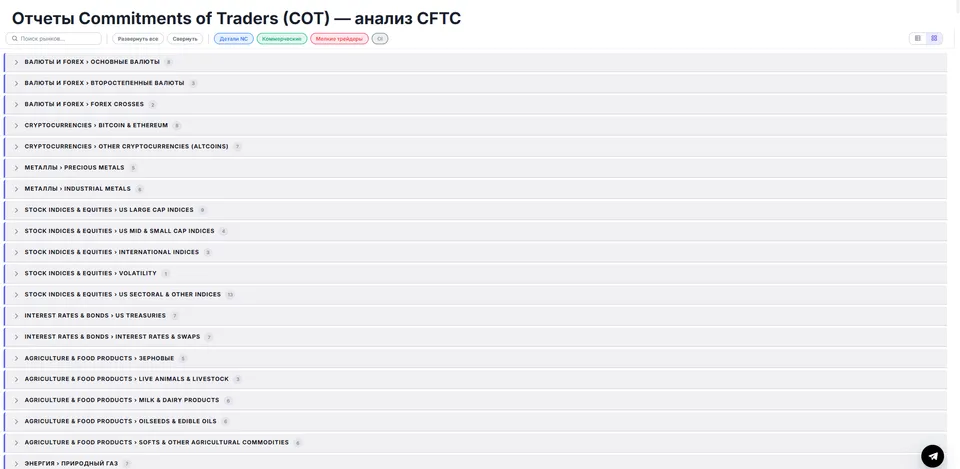
Perhaps this is one of the most convenient tools for quickly analyzing reports. The key advantage of the COT reports indicator from TLAP is the availability of the full list of instruments. This means the tool is useful even for professional traders.
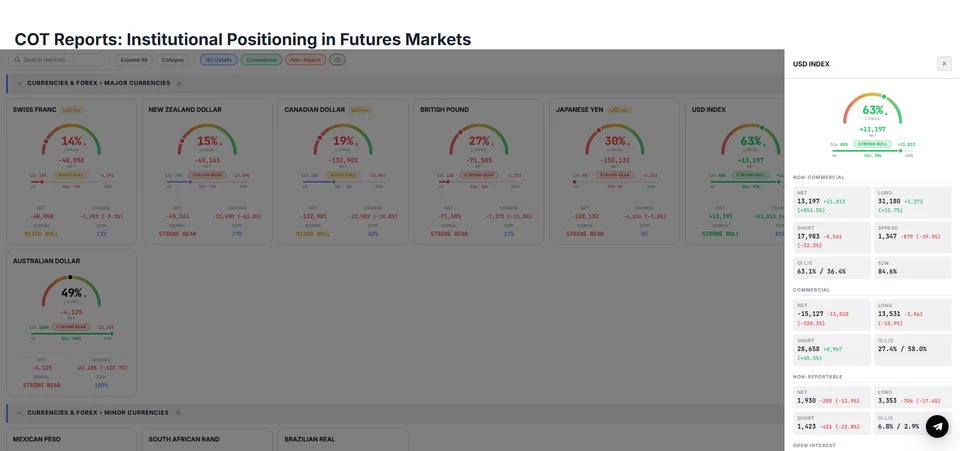
For each instrument, a simple signal indicator is available, and all information from the CFTC bulletin is also presented.
How to Analyze COT Reports
The basis of COT analysis is not the absolute values of positions, but their change and extremity relative to the historical range. Let us consider the main metrics.
1. Net Position
For each group of traders, the difference between long (Long) and short (Short) open contracts is calculated. It is the net position that shows directional sentiment:
A positive Managed Money net position means that hedge funds are generally betting on growth.
A negative Producer/Merchant/Processor/User net position indicates that producers are hedging future deliveries by selling futures.
2. Open Interest
The sum of all open contracts. Growth in open interest together with price confirms the strength of the trend; a decline in open interest while price is rising is a sign of an exhausting move, when new money is not entering.
3. COT Index
This is a normalized oscillator showing how much a group's current net position deviates from its historical minimum and maximum over the selected period (usually 26 or 52 weeks). It is calculated using the formula:

A value above 80–90 signals an excessively bullish sentiment in the group (overbought positioning), below 10–20 signals an excessively bearish one. For “smart money” — producers — the signals are inverted, as discussed below.
4. Seasonality and Spreads
Some commodity markets (grain, energy commodities) are subject to seasonal hedging cycles. In spring, farmers actively sell futures on the new crop, which creates mechanical pressure on producers' net position. This must be taken into account so as not to mistake a seasonal hedge for a reversal signal.
5. Divergences
A divergence between price dynamics and the net position of a key group is the strongest medium-term signal. If price updates highs while hedge funds' net long stagnates or declines, this is a bearish divergence. The mirror case: price falls to new lows while producers reduce their net short — a bullish divergence.
Group Motivation and Whose Signals Matter More

Different categories of traders have fundamentally different motivations, and understanding this motivation is the key to using COT effectively.
Producers/Consumers (PMPU) are the “smart money” in commodity markets. They possess insider knowledge of physical supply and demand. When producers aggressively reduce their short net position (or even move into net long), it indicates that they expect prices to rise above current levels. Their actions are counter-trend in nature: they buy on declines and sell at peaks. The COT index for PMPU is often used as an indicator of oversold/overbought conditions in the physical commodity.
Managed Money (hedge funds) is a trend-following group. As a rule, they build positions as the trend develops and are the driving force behind impulses. Extreme values of their net position often mark the final stages of a move, when the crowd of speculators is already "on the train" and the fuel is running out. However, a trend signal can remain extreme for weeks before a reversal occurs, so additional filtering is needed.
Swap Dealers are an intermediate link. Their position is often the mirror image of Managed Money, because they act as counterparties in swap transactions. In some commodities (gold, oil), analysis of swap dealers is less informative than direct study of producers.
For medium- and long-term trading, the most valuable group is producers in commodity markets and the commercial traders group (Legacy format) in currencies. It is commercial hedgers, as numerous studies have shown, who are statistically more successful at predicting future reversals over a 3-6 month horizon than speculators.
How to Use COT Reports in Trading
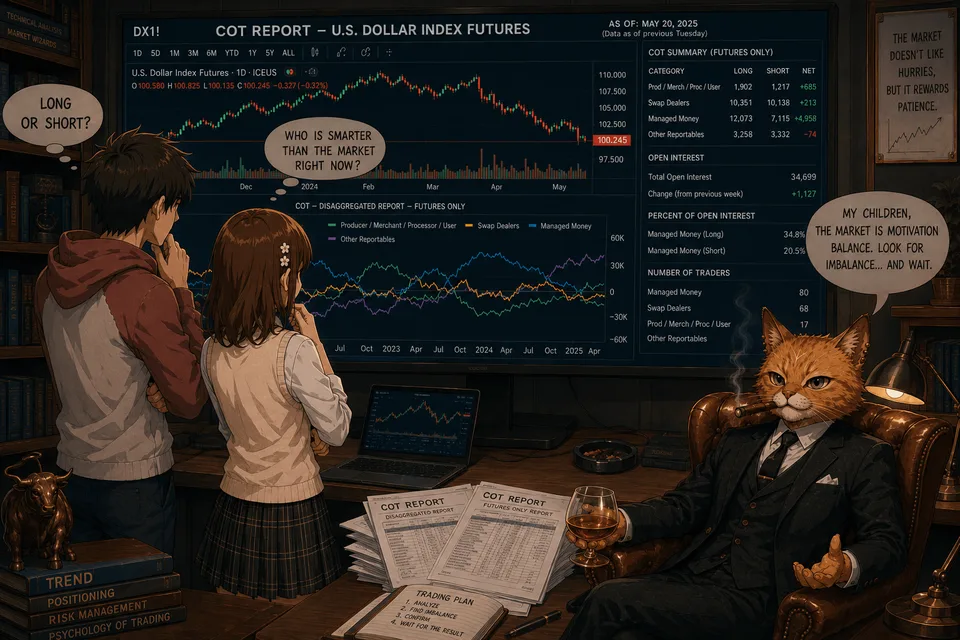
Medium-term trading (swing trading and position trading) is based on holding positions from several days to several months. COT fits this timeframe perfectly, because the data are delayed by three days, and the reversal of positioning sentiment occurs gradually. Let us look at a step-by-step algorithm.
Step 1. Market Selection
Not all markets are suitable for COT analysis.
It gives the best results on highly liquid futures with a clear separation between commercial hedgers and speculators: crude oil (CL), gold (GC), copper (HG), natural gas (NG), grains (ZC, ZS, ZW), cotton (CT).
In the currency market, these are futures on the euro (6E), pound (6B), yen (6J), Canadian dollar (6C). Indices (S&P 500) are more difficult to analyze through COT because of multi-component hedging and options programs.
Step 2. Positioning Assessment
Once a week, after the report is published, a chart of the selected group's net position over the past 52 weeks is built or updated.
The COT index is added. If the COT index of producers in oil falls below 10 (extreme net short), this is an area of interest for purchases, because hedgers consider current prices low and actively sell future production, insuring themselves against a further decline.
But this is only an area of attention, not an immediate signal.
Step 3. Technical Trigger
Entering only on the basis of COT is risky: the position may remain extreme for 4-8 weeks, while price continues moving against you. Therefore COT extremes are used as a direction filter, while technical analysis provides the entry point. For example:
A reversal pattern (double bottom, engulfing pattern, pin bar) forms on the daily chart in a support area.
A breakout of the trend line or moving average (for example, the 50-day) confirms a change in sentiment.
Oscillators (RSI, stochastic) exit the oversold zone.
A position is opened only when the COT signal (an extreme producers index) and the technical trigger coincide.
Step 4. Risk Management and Position Size
The stop loss is placed beyond a technical level (the low of the reversal formation). Since COT analysis is a medium-term strategy, stops can be wide. Therefore the position size is calculated so that the risk per trade does not exceed 1-2% of capital.
Take profit is partly fixed at resistance levels, and partly held until positioning changes, for example until the producers' COT index reaches the overbought zone (above 80).
Step 5. Monitoring and News Filter
The change in net position is checked weekly. If, after a reversal in your direction, Managed Money starts reducing its position (closing longs), this confirms the strength of the move. If hedge funds continue building against you, while producers change their view, the trade should be reconsidered.
It is important to monitor the fundamental backdrop: a sudden change in the macroeconomic picture (for example, an OPEC+ decision) may force producers to urgently revise their hedge.
Common Mistakes in COT Analysis
The most common beginner mistake is to look only at the absolute volume of long or short positions. That is not enough.
It is much more useful to look at three things at once: the group's net position, its weekly change, and its share of open interest. It is open interest that shows how large a part of the market is concentrated with a specific class of participants, not just whether the nominal volume of contracts has grown.
In practice, this means the following. If Managed Money or Leveraged Funds are increasing net long while the price has already moved far from the average zone, the market may be entering an overheated phase.
In turn, if commercial hedgers sharply accumulate a position against the move, this is often a signal not of an "immediate reversal," but of a growing imbalance. This is already a practical interpretation of the report structure, not a literal CFTC formula.
Limitations and Pitfalls
Despite the power of COT, blindly following the report leads to losses. The key limitations are as follows.
Data lag. The report is released on Friday but reflects positions as of Tuesday. In three days, the market can move far. For medium-term trading this is acceptable, but for entering on the publication day the signal is already "old." A weekly scale should be used.
Classification changes. A trader may be reclassified by the CFTC from one group to another, which causes a sharp change in net positions without real trades. This is especially noticeable in metals reports.
Incomplete data for OTC markets. Many hedge funds use OTC swaps that are not fully reflected in COT.
False signals in a flat market. In a quiet market, positions can remain in the neutral zone for a long time without giving clear reference points.
Structural shifts. For example, the growth of passive index investing has distorted the historical positioning norms of some groups.
Integration into a Trading System
Effective medium-term trading with COT is not a separate strategy, but a component of a comprehensive system. The workflow looks like this.
Once a week, we update the COT data base for the tracked markets, calculate net positions and COT indexes.
We form a "radar" — a list of markets where the positioning of a key group has reached an extreme (usually PMPU or Commercials).
We switch to the daily/weekly chart in search of technical confirmation of a reversal.
When a signal is received, we place an order with a clear stop and target calculated based on support/resistance levels.
Trade management — every Friday we reassess COT. If positioning confirms the direction, the position can be held or increased. If a rapid shift in sentiment begins amid an unfavorable technical picture, we exit.
If COT is used in trading, a specific contract is selected first, then the relevant report type: for commodity markets, Disaggregated is more often useful; for currencies, rates, and indexes, TFF; for older comparisons, Legacy.
Then each group's position is reduced to net long/net short and compared not only with the previous week, but also with the 3–5-year range.
The CME tool specifically allows viewing history in different windows, including 3M, 6M, 1Y, 2Y, 3Y, 5Y, and ALL. This exact approach helps you see not "how many contracts," but "how overloaded the market already is with one idea."
For a long, you look not simply for "someone bought a lot," but for a combination of three signs:
large speculators are no longer at zero, but not yet at maximum historical overload;
price confirms strength instead of collapsing downward;
open interest is growing or at least not shrinking sharply.