
Crypto Top Gainers & Losers Screener: Find Strong and Weak Assets
The TLAP Crypto Top Gainers & Losers Screener helps traders quickly identify cryptocurrencies showing the strongest positive or negative price performance across selected timeframes.
Instead of scanning hundreds of charts manually, you can compare Top Gainers and Top Losers in ranked lists and quickly identify market leaders, laggards, emerging momentum, and potential shifts in market leadership.
The screener covers both tokens traded on centralized exchanges (CEX) and DEX trading pairs, allowing you to analyze established cryptocurrencies as well as newer and more speculative assets.
Screener Overview
The interface is divided into two main sections: Top Gainers and Top Losers.
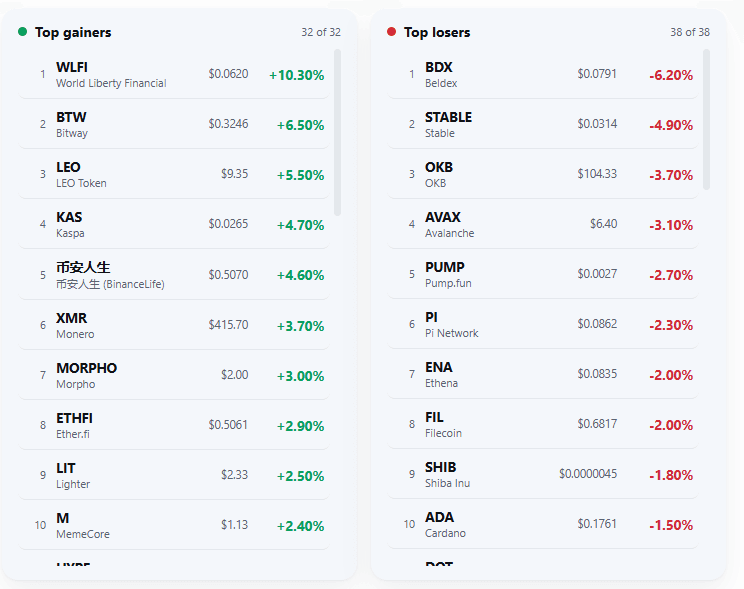
Each table ranks assets by their percentage price change over the selected period.
For every asset, the screener displays: rank; ticker; asset name; current price; percentage change over the selected period.
This side-by-side view makes it easy to compare the strongest and weakest performers across the crypto market.
How to Use the Screener
1. Choose the Market Type
The screener offers two market views.
CEX Coins
The CEX Coins tab is designed for analyzing Top Gainers and Top Losers cryptocurrencies traded on centralized exchanges.
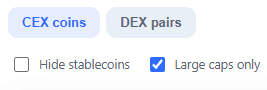
You can include or exclude stablecoins and large-cap assets depending on the type of market scan you want to perform.
DEX Pairs
The DEX Pairs tab focuses on trending DEX trading pairs and liquidity pools.
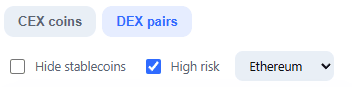
You can select the network, include or exclude stablecoins, and filter high-risk tokens.
DEX markets require additional caution. A token showing a 100% gain is not necessarily a tradable opportunity if pool liquidity is too low to support meaningful position size or efficient execution.
Low liquidity can make large percentage moves difficult to trade because of slippage, limited order depth, and rapid price impact. High-risk DEX tokens may also carry additional risks such as token contract vulnerabilities, honeypots, and rug-pull risk.
2. Select the Timeframe
Choose between: 5m, 1h, 24h, 7d.
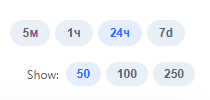
Each timeframe serves a different purpose.
5 Minutes: useful for spotting sharp moves, short-term momentum, and sudden market activity.
1 Hour: helps identify assets showing emerging momentum.
24 Hours: shows the leading gainers and losers across the current trading day.
7 Days: helps identify assets that have established a more persistent medium-term trend.
Comparing several timeframes can reveal changes in momentum.
3. Select the Number of Assets
Choose how many assets appear in the ranking: 50, 100, 250.
A smaller list is useful for monitoring the most liquid and established cryptocurrencies, while broader lists can help uncover momentum and relative strength among mid-cap and small-cap altcoins.
Practical Trading Applications
Finding Strong Momentum
One of the simplest ways to use the screener is to look for assets that remain among the Top Gainers across multiple timeframes.
For example:
the asset is up strongly over 7d;
it remains among the leaders over 24h;
it continues to show positive momentum over 1h.
Consistent strength across several timeframes may indicate that the prevailing trend remains intact.
The next step is to open the asset's chart and look for a trade setup based on your own strategy rather than taking a long position simply because the asset ranks first.
Spotting Early Moves
A potentially interesting setup appears when an asset has not yet become a major 24-hour gainer but is already moving into the top ranks on the 5m and 1h timeframes.
This may indicate early-stage momentum.
Before considering a trade, examine:
trading volume;
breakout levels;
market structure;
volatility;
relevant news or catalysts;
available liquidity.
An early move supported by rising volume and a clean breakout is structurally different from a low-liquidity pump.
Trading Trend Continuation
Strong trends can continue longer than expected.
A Top Gainer is not automatically a short signal, just as a Top Loser is not automatically a long signal.
Instead, use the rankings to identify established trends and then look for:
pullbacks;
consolidations;
breakout retests;
trend continuation setups.
This approach focuses on trading with existing momentum rather than trying to automatically call the top or bottom.
Spotting Potential Reversals
An asset showing an extreme gain over 24 hours may begin losing momentum on shorter timeframes.
For example:
Strong 24h rally → slowing momentum → negative 5m or 1h performance
This may indicate momentum exhaustion, profit-taking, or the beginning of a pullback.
The next step is to examine the chart for signs such as:
failed breakout;
loss of market structure;
rejection from resistance;
weakening volume;
increased selling pressure.
A large percentage gain alone is not evidence that a reversal is about to occur.
Assessing Crypto Market Breadth
The screener can also be used to evaluate market breadth, rather than focusing only on individual coins.
If many large-cap assets are posting positive returns, the market may be experiencing broad-based demand.
If a large number of large-cap assets appear among the Top Losers, broader selling pressure may be developing.
It can be useful to compare:
Bitcoin and Ethereum;
large-cap altcoins;
mid-cap and small-cap tokens;
CEX markets and DEX segments.
A market where only a handful of small tokens are rallying while Bitcoin and major altcoins are weakening is very different from a broad market rally.
Monitoring Capital Rotation
Use sector and asset performance to identify changes in sector leadership and potential capital rotation.
For example, relative strength may shift from Bitcoin and large caps toward Ethereum and higher-beta altcoins, or from speculative tokens back toward Bitcoin and stablecoins.
A broad move across several assets within the same sector provides stronger evidence of changing market leadership than an isolated pump in a single token.
The screener does not measure actual capital flows directly. Instead, it highlights relative price performance and market leadership, which can provide clues about potential rotation between sectors and asset groups.
Combining the Screener with Other Market Data
The Top Gainers & Losers Screener works best as an idea-generation and market-screening tool.
Once an asset stands out, validate the move using additional data such as:
Trading Volume;
Open Interest (OI);
Funding Rate;
Liquidation Data;
support and resistance;
market structure;
correlation with Bitcoin and the broader crypto market.
For example, a strong price rally accompanied by rising OI and elevated positive funding may indicate crowded long positioning and increased risk of a sharp pullback.
A strong move supported by healthy liquidity, sustained volume, and moderate leverage may have a different market structure.
The screener helps you find the asset. Additional metrics help you understand why it is moving and whether the move is tradable.
CEX vs. DEX: Important Differences
CEX data is typically more suitable for established, liquid cryptocurrencies, while DEX data can surface newer or smaller tokens earlier.
The same percentage move can mean very different things across the two market segments.
DEX markets can carry additional risks, including:
low pool liquidity;
high slippage;
volatile pricing;
token contract risks;
concentrated liquidity;
honeypots;
rug-pull risk;
possible market manipulation.
A small-cap DEX token can rank first among Top Gainers simply because its liquidity is limited. Always check pool liquidity, trading volume, and execution conditions before interpreting an extreme price move as a genuine trading opportunity.
A Practical Screening Workflow
A simple workflow is:
Market Type → Timeframe → Top Gainers/Losers → Market Breadth / Sector Strength → Volume & Liquidity → OI/Funding → Chart → Trade Setup → Risk Management
This turns the ranking into a structured market-screening process rather than a list of coins to buy or sell.
Important Notice
The TLAP Crypto Top Gainers & Losers Screener is intended for market screening and informational purposes. A high ranking does not guarantee that an asset's move will continue, and an asset among the Top Losers is not automatically a buying opportunity.
Crypto markets can be highly volatile, particularly in low-liquidity assets where large percentage moves may be accompanied by significant slippage and execution risk.
Always perform your own analysis and consider liquidity, market structure, leverage, position size, and overall portfolio risk before entering a trade.
This information does not constitute financial or investment advice.