
Bitcoin & Ethereum ETF Flows: Monitor Spot ETF Demand
ETF Flows measure the net movement of capital into and out of spot cryptocurrency ETFs. Spot Bitcoin and Ethereum ETFs provide investors with exposure to the underlying assets, making flow data a useful source of information about demand for BTC and ETH.
When investors subscribe to ETF shares, the fund's creation process increases the number of shares outstanding and results in additional exposure to the underlying asset. When shares are redeemed, the ETF's holdings may be reduced through the redemption process. These transactions involve the ETF and its authorized participants, so ETF flows should not be interpreted as a simple one-to-one measure of immediate buying or selling on a crypto exchange.
For traders and investors, ETF Net Flow provides additional context on spot ETF demand alongside price, trading volume, Open Interest, Funding Rate, and other market data.
A positive Net Flow means aggregate ETF inflows exceeded outflows during the reporting session. A negative Net Flow means outflows exceeded inflows.
What the ETF Flows Indicator Shows
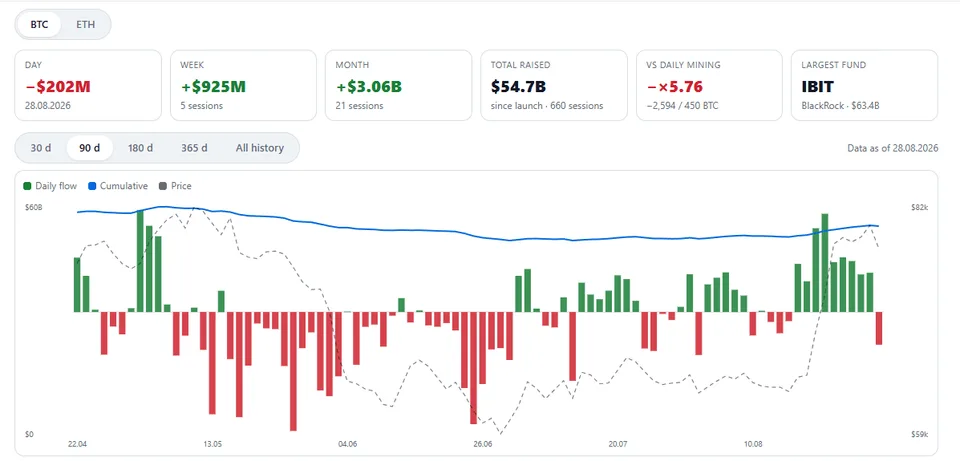
The TLAP ETF Flows page provides data for spot Bitcoin and Ethereum ETFs, including:
daily, weekly, monthly, and all-time flow statistics;
cumulative Net Flow since launch;
current fund size for IBIT (Bitcoin) and ETHA (Ethereum), both managed by BlackRock;
charts comparing ETF Flows with the underlying asset's price over 1 month, 3 months, 6 months, 1 year, and the full available history.
Spot Bitcoin ETFs began trading in the United States on January 11, 2024, while spot Ethereum ETFs began trading on July 23, 2024.
ETF Flows by Issuer
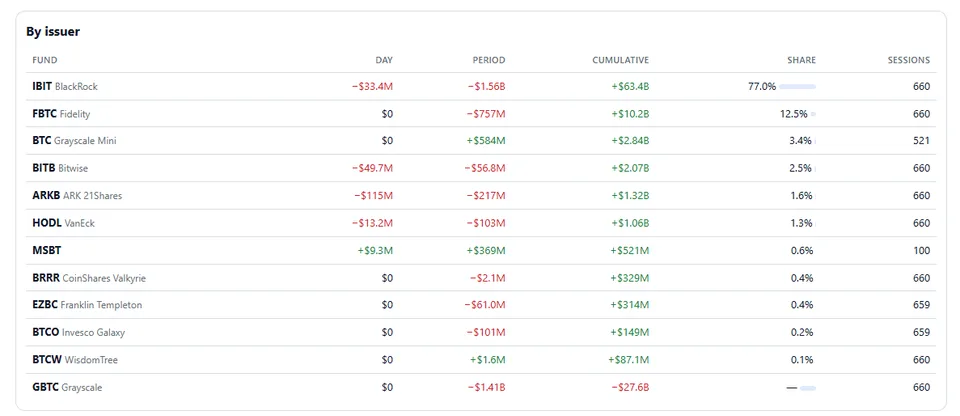
The By Issuer table shows the contribution of individual ETF issuers to aggregate market flows.
It includes:
daily Net Flow;
Net Flow for the selected period;
cumulative Net Flow;
ETF market share;
number of trading sessions.
This view helps identify which issuers contribute the largest net inflows or outflows and whether flows are broad-based or concentrated in a small number of funds.
Period Summary
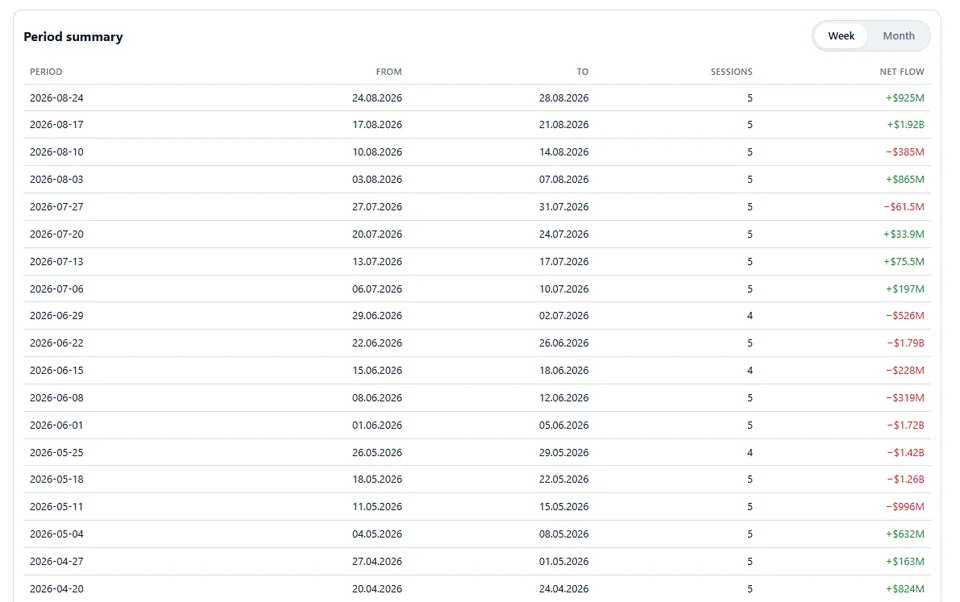
The Period Summary table provides a quick comparison of cumulative ETF flows over different periods, such as a week or month.
The table includes:
Period — the selected reporting period;
From — the start date;
To — the end date;
Sessions — the number of trading sessions in the period;
Net Flow — aggregate ETF Net Flow in USD.
The period is calculated using the date shown in the From column.
From and To are independent date values, while Sessions counts actual trading sessions rather than calendar days.
ETF Flows vs. New BTC Supply
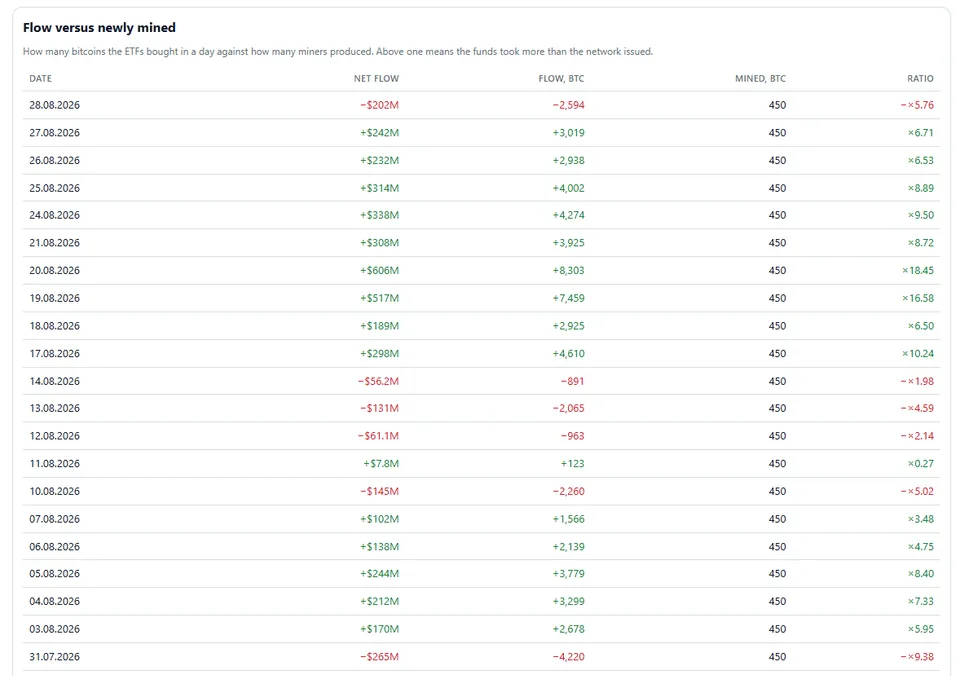
The ETF Flows vs. New BTC Supply table is available for Bitcoin and compares ETF Net Flow with the amount of new BTC issued by the network during the same day.
The table includes:
Date — the trading date;
Net Flow — ETF Net Flow in USD;
BTC Flow — the BTC equivalent of the Net Flow;
New BTC Issued — the amount of new BTC issued by the network;
Flow-to-Issuance Ratio — BTC-equivalent ETF flow divided by new BTC issuance.
A ratio above 1.0 means that ETF net inflows exceeded the BTC equivalent of the network's newly issued supply during the same period.
A ratio below 1.0 means that ETF net inflows were smaller than the BTC equivalent of new issuance.
This comparison helps put spot ETF demand into the context of Bitcoin's rate of new supply. It should not be interpreted as a direct measure of how many newly mined coins ETFs purchased.
How to Use ETF Flows in Trading
Identify the Direction of Spot ETF Demand
A persistent series of positive ETF flows can indicate sustained demand for spot Bitcoin or Ethereum ETF exposure.
Conversely, prolonged net outflows may indicate weaker demand or reduced investor appetite.
Single-session readings are often less informative than multi-session flow trends.
Confirm the Broader Trend
Compare ETF flows with price action.
A rising BTC price accompanied by persistent net inflows provides stronger evidence of sustained spot ETF demand than a rally occurring while ETFs experience prolonged net outflows.
The relationship is not deterministic: price can rise despite net outflows and fall despite net inflows.
Look for Divergences
ETF flows can sometimes diverge from price.
For example, if BTC continues to rally while spot Bitcoin ETFs experience sustained net outflows, the move may warrant closer attention.
Likewise, persistent ETF inflows while price remains weak may indicate that demand is building despite short-term price pressure.
These divergences are not standalone reversal signals and should be evaluated alongside market structure, volume, derivatives data, and macro conditions.
Analyze ETF Demand by Issuer
The By Issuer table helps identify which ETF issuers contribute most to aggregate inflows or outflows.
Broad-based inflows across multiple issuers can indicate stronger participation than an isolated inflow concentrated in a single fund.
Compare ETF Demand with BTC Supply
The ETF Flows vs. New BTC Supply table helps evaluate spot ETF demand relative to new Bitcoin issuance.
A sustained period in which ETF net inflows exceed the BTC equivalent of daily issuance may indicate that spot ETF demand is strong relative to the rate at which new BTC is issued by the network.
This is a comparison of two market quantities, not evidence that ETFs are purchasing every newly mined Bitcoin.
ETF Flows as Part of Broader Market Analysis
ETF Flows are most useful as one component of a broader market framework.
Combine them with:
Price Action — to assess trend and market reaction;
Trading Volume — to evaluate participation and liquidity;
Open Interest (OI) — to monitor changes in futures exposure;
Funding Rate — to assess the cost and crowding of perpetual futures positions;
Liquidation Data — to identify leveraged position closures;
Market Structure — to evaluate trend, support, resistance, and key price levels.
For example, rising price, persistent ETF inflows, and expanding spot-market volume present a different market picture from rising price accompanied by ETF outflows and declining participation.
The goal is not to treat ETF flows as a standalone trading signal, but to use them as an additional source of spot demand and market context.
Data Sources and Limitations
Data Sources
Daily ETF flow data is provided by Farside Investors.
Price data is sourced from the TLAP market data database.
Data Timing
ETF flow data is generally published after the U.S. trading session.
During the first hours after publication, figures may be revised by ETF issuers or data providers.
Important Considerations
ETF flow data does not predict future price movements.
Large net inflows can occur while the crypto market is falling.
BTC-equivalent flow depends on the price used to convert USD flows into BTC.
Market prices are also influenced by macroeconomic conditions, derivatives positioning, liquidity, and other market factors.
ETF flows represent activity within the tracked spot ETF products and should not be interpreted as total institutional demand across the entire crypto market.
Important Notice
The TLAP ETF Flows indicator is provided for informational and analytical purposes only and does not constitute financial, investment, or trading advice.
ETF flows can change from one session to another and do not guarantee future price performance. Market reactions depend on the broader macroeconomic environment, liquidity, positioning, and investor expectations.
Trading and investing in crypto and other financial markets involves the risk of capital loss.