
Limit Order Indicator
Data updates: data is updated every 30 minutes and becomes available after a delay of a few minutes — approximately at 01:05, 01:35, 02:05, 02:35, and so on.
Forex Limit Order Indicator: How to Read the Data and Use the Tool
What Is the Forex Limit Order Indicator?
The TLAP Forex Limit Order Indicator visualizes the distribution of resting Buy Limit and Sell Limit orders using aggregated OANDA client data.
It highlights major concentrations of resting limit orders — commonly referred to by traders as buy walls and sell walls — allowing you to see where passive liquidity is concentrated before orders are executed.
By incorporating limit order distribution into your market analysis, you can identify potential support and resistance levels more objectively and gain additional insight into market liquidity surrounding the current price.
Indicator Overview
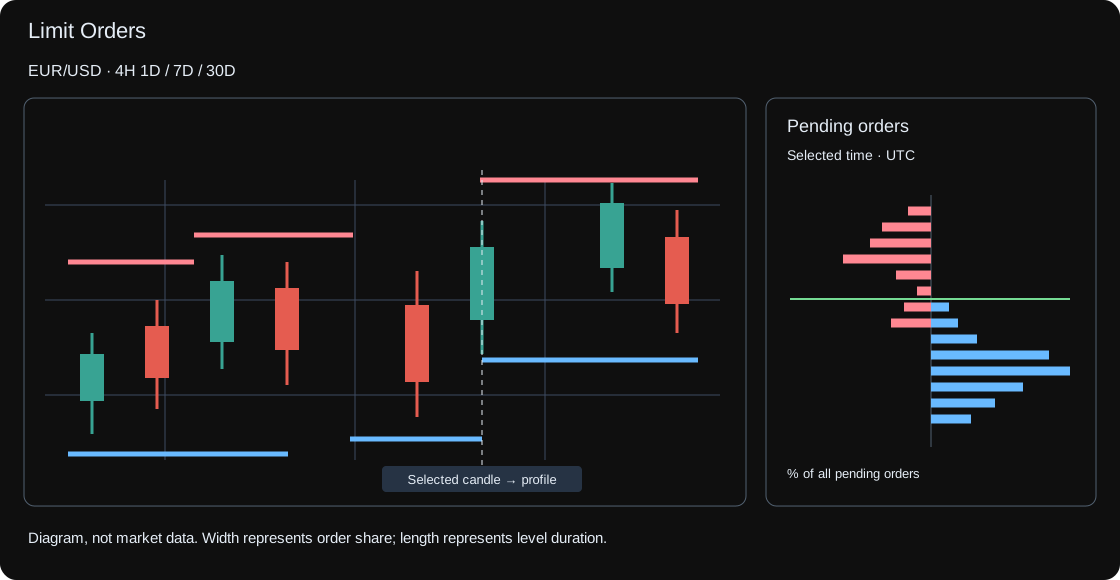
Interface diagram. Data shown is illustrative.
Most of the screen is taken up by a candlestick chart of the selected pair. Horizontal segments are drawn over the candles: red ones mark the largest Sell Limit clusters above the price at that moment, blue ones mark the largest Buy Limit clusters below it. Segment length shows how long a level stayed the strongest; thickness shows how many orders sat there compared with the maximum for the loaded period. Hover over a segment to see the level price, its order share and the time it existed.
To the right of the chart (below it on mobile) is the pending-order profile. Red bars are sells, blue bars are buys; the longer the bar, the more orders rest at that price. The green line marks the price at the time of the snapshot. The horizontal scale shows the share, in percent, of all pending orders for the instrument.
Thirteen instruments are available, including gold, with up to 30 days of history. The «1 day», «7 days» and «30 days» buttons set the history depth and pick a matching timeframe: 15 minutes, 2 hours or 4 hours. You can also change the timeframe by hand — the chart adjusts the range so candles stay readable.
Click any candle to see which orders were resting at that moment: a vertical marker appears on the chart and the profile switches to the selected time, shown in the profile header and below it. The «Current orders» button brings back the live profile.
New data is collected twice an hour, at :05 and :35, and all times are in UTC. On mobile the profile does not capture page scrolling; to move it with gestures, turn on «Gestures control profile».
How to Use the Indicator
The Forex Limit Order Indicator is designed to complement your existing trading strategy by adding objective liquidity analysis.
It is particularly useful for:
Identifying potential reversal zones. Major liquidity clusters often coincide with areas where price may slow down, react, or reverse.
Improving stop-loss placement. Positioning stop-loss orders beyond major liquidity clusters may reduce the likelihood of being stopped out by short-term market noise.
Evaluating risk-to-reward opportunities. Knowing where major liquidity clusters, buy walls, and sell walls are located helps determine whether projected profit targets and stop-loss placements are realistic.
Validating trading strategies. Comparing historical trade entries with liquidity clusters can help identify which setups consistently perform better under different market conditions.
Practical Trading Scenarios
Support Bounce. The market is in a downtrend and approaches a major buy wall. If a bullish reversal pattern—such as a Pin Bar or Bullish Engulfing pattern—forms near the liquidity cluster, the area may provide a higher-probability long setup with a stop-loss placed beyond the support zone.
Resistance Breakout Confirmation. A major sell wall is positioned above the current price. If price breaks above the wall and holds above it, the breakout may signal strengthening bullish momentum as overhead liquidity is absorbed.
Filtering Low-Probability Setups. Suppose you are considering a long position, but there is very little buy-side liquidity below the current price while a major sell wall remains overhead. This imbalance may reduce the probability of a sustained upward move, suggesting that waiting for a stronger setup could be the more prudent decision.
Why Use the TLAP Forex Limit Order Indicator?
The TLAP Forex Limit Order Indicator helps you:
analyze real limit order distribution based on aggregated OANDA client data;
identify liquidity clusters, buy walls, and sell walls that are not visible on a standard price chart;
strengthen support and resistance analysis using objective liquidity data;
improve trade timing by incorporating liquidity into your decision-making process;
support both intraday and swing trading strategies with additional market context.
The indicator works particularly well alongside Price Action, support and resistance analysis, volume analysis, and open position data, providing a more complete view of market liquidity and trader positioning.