
Technical Analysis Patterns: How to Read Charts and Find Trade Entry Points

Technical analysis patterns help traders see the structure of the market, assess the balance between buyers and sellers and identify the conditions under which a new price movement may begin.
Some formations indicate the likelihood of trend continuation, while others warn of a possible reversal. However, spotting a pattern on a chart is not enough: to turn it into a trading signal, you need to wait for confirmation, define entry conditions and calculate the risks in advance.
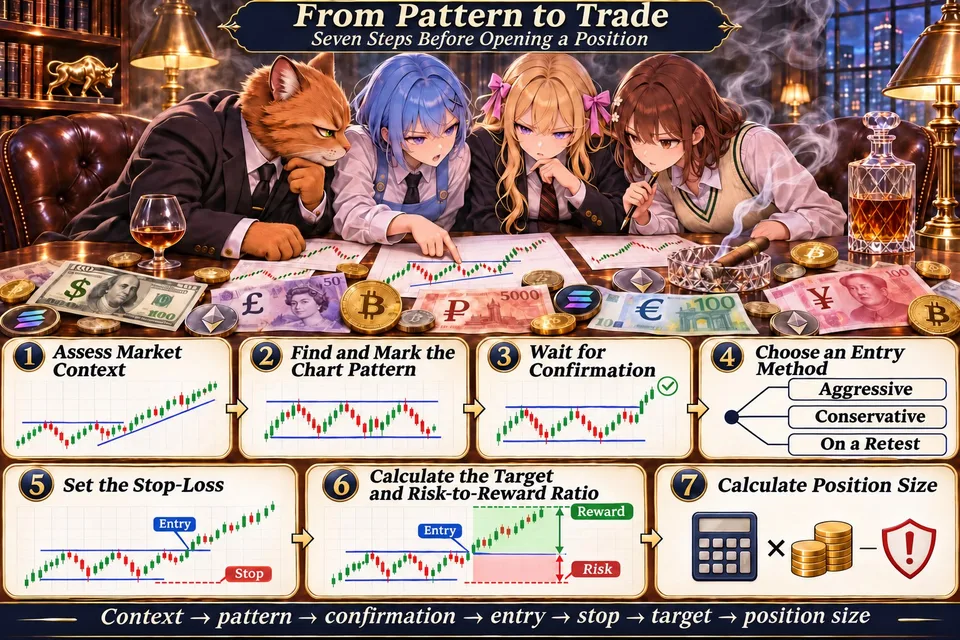
But a chart pattern alone is not a signal to buy or sell. Between recognizing a pattern and opening a position, there should be a systematic process: identifying the market context, drawing the boundaries, waiting for confirmation, choosing an entry method, setting a stop-loss and calculating the position size.
The main advantage of patterns lies not in their ability to predict the future without error, but in the opportunity to formulate a trading scenario in advance and determine the conditions under which it remains valid and those under which it must be abandoned.
What Are Technical Analysis Patterns in Trading
A pattern is a recurring model of price movement that forms on a chart as a result of the interaction between buyers and sellers.
Trading patterns are based on the assumption that market participants behave in certain recurring ways. For example, when the price repeatedly fails to break through the same level, this may indicate the presence of significant supply or demand. If the market moves into gradual consolidation after a strong move, this may indicate a temporary pause before the next impulse.

Similar situations recur across different financial markets and timeframes. Their characteristic shapes have been given names: “Head and Shoulders,” “Double Top,” “Triangle,” “Flag,” “Pennant,” and others.
Patterns are not precise forecasts. The same pattern may result in the expected move, produce a false breakout, or lose its original structure altogether. Therefore, a trader uses it not as a ready-made instruction to buy or sell, but as a tool for developing a trading scenario.
It is important to distinguish between chart patterns and candlestick patterns. Chart patterns are formed by a sequence of price fluctuations and usually span several candles or a substantial section of a chart. Candlestick patterns, such as “Engulfing,” “Hammer,” or “Doji,” describe the structure of individual candles or small combinations of them. They can complement each other, but belong to different methods of market analysis.
Why Traders Use Patterns
The main purpose of patterns is to organize information about price movements and help traders prepare a trading decision.
The balance between supply and demand in the market constantly changes. Price moves in impulses, corrects, encounters resistance, returns to support levels, and forms new ranges. Without a defined analytical framework, these movements may look like random fluctuations.
Patterns help address several practical tasks.
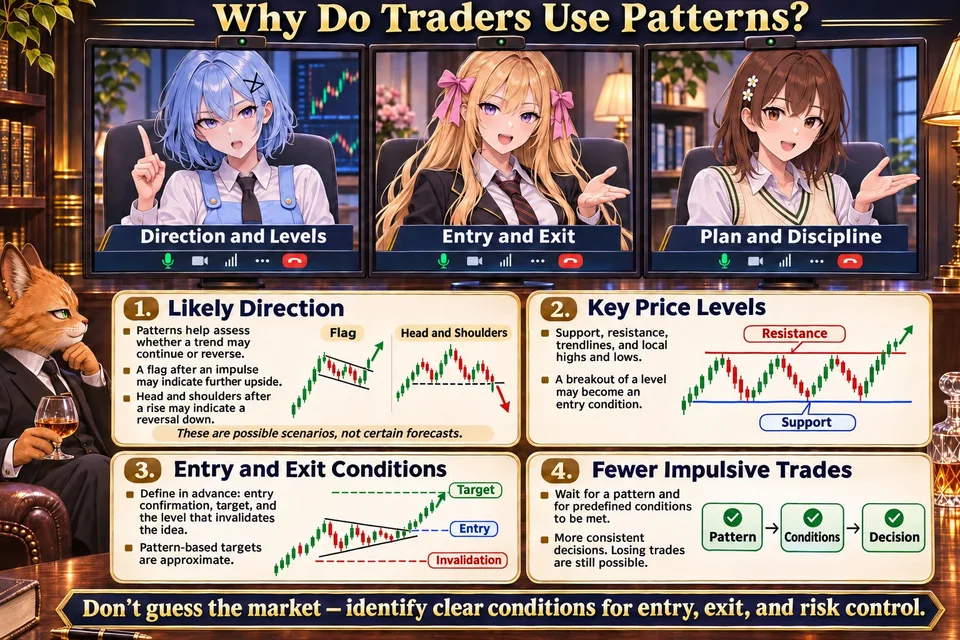
1. Identify the likely direction of movement.
Some formations are more commonly viewed as trend continuation patterns, while others are seen as possible signs that a trend is ending. For example, a flag following a strong upward impulse may indicate continued growth, while a Head and Shoulders pattern after a prolonged rise may suggest a potential downward reversal.
2. Find important price levels.
Most chart patterns have characteristic boundaries: support and resistance lines, trendlines, and local high and low levels. A break through these boundaries may serve as a condition for opening a trade.
3. Define entry and exit conditions.
A pattern allows traders to identify in advance a level beyond which the trading scenario receives confirmation. Its geometry can also be used to estimate a potential price target and the point at which the trading idea becomes invalid.
4. Reduce the number of impulsive trades.
Instead of opening a position with every noticeable price movement, a trader can wait for a specific pattern to form and for predefined conditions to be met. This does not eliminate losing trades, but it makes the decision-making process more consistent.
Thus, patterns in trading are used not to guess the market's next move, but to identify situations with clear conditions for entry, exit, and risk control.
Incidentally, TradingView offers many indicators that automatically plot technical analysis patterns.
TLAP Chart Pattern Library
The TLAP Pattern Lab page offers a library of technical analysis chart patterns, including “Head and Shoulders,” “Double Top and Double Bottom,” “Flag,” “Pennant,” “Triangle,” and “Wedge.” Each formation comes with an educational diagram, a description of the conditions for the pattern's formation and completion, and the option to test its behavior using actual historical price data.
Most importantly, however, the service lets you study pattern outcomes across different markets and timeframes, compare how frequently prices move in the expected direction against a control sample, and assess the statistical robustness of the observations. This helps you both learn to recognize chart patterns and check how often the market scenarios they suggest have played out in the past.
Main Types of Patterns
In classical technical analysis, chart patterns are generally divided into three groups: reversal, trend continuation, and bilateral (neutral).
Reversal patterns
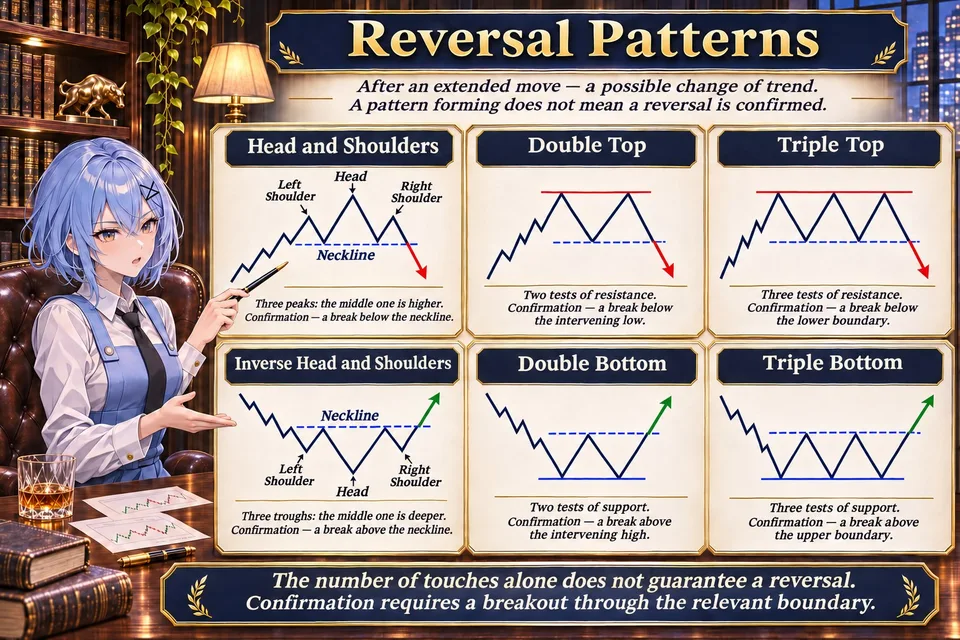
Reversal patterns form after a prolonged price move in one direction and indicate the possibility of a trend change.
However, the appearance of a pattern does not yet mean that a reversal has occurred. Confirming the scenario usually requires a break through an important level—for example, a support or resistance line.
The best-known reversal patterns include the following.
“Head and Shoulders” (Head and Shoulders)
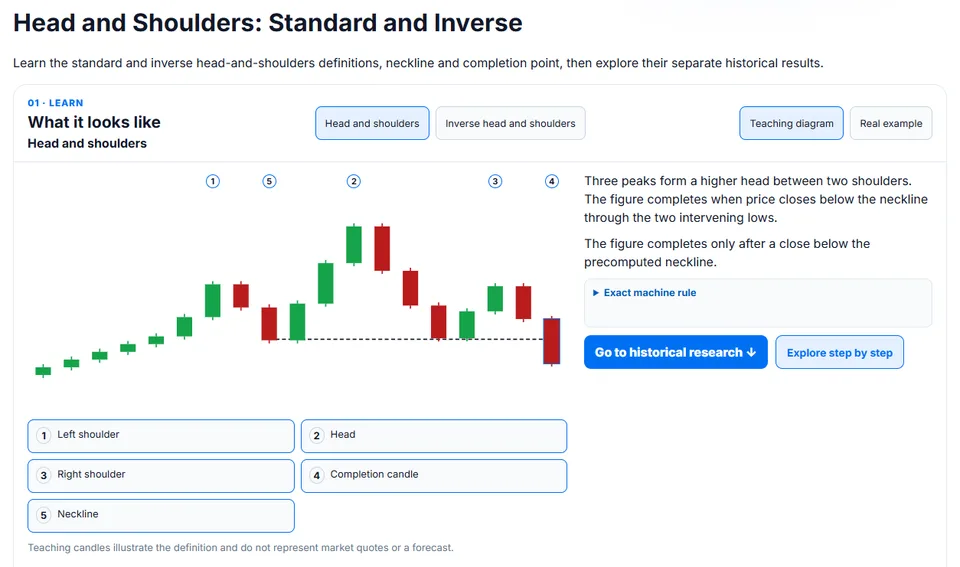
The pattern consists of three consecutive peaks. The central peak—the “head”—is higher than the two outer peaks, called the “shoulders.” The lows between the peaks are connected by the neckline (Neckline).
The pattern usually forms after an upward move. A break below the neckline is viewed as confirmation of a potential reversal to the downside.
The inverse “Head and Shoulders” (Inverse Head and Shoulders) is a mirror-image pattern. It consists of three troughs, with the central trough lower than the outer ones. A break above the neckline may indicate the start of an upward move.
More about the head and shoulders pattern can be found on the TLAP Pattern Lab page.
“Double Top” and “Double Bottom” (Double Top / Double Bottom)
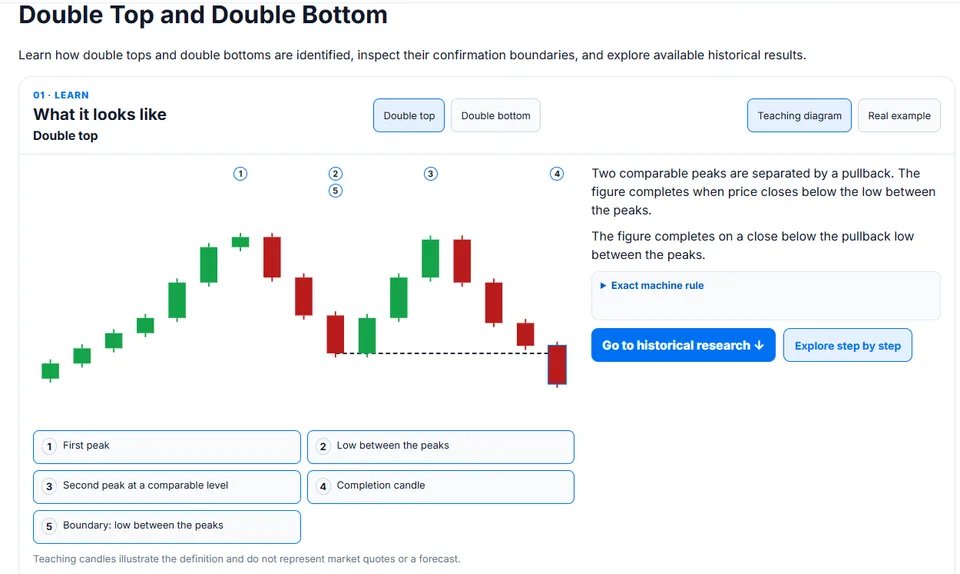
A double top resembles the letter M. The price approaches a resistance area twice but cannot hold above it. A local low forms between the two highs.
A break below this intermediate low confirms the pattern and creates conditions for a downward price move.
A double bottom looks like the letter W. The price tests a support area twice but cannot move lower. A break above the intermediate high confirms the pattern.
These patterns show that attempts to continue the previous move encounter resistance from the opposing group of market participants.
You can learn more about double top and double bottom patterns on the TLAP Pattern Lab page.
“Triple Top” and “Triple Bottom” (Triple Top / Triple Bottom)
These are variations of double tops and bottoms in which the price tests the same resistance or support area three times.
Testing a level three times may indicate that the previous direction of movement is losing strength. However, the number of touches alone does not guarantee a breakout in the opposite direction. Confirmation of the pattern also requires a break beyond the corresponding boundary.
Trend Continuation Patterns
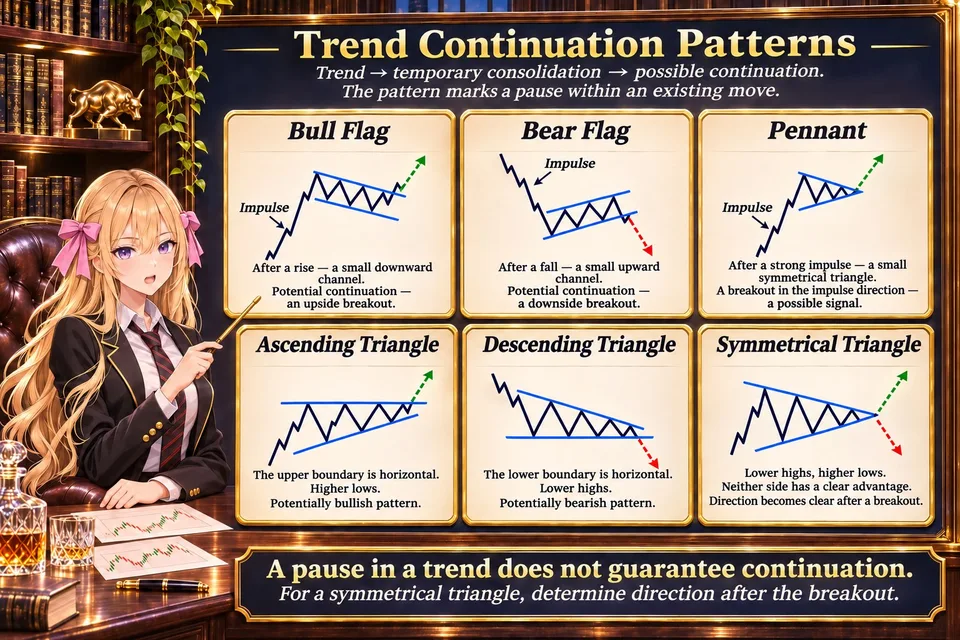
These patterns form during an existing upward or downward move. They reflect temporary consolidation, after which the price may potentially continue moving in its previous direction.
The main idea is that the market pauses, redistributes participants' positions, and then resumes its momentum.
“Flag” (Flag)
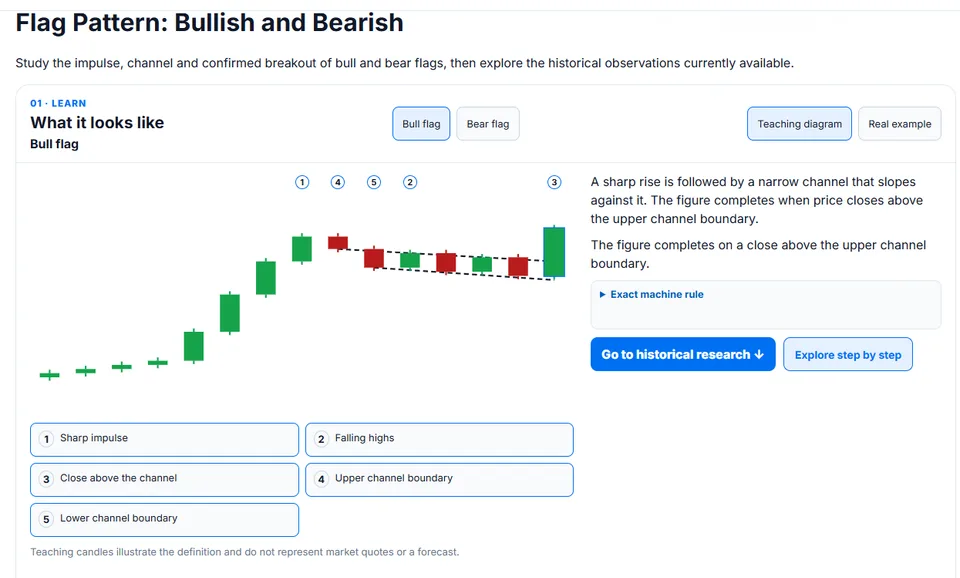
A flag forms after a strong directional move—an impulse. The price then enters a small correction or consolidation, which usually looks like a sloping channel.
A bullish flag appears after a rise and most often slopes downward. A bearish flag forms after a decline and usually slopes upward.
A breakout of the flag boundary in the direction of the initial impulse is considered a potential signal of trend continuation.
You can learn more about the flag pattern on the TLAP Pattern Lab page.
“Pennant” (Pennant)
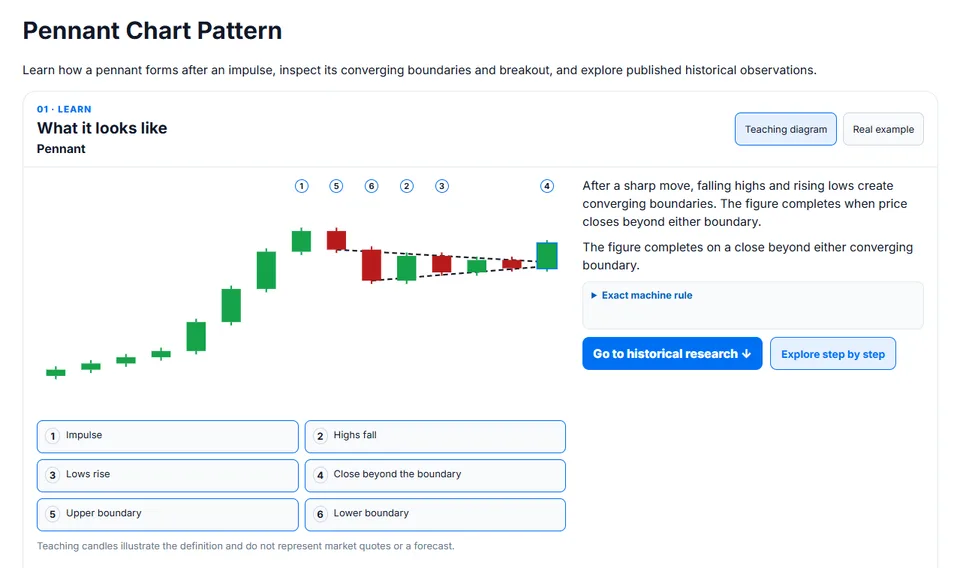
A pennant also forms after a strong price impulse, but differs from a flag in the shape of its consolidation. Instead of a sloping channel, converging support and resistance lines form.
The result is a small symmetrical triangle.
A breakout of its boundary in the direction of the preceding move can provide a signal to enter a trade.
You can learn more about the pennant pattern on the TLAP Pattern Lab page.
“Triangles” (Triangles)
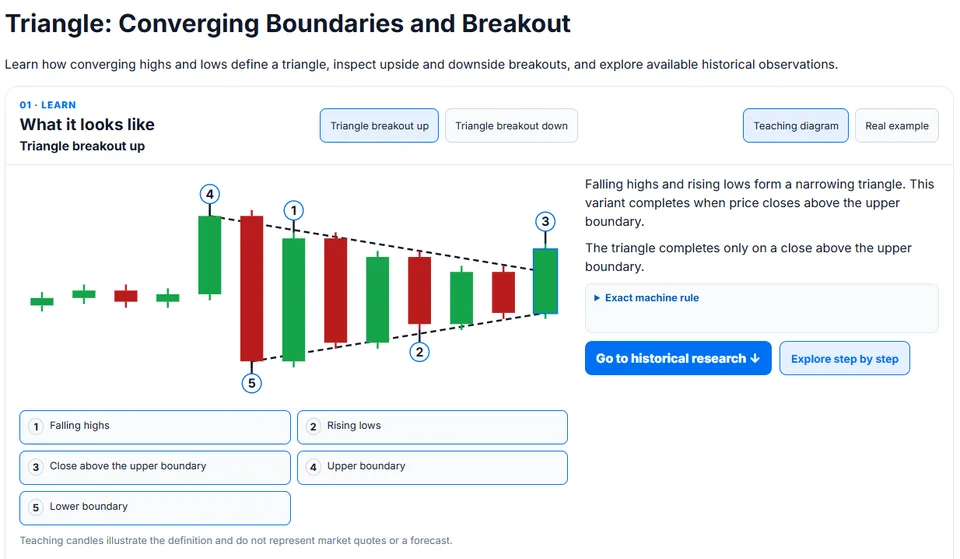
Triangles form when price fluctuations gradually narrow. Several types of patterns are distinguished according to the direction of their boundaries:
Ascending Triangle (Ascending Triangle) — the upper boundary is horizontal, while the lows gradually rise. The pattern is often considered potentially bullish.
Descending Triangle (Descending Triangle) — the lower boundary is horizontal, while the highs gradually decline. The pattern is often considered potentially bearish.
Symmetrical Triangle (Symmetrical Triangle) — the highs decline while the lows rise. Buying and selling pressure gradually converge, making the breakout direction harder to determine in advance.
An important difference between a symmetrical triangle and ascending and descending triangles is the absence of a clear advantage for either side. The direction of a potential trade becomes clearer after a boundary is broken.
You can learn more about the triangle pattern on the TLAP Pattern Lab page.
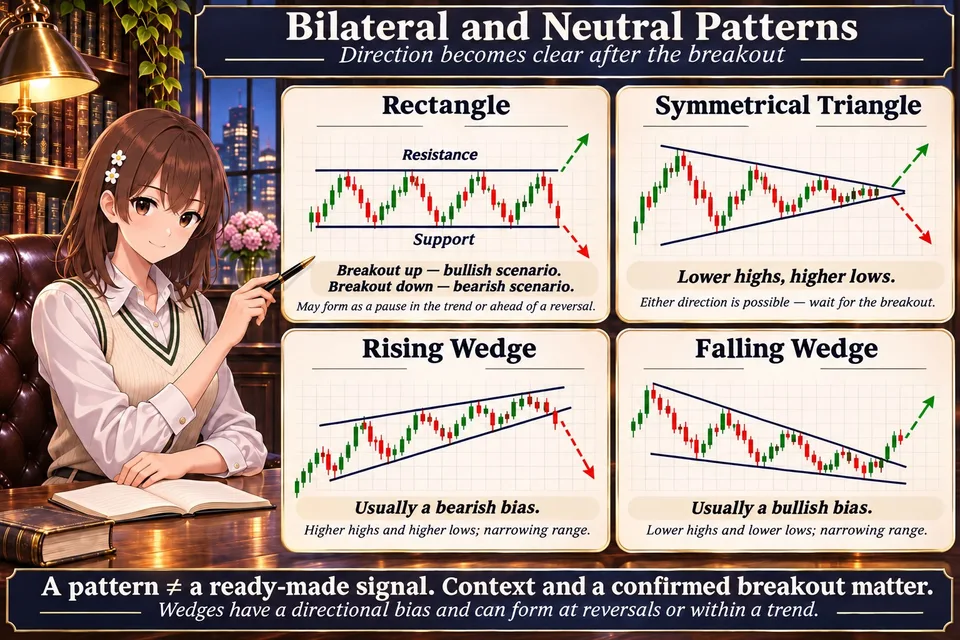
Bilateral and Neutral Patterns
Some patterns do not provide a clear indication of the direction of the next move. Their trading significance depends on which direction the price breaks out of the established range.
These models include symmetrical triangles, rectangles and certain types of broadening formations.
“Rectangle” (Rectangle)
The pattern forms when the price moves between relatively horizontal support and resistance levels for some time.
Buyers become active at the bottom of the range, sellers at the top. Until the price breaks out of the rectangle, the market remains in consolidation.
A break above the upper boundary may set up a rise; below the lower boundary, a decline.
A rectangle sometimes forms as a pause within a trend, and sometimes becomes an area of distribution or accumulation before a reversal. Its significance must therefore be assessed in light of the preceding price movement.
“Wedge” (Wedge)
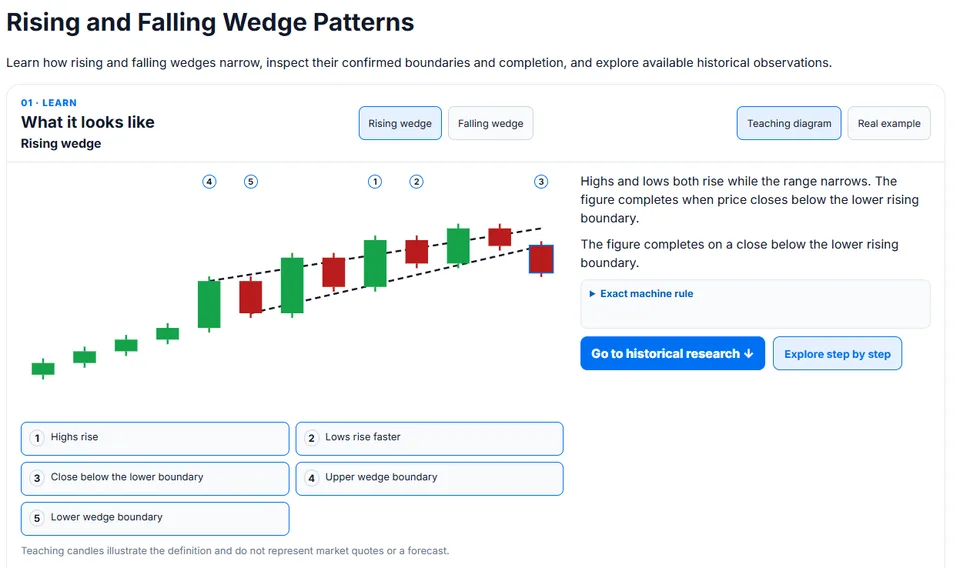
A wedge is formed by two converging sloping lines within which the price moves.
A rising wedge usually has higher highs and higher lows, with the distance between them narrowing. It is often viewed as a potentially bearish pattern.
A falling wedge forms as the price declines with a gradually narrowing trading range and is traditionally viewed as a potentially bullish pattern.
However, a wedge can appear both near a reversal and within an ongoing trend. It therefore cannot automatically be interpreted as a signal to buy or sell.
You can learn more about the wedge pattern on the TLAP Pattern Lab page.
How to Read Patterns: Shape Is Not the Only Thing That Matters
One common mistake novice traders make is looking for familiar geometric shapes on a chart and making decisions based solely on their appearance.
In practice, the context in which a pattern forms is much more important.
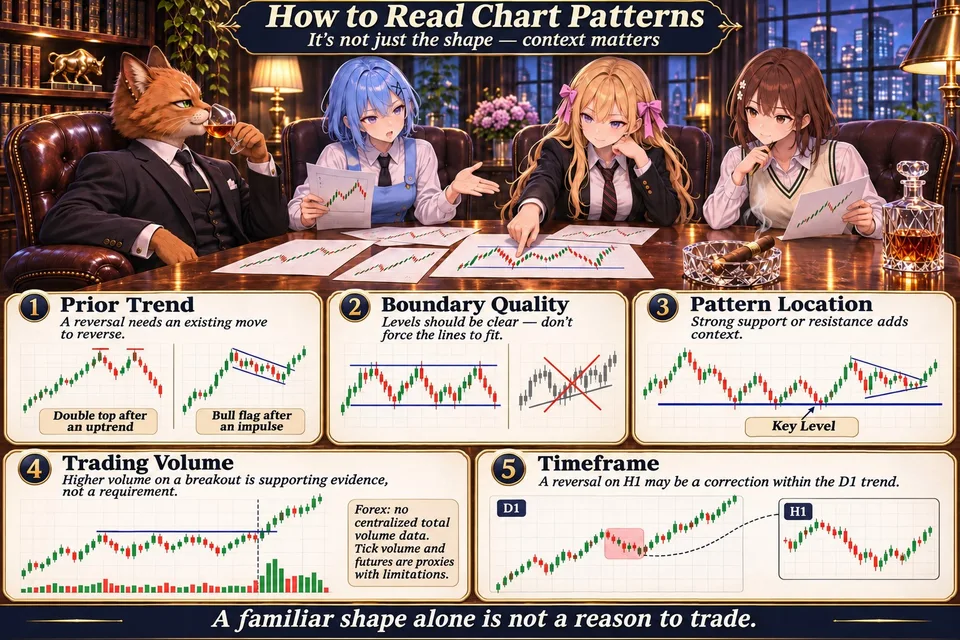
For example, a Double Top following a prolonged rise has a clearer reversal context than a similar formation that appears in the middle of a sideways range. Similarly, a bull flag following a pronounced upward impulse is a more logical trend continuation pattern than a similar formation following a prolonged decline.
Several factors must be considered when analyzing a pattern.
The preceding trend. Reversal patterns primarily make sense when they are preceded by a move that could potentially come to an end. Without this context, it is difficult to speak of a reversal.
The quality of the boundaries. Important levels should be reasonably clear. If drawing a pattern requires arbitrarily moving lines and adjusting them to fit price fluctuations, the likelihood of subjective interpretation increases.
Where the pattern forms. A pattern that appears near a strong support or resistance level may have greater practical significance than the same formation within erratic price movement.
Trading volume. An increase in volume as price breaks through a boundary can provide additional confirmation of market participation in the move. For example, if price breaks out of an ascending triangle on increased volume, this strengthens the case for a bullish scenario. However, volume is not a mandatory requirement for confirmation. In the Forex market, where trading is spread across different venues, centralized data on total volume is unavailable. In this case, traders can use tick volume or data from related exchange-traded futures, taking the limitations of these indicators into account.
Timeframe. The same pattern can have different meanings on different timeframes. For example, a reversal pattern on an hourly chart may turn out to be an ordinary correction within an uptrend on the daily chart.
Can you trade using patterns alone?
Patterns can form the basis of a standalone trading strategy. In practice, however, many traders use them alongside other technical analysis tools.
For example, support and resistance levels help identify significant boundaries of a pattern. Moving averages help assess the direction of the higher-timeframe trend. Volume indicators show participants' activity during a breakout, while oscillators help analyze momentum dynamics.
Liquidity analysis plays a separate role. Before a chart pattern breaks out, price may move toward areas where stop orders and other pending orders are clustered. This results in false moves beyond the pattern's boundaries, which can confuse a novice trader.
It is therefore useful to consider patterns as part of the broader market picture rather than in isolation.
Novice traders should avoid using a large number of patterns and indicators simultaneously. It is much more effective to choose a few clear patterns, such as the Double Top, Double Bottom, triangle and flag, and learn to analyze them consistently.
It is also useful to keep a trading journal, noting how closely the pattern matched its original definition, where the breakout occurred, whether there was a retest and how the trade ended. Over time, this will help assess the results of a particular pattern on the chosen instrument and timeframe.
How to Move from a Pattern to Opening a Trade
Recognizing a chart pattern is only the first stage of analysis. To open a position, you need to turn the anticipated direction of movement into a concrete trading plan.
Let's look at the sequence of actions.
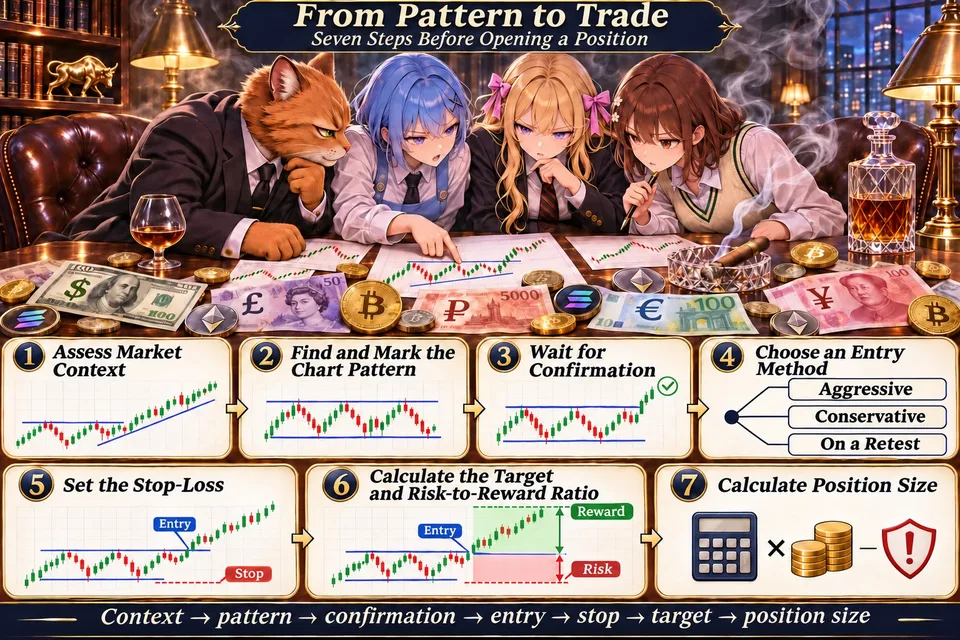
Step 1. Identify the Market Context
Before looking for an entry point, you need to understand the current state of the market.
Price may be in an uptrend or downtrend, moving within a sideways range, or transitioning from one state to another.
To do this, use the structure of highs and lows, trend lines, and horizontal support and resistance levels.
The goal is to determine which scenario makes sense to look for: a continuation of the move, a reversal, or a breakout from consolidation.
Step 2. Find and Mark the Technical Pattern
After identifying the context, the trader looks for a suitable chart pattern.
For example, after a strong rise, the price begins to form a descending channel. If its boundaries gradually narrow and the movement remains relatively compact, a bull flag may be forming.
At this stage, you need to mark the boundaries of the formation and identify the level whose breakout will signal the completion of the pattern.
Important: while the price remains inside the formation, the pattern may continue to develop, change shape, or break down completely. Therefore, you should avoid rushing to open a position.
Step 3. Wait for Confirmation
A breakout beyond a boundary is one of the key moments in moving from analysis to a trading signal.
For example, if the price forms an ascending triangle, the trader marks its upper boundary as a potential resistance level. Until the price breaks through this boundary, the pattern remains incomplete.
A candle closing beyond the boundary can serve as confirmation. Additional signs include an increase in trading volume, sustained movement in the direction of the breakout, and the price's ability to stay outside the previous range.
The difference between a breakout and a false breakout must be taken into account.
In a false breakout, the price briefly moves beyond the pattern's boundary but then returns inside the formation. This can happen because of insufficient activity among participants, a lack of liquidity on the opposite side, or changes in market conditions.
Therefore, traders need to assess both the fact that the price has crossed the line and how the market behaves afterward.
Step 4. Choose an entry method
Once a signal has formed, the trader chooses when to open a position. Depending on the strategy, three main approaches can be used for entering a trade.
Aggressive entry.
The trader opens a position when the price first moves beyond the pattern's boundary, or even beforehand, while the pattern is still forming, anticipating the expected direction of movement.
The advantage is the opportunity to obtain a better price and capture a larger portion of the potential momentum.
The disadvantage is the high risk of getting the direction wrong. The breakout may turn out to be false, and an unfinished pattern may change its structure.
Conservative entry.
The trader waits for a candle to close beyond the pattern's boundary and only then opens a position.
Unlike the aggressive approach, the decision here is made after the candle has closed beyond the level, rather than at the first touch or brief move through it.
This helps filter out some false breakouts but does not guarantee success. In addition, the entry price is usually less favorable.
Retest entry.
After a breakout, the trader does not open a position immediately but waits for the price to return to the boundary it previously broke through.
For example, if an ascending triangle breaks to the upside, former resistance may become support. If the price returns to this level, tests it, and starts rising again, an additional opportunity to enter a long position arises.
The advantage of this approach is a clearer point for placing a stop-loss and the opportunity to obtain a favorable ratio of potential profit to risk.
The disadvantage is that the price does not always return to the broken boundary. Sometimes the market continues moving without a retest, and the trader misses the trade.
Thus, breakout confirmation and a retest are not the same thing. Confirmation helps establish that the boundary has indeed been broken, while a retest provides an additional opportunity to enter after this event.
Step 5. Determine the Stop-Loss
Before opening a trade, you need to determine the price at which the original trading idea becomes invalid.
The structure of the pattern itself is used for this purpose.
For example, when buying after an ascending triangle breakout, the stop-loss can be placed below the most recent local low or an area that must hold for the bullish scenario to remain valid.
When trading a Double Top after a neckline breakout, the protective order can be placed above the corresponding local structure.
A stop-loss should not be placed directly at the pattern boundary without accounting for market volatility. Normal price fluctuations, the spread, and brief moves beyond the boundary can lead to the position being closed prematurely.
The distance to the stop should reflect the pattern's structure and the instrument's current volatility.
Step 6. Calculate the Target and Risk-to-Reward Ratio
Some patterns allow an approximate estimate of the potential magnitude of a move.
For example, for the Head and Shoulders pattern, the classic method involves measuring the distance from the top of the head to the neckline. This distance is then projected from the neckline breakout point in the direction of the expected move.
For triangles and rectangles, the maximum height of the pattern is also measured, and the resulting value is projected from the breakout point.
Such targets are called a measured move (Measured Move).
However, the calculated target is not a level that the price must reach. In practice, the move may stop earlier, and its duration and magnitude will be affected by other support and resistance levels, volatility and market conditions.
Therefore, the trader compares the calculated target with the nearest significant levels and assesses the ratio of potential profit to risk.
Step 7. Calculate the Position Size
Even a high-quality pattern does not guarantee a positive outcome. Therefore, position size must be determined by the acceptable loss, rather than confidence in the trading signal.
For example, a trader has a deposit of $5,000. They are willing to risk 1% of their capital on one trade — $50.
After a breakout and retest of the pattern, the trader plans to open a long position. The distance from the entry point to the stop-loss is 30 points, and the potential target is 60 points away.
The risk-to-reward ratio (Risk/Reward Ratio) is 1:2.
This means that the potential loss is half the expected profit. To lose no more than $50 if the stop-loss is triggered, the monetary value of one point for the selected position size should be approximately $1.67.
If the target is reached, the gross profit will be about $100 before accounting for the spread, commissions, and slippage.
Thus, even if a pattern provides a clear signal, the trader must check whether the distance to the target justifies the risk being taken.
If the potential profit is too small relative to the possible loss, it is better to skip the trade.
Common Mistakes Made by Beginner Traders
Using patterns seems simple enough: just recognize a formation and wait for the right move. In practice, beginner traders often make several mistakes.
Trying to see a pattern on every chart. If you have to force a formation to fit the price movement, it may be ordinary noise rather than a reliable pattern. It is better to work with clear formations than to find dozens of questionable signals.
Entering before confirmation. A trader sees a developing Head and Shoulders pattern and opens a short position without waiting for a break of the neckline. But the pattern may fail to complete, and the price may continue rising.
Ignoring the higher timeframe. A local buy signal may conflict with a strong downtrend on the daily chart. This does not make the trade impossible, but it changes its probability of success and the nature of its risk.
Misjudging false breakouts. A brief move beyond a pattern's boundary does not always mean the start of a new move. It is essential to pay attention to candle closes and subsequent price behavior.
Lacking a trading plan. Opening a position without predefined stop-loss levels, a target, and acceptable risk turns pattern analysis into an attempt to guess the market's direction.
Staking too much on one pattern. Even a well-formed pattern can end unexpectedly. You should not increase your position size simply because a pattern seems particularly convincing.
Disclaimer
This material is provided solely for educational and informational purposes and does not constitute investment advice or a call to execute trades. Technical analysis patterns do not guarantee a particular price movement and may form imperfectly or end in false breakouts.
Trading financial instruments involves the risk of losing capital. Before opening a trade, independently assess market conditions, calculate potential losses, and consider your own risk tolerance.