
Double Top / Double Bottom - Nuances of Working with the Pattern

Good day, ladies and gentlemen, forex traders. In today's video lesson we will talk about the secrets of working with the classic chart pattern "Double Top / Double Bottom". This pattern occurs often, is mentioned in many forex books, but few know how to trade it correctly.
Hello ladies and gentlemen traders. In this video lesson we will talk about such a chart formation as a double bottom or a double top. This pattern occurs very often. It is a reversal one. And in this lesson we will talk about how to enter the market when this pattern appears. How to place stop losses, targets. How not to get caught by a false double bottom / double top pattern, what you should pay attention to. As well as the characteristics of the most adequate evaluation of this pattern.
What is a double bottom or a double top?
This pattern appears when the price reaches some values, draws a high, then goes down for some time. Then it returns to about the same level and draws the same high at about the same level as the previous one, and then reverses and goes down. This is in the case of a double top.
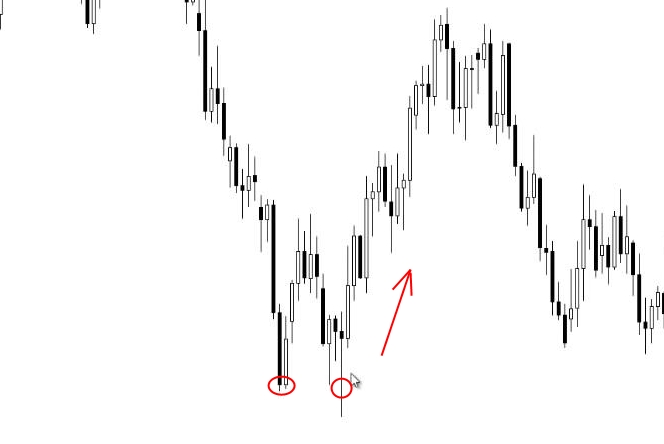
And in the case of a double bottom, as for example in the picture above, the price reaches certain values. It draws a low, then goes up for some time, and then returns to about the same level and reverses again, drawing us a second low. And only after that the price begins to rise. This pattern will be called a double bottom. And in the case when the price goes down, drawing us two highs, this is a double top.
I think it is clear: in the case of a double top, this pattern is a reversal one and subsequently contributes to the price moving down. In the case of a double bottom, this pattern again is a reversal one, but contributes to further price growth, because it goes up. Accordingly, the "double bottom" pattern reverses a bearish trend, the "double top" pattern reverses a bullish trend.
What should you pay attention to?
Suppose you had some buys open, you saw a double top and accordingly decided to exit. So, how do you determine whether this pattern is quality or not?
First, it is worth paying attention if at the level of the double bottom, or double top there is also a support / resistance level. In this case, we have one top, a second one, and you can pay attention to the fact that a level is located nearby. And it, in fact, almost overlaps with our double top.
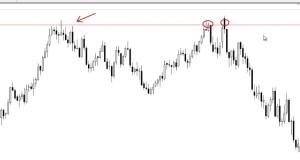
This gives additional strength to the pattern and it becomes more significant. Secondly, there should be at least six candles between the two tops. That is, the tops should not literally go one after another.
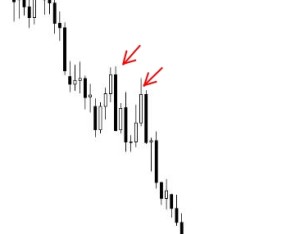
There should be at least 6 candles between the tops. So that visually it looks like 2 peaks or troughs, and not 2 or 3 candles standing next to each other. But at the same time keep in mind that if the second top is very far from the first, then such a pattern most likely is not a pattern and it is just a coincidence, and most likely you will not see any strong trend reversal. A correction, perhaps, but no more. Accordingly, the farther the first top is located from the second, the weaker the pattern. Because the significance of the chart formation is simply lost over time.
What is interesting and what many beginners get caught on is that they think that a double top, or a double bottom, is formed only if the prices are almost identical. Suppose the high here reached 1, 6245 and the previous top here is 1,6245.
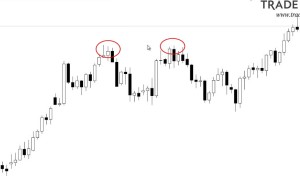
Only in the case when the prices are exactly equal do they think the pattern is correct and worth taking a trade. Quite the opposite, if the prices of the tops, or bottoms match very, very closely, almost literally to the pip, then most likely this pattern is false. It should be a little bit ugly. As in the picture below, when one top is higher than the other, or lower than the other, but they are not identical.
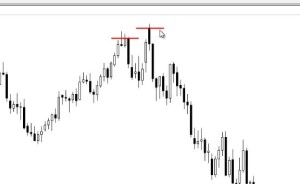
If the tops are identical, the price is very, very close to the values of the previous top, or the previous bottom, then most likely it is a false pattern. And you will not get any serious movement. There will be a correction, but you will not see any big moves. You should not count on them.
Therefore, if you see a double top or double bottom pattern and at the same time the prices of the tops, or of the bottoms, are almost identical, then it is better not to enter such a trade, it is better not to consider such a pattern. As for the location of the tops, or of the bottoms relative to each other. In the case when the maximum price values are declining, suppose the first top was at one level, and the second top was slightly lower, then there is a high probability of continued movement downward.
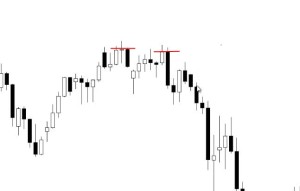
In the case when we have a double bottom pattern and at the same time the second bottom is slightly higher than the first, then in this case our chances that the price will go up increase. As I already said, the greater the distance between the two bottoms or tops, the less the probability that the pattern will work out strongly. There will not be some small correction, but a strong movement upward, if these were bottoms, or downward, if these were tops.
Therefore try to select trades in which the second touch turns out, if possible, to be lower compared to the previous one. The opposite is true in the case of a double bottom.
What is interesting, sometimes you can find on forums, or in some articles, mention of the triple bottom pattern, or the triple top. There is nothing supernatural in this, the same thing as a double bottom, but we have three touches. The triple bottom pattern works the same way as the double bottom. Accordingly, the triple top works the same way as the double top. Therefore, no difficulties should arise here. But most often it is the double bottom and the double top that occur. If you are looking for strong reversals, then pay attention to the space on the left. That is, there should be such an empty area to the left of the price and the trend should be quite strong and prolonged.
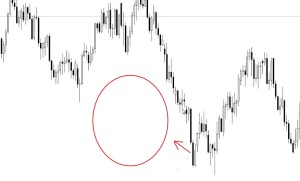
And if the reversal really does take place, you can catch a very, very large move. But if the space to the left looks filled, then accordingly you should not count on any strong reversal. But strong global reversals do not occur that often, so in any case, they are not easy to catch. Since they themselves arise rather rarely.
So how do you enter the market?
Let's look at the example of a double bottom. As we know, this pattern is a reversal one. We formed the first peak, then the second peak formed, and the price went up. You do not know what to do, whether to enter or not, when to enter, where to place the stop-loss and take-profit.
So how will we enter the trade? First, we draw the trend line of the previous trend. Moreover, it should capture the maximum that preceded the second bottom. In this case, we had a downtrend, which means our trend line will be built roughly like this. Next, we place a horizontal line at the level of our last maximum that preceded the second bottom, again.
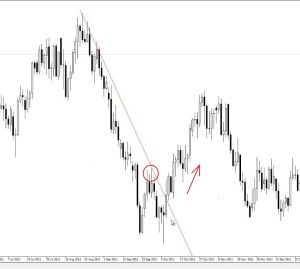
And we measure the distance from the level of the two bottoms to our last maximum. In this case, 380 points.
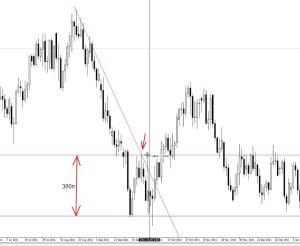
We will enter, as you may have guessed, on the breakout of our trend line. And our target will be the distance from the last maximum to the level of our last bottoms. It was 380 points, and accordingly, we measure it from the entry point. That is, our target will be broken through approximately right here.
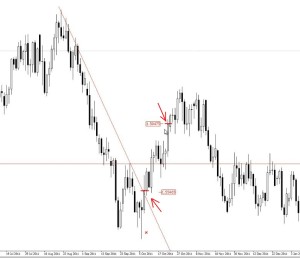
The breakout entry is average. And you can, of course, place pending orders; it is not necessary to sit in front of the monitor and wait for when this breakout will occur, and the stop-loss will be approximately at the level of our two bottoms, a little lower. And here is an interesting point. If we have some clearly standout pin bar, as in this case, then it is not necessary to place it below the low, because in that case the stop-loss will most likely turn out very large. Slightly below the general level of the two bottoms. So, this is how our trade will look. In this case, the take-profit was about 380 points and the stop-loss about 235 points. This is the kind of trade that could have resulted.
Best regards, Pavel TradeLikeaPro.ru
