
How to distinguish a liquidity sweep from a liquidity grab and why it matters

Traders often see the same picture on a chart: price approaches an obvious high or low, pierces it, and then either continues moving or sharply returns. These moves are called liquidity sweeps or liquidity grabs.
Every trader can clearly see in their account how and when their liquidity was swept. At the moment of a loss, the difference between a liquidity sweep and a grab does not matter to them, but after a stop-loss is triggered, it is worth trying to understand the theory.
The problem is that these terms have no single formal definition and are used differently across trading schools. For analysis and trading decisions, what matters more than the name of the move is what happened to price after it crossed the level.
Before going further, let us recall what liquidity is.
Liquidity is the market's ability to accommodate a trade without a significant change in price. Measures used to assess it include the bid-ask spread, market depth and the price impact of market orders.
The order book shows only part of the available liquidity, since stop orders are generally absent from it until they are triggered. An assumed pool of stops above a high or below a low is therefore an interpretation of market structure rather than a directly observable object.
Carol Osler's research shows that stop orders can indeed cluster around certain price levels and amplify a move once triggered. Nevertheless, every trader knows perfectly well where and why they place their stops and what results this produces.
Are liquidity sweeps and liquidity grabs the same thing?
Strictly speaking, a liquidity sweep (liquidity sweep) and a liquidity grab (liquidity grab) are not quite the same thing, although traders often use the terms interchangeably in practice.
Both interpretations can be found on trading forums: some participants consider a grab simply a faster version of a sweep, while others use the term “sweep” for any move through a level and “grab” only for a move through a level followed by a reversal.
For actual trading, the following working classification is useful.
Liquidity sweep (liquidity sweep) — price moves through an area where stops or other conditional orders are assumed to be concentrated. It may then reverse or continue moving. Volume during the move can be either high or low.
Liquidity grab (liquidity grab) — a specific scenario in which, after a liquidity sweep, the market quickly rejects the new prices and returns across the original level: movement in both directions more often occurs on elevated volume. In other words, what matters here is no longer the piercing itself, but the inability to hold beyond the level.
Thus, reaching and exceeding a price extreme constitutes a liquidity sweep. If price then holds at the new levels, it is a breakout; if it reverses, it is a grab of the crowd's stops.
The differences between a liquidity sweep and a liquidity grab can be presented in a table.
Characteristic | Liquidity sweep | Liquidity grab |
|---|---|---|
Price crosses an obvious level | Yes | Yes |
Stops/conditional orders may be triggered | Yes | Yes |
A return across the level is required | No | Yes |
A genuine breakout is possible | Yes | No |
A reversal is possible | Yes | Yes |
A new extreme on high volume | Not required | Usually required |
This distinction is particularly useful because merely crossing a high or low says nothing about the direction of the next move. In today's discussions, traders often specifically stress that a liquidity sweep is a reason to watch the market, rather than a standalone reversal signal.
What a liquidity sweep and a liquidity grab look like
Technical analysis
First, mark the previous high and low, local extremes, range boundaries, session highs and lows, equal extremes and strong horizontal levels. These points indicate potential areas where stop orders are concentrated.
An important signal that we are seeing a liquidity sweep is the appearance of RSI and MACD divergences.
The appearance of reversal candlestick patterns and Price Action patterns also signals that the new extreme is more likely a liquidity sweep.
Let us look at a real example.
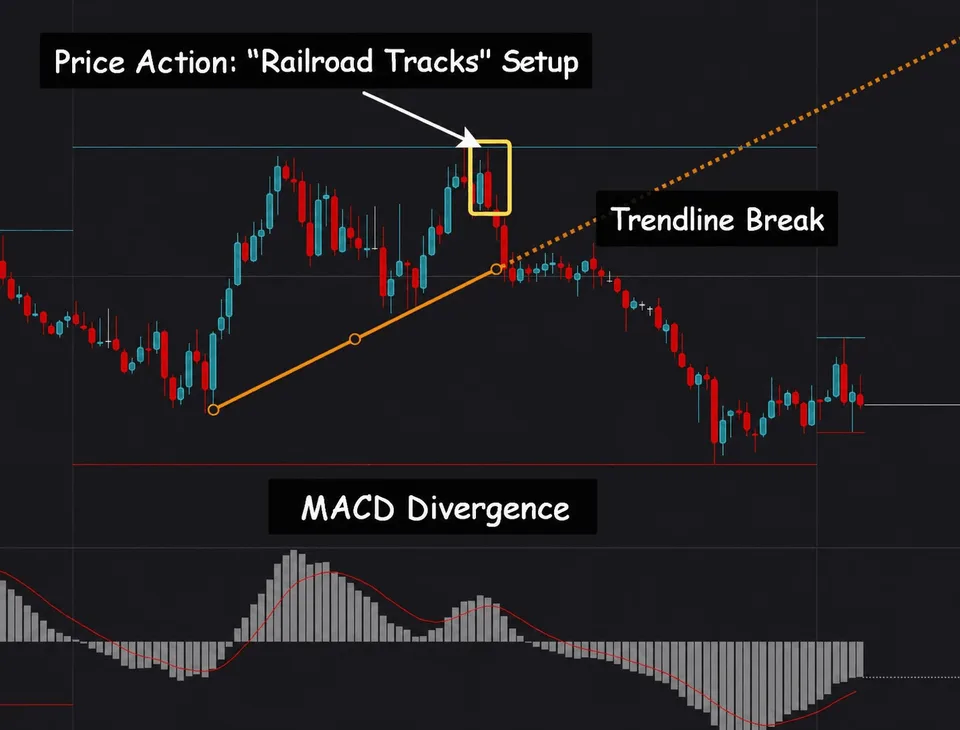
The chart immediately shows three signals that the new high was a liquidity sweep:
A break of the trendline that formed after the new extreme appeared.
The appearance of MACD divergence.
The appearance of the “Rails” setup (Price action).
For most traders, these three signals alone are enough to suggest a market reversal after a liquidity sweep.
But in modern markets, basic technical analysis is often insufficient to be fully confident about a liquidity sweep. The main problem is that traditional indicators do not show the hidden pool of stops. They provide indirect signs that the move near a level may be strong, weak or running out of steam.
Volumes, clusters and order flow and momentum
An increase in vertical volume during a breakout can confirm its strength. A break of support or resistance on rising volume generally carries more weight than a similar breakout on low volume. At the same time, a return as well
A cluster chart and its footprint variant show how many aggressive trades took place directly at the extreme, how they absorbed limit order supply and how far price is able to advance.
A typical sweep looks like a quick move through a level followed by either a return or price holding beyond it. A liquidity grab occurs when large, aggressive volumes cannot push through limit orders that prevent price from crossing the passive level.
The same example again. Let us examine the volume structure of the liquidity sweep.
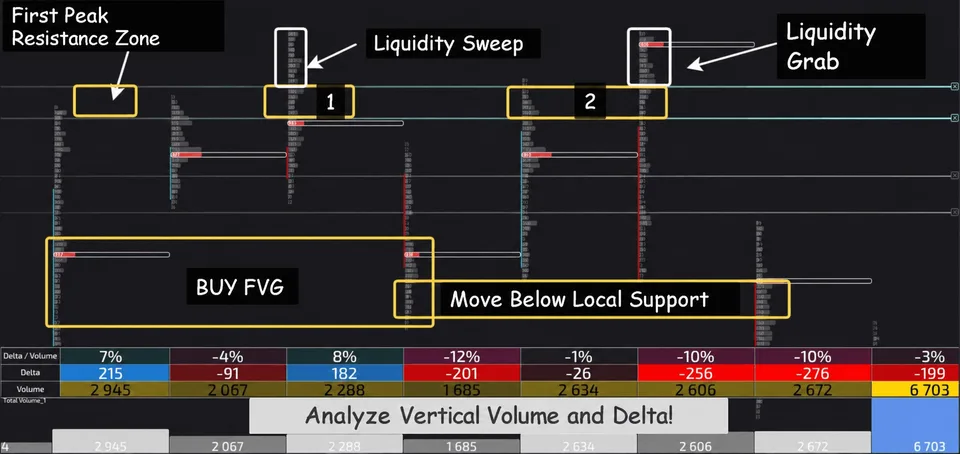
First, price approaches a range where participants previously built tactical short positions. The initial reaction is an inability to overcome the zone. Capital then accumulates, accompanied by declining vertical volumes and a narrowing candle range.
The next step is the first move above the previous high, followed by an immediate reversal. The move through the zone and back occurred with an imbalance in the resistance zone, that is, in the way a genuine breakout should look. This is what a classic liquidity sweep looks like.
This is followed by trading back through the zone, a reversal and trading through the FVG imbalance of the previous impulse.
The next step is another move through the resistance range, above which substantially more money flows through the clusters than on the previous attempt: compare the horizontal volume values in each cluster above the previous resistance zone — they are lower on the left than on the right.
A sharp turn then develops into a full reversal on elevated volumes. This is a classic liquidity grab.
Procedure for analyzing a liquidity sweep zone
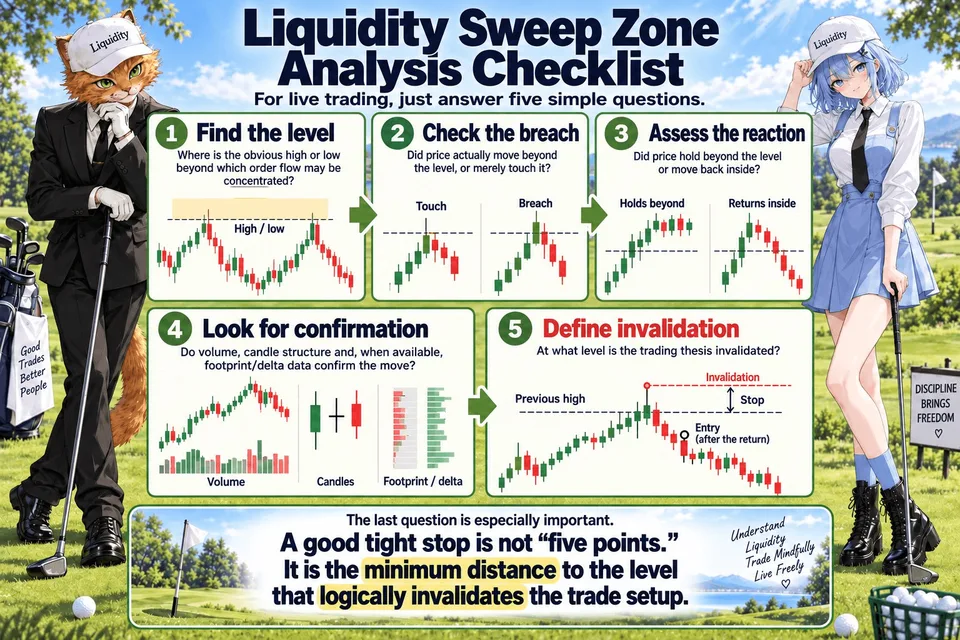
For actual trading, answering five simple questions is enough.
First: where is the obvious high or low beyond which order flow may be concentrated?
Second: did price actually move beyond this level, or did it merely touch it?
Third: what happened immediately after the move beyond it — did price hold there or return?
Fourth: is the move confirmed by volume, candle structure and, where data is available, the cluster/delta?
Fifth: where is the level beyond which the hypothesis no longer works?
The last question is especially important. A good tight stop is not a “five-point stop.” It is the minimum distance to the level that logically invalidates the trading scenario.
Finding an entry point and placing a stop after identifying a liquidity sweep zone
When should you look for an entry?
A trader should not guess where a liquidity grab will occur. First, they should wait for confirmation that liquidity has indeed been swept and price has rejected the new level.
This approach both reduces the number of false entries and helps avoid placing a stop directly at the most obvious price extreme.
Where should you look for an entry?
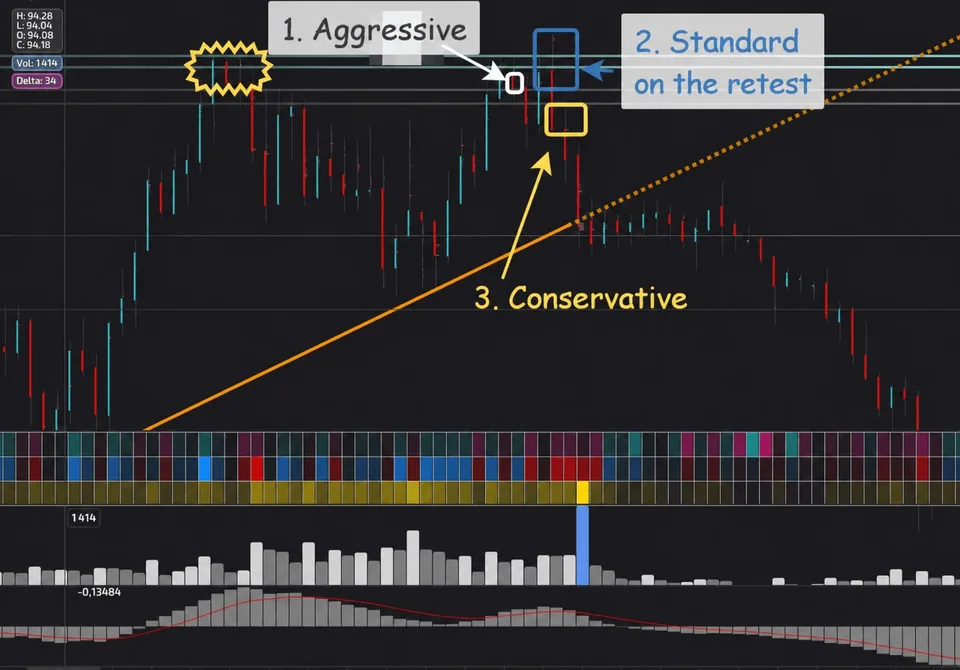
Here, everything depends on the analysis system the trader uses.
Aggressive entry. A trade can be aggressive, meaning it is entered immediately after a preliminary signal forms on the higher timeframe.
Standard entry on a retest. Waiting for a retest on the trading timeframe and entering with a tight stop.
Conservative entry. Here, on a lower timeframe, the trader looks for a break in the trading timeframe's structure and the start of momentum.
Where should you place the stop?
The stop should be placed beyond the extreme formed by the liquidity sweep.
Disclaimer
This material is educational and does not constitute an investment recommendation. The market structures described do not guarantee any particular price movement.
Before opening a position, assess volatility, the instrument's liquidity, potential slippage and acceptable risk.