
How to Identify a Liquidity Zone: A Step-by-Step Guide

A liquidity zone in trading is a price area where a significant volume of orders or potential order flow capable of affecting market movement may be concentrated. However, there is no single exchange-defined meaning of a “liquidity zone.”
Depending on the approach used, it may refer to actual limit orders in the order book, a cluster of stop orders near prominent extremes, an area of elevated traded volume, a major liquidation level, or a combination of several factors. This is why the same area on a chart may be called a liquidity zone, supply/demand zone, support/resistance, or liquidity pool—even though these terms have different economic meanings.
Formally, liquidity is the ability to buy or sell an asset quickly with little impact on its price; it is assessed using the spread, market depth, and price impact.
A Little History
Historically, the idea of finding areas where buyer and seller interest is concentrated emerged long before the modern term “liquidity.” Early technical analysis already linked price movement to the balance of supply and demand, volume, and the market’s reaction to particular price levels.
Richard Wyckoff, who worked with markets in the early 20th century, systematized observations of price, volume, and accumulation and distribution phases. In his method, support and resistance were viewed not as mathematically precise lines but as areas where supply and demand interact.
In the 1970s–1980s, these observations received a formal explanation within market microstructure. Research by Black, Glosten and Milgrom, as well as Albert Kyle, showed how the spread, market depth, information asymmetry, and order flow affect price formation.
In Kyle’s model, price is viewed as the result of sequential auctions, while order flow becomes one of the key sources of information for market participants. Traders’ attention therefore gradually shifted from simply recording prices to asking which orders are behind a price movement and how easily they can be executed.

A separate branch of development was Market Profile, created by CBOT trader J. Peter Steidlmayer in the 1980s. Here, the market is viewed as a continuous two-sided auction, and analysis focuses not only on price but also on where the market spends time and forms an area of accepted value.
Later, electronic trading venues made the order book (DOM), footprint, and other order-flow analysis tools available. This process unfolded differently in the foreign exchange market: spot FX remains a fragmented OTC market where transactions are distributed among dealers, electronic venues, and central limit order books. New tools appeared in the cryptocurrency world, including aggregated order books, liquidation maps, and other specialized models.
What Liquidity Means in More Technical Terms
In professional terms, liquidity describes not how much money there is in the market overall, but how easily a trade of the required size can be executed near the current price.
The Bank for International Settlements identifies several key dimensions: the bid-ask spread, the depth of the central order book, and a trade’s price impact. A deep market can absorb a relatively large order with less price movement; a thin market reacts much more strongly to the same volume.
This leads to the first important distinction. Market liquidity and a liquidity zone on a chart are not the same thing. A market may be highly liquid overall while still having individual price levels with particularly high concentrations of orders. Conversely, a large visual volume on a chart does not necessarily mean that many executable orders are currently located at that level.
Actual Liquidity in the Order Book
On a centralized exchange, the most direct way to see liquidity is to examine the order book, or DOM (Depth of Market). It shows buyers’ and sellers’ limit orders at different price levels.
The aggregate volume of orders at a certain distance from the mid-price is used as a measure of market depth. Kaiko, for example, calculates market depth as the volume of orders within a specified range of the current price, including separate bid and ask values.
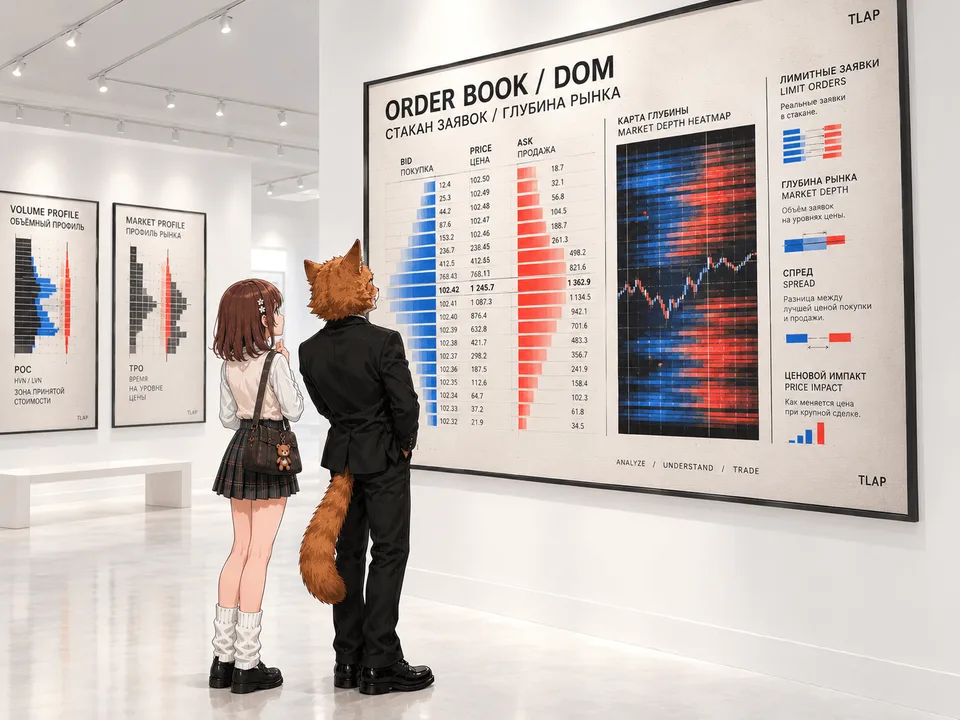
If the order book contains a large volume of sell limit orders (asks) at 100, that level can indeed be called an area of visible liquidity.
Aggressive market buyers may absorb these orders. While supply remains, upward movement may slow; once it has been fully absorbed, the price can move farther. The same logic applies to large buy orders (bids) below the market.
In Bookmap visualizations, such levels appear as areas of increased order density.
However, the order book does not show the expected future placement of liquidity. Limit orders can be moved, partially filled, and canceled. Kaiko also notes that high observed depth does not guarantee resilient liquidity: when quote churn is high, meaning quotes change rapidly, orders may disappear under stress.
Stop Orders as Potential Liquidity
The second category is conditional orders, which are not yet present in the order book as ordinary limit orders. For example, a sell stop may be placed below the current price. Once the trigger level is reached, it activates and becomes a market or limit order, depending on the order type. CME explicitly notes that a stop order does not enter the order book until it is activated.
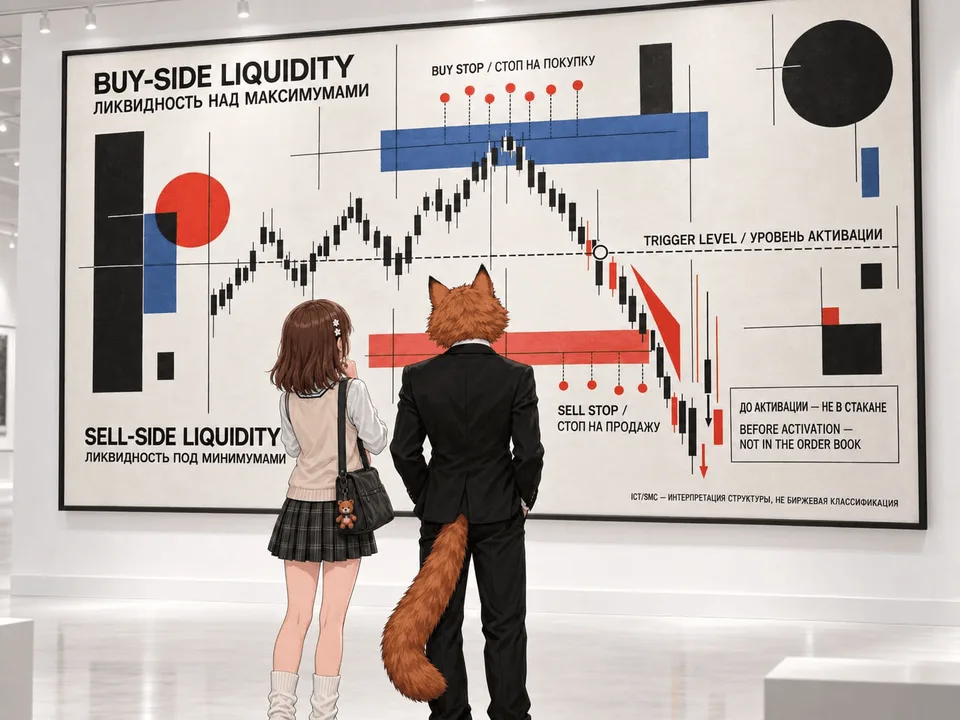
This is the origin of the modern concepts of buy-side liquidity and sell-side liquidity. In ICT/SMC terminology, buy-side liquidity generally means an assumed cluster of buy stops above prominent highs, while sell-side liquidity means sell stops below lows. This is not an official exchange classification but a particular way of reading chart structure.
The idea that stop orders cluster together does have an empirical basis. Carol Osler’s research using foreign exchange market data showed that stop-losses and take-profits do cluster around prominent levels, particularly round values. Moreover, the author found a link between stop-loss activation and accelerating exchange-rate movements, meaning a cascading effect is possible without assuming a deliberate “hunt” for a particular trader.
Liquidity According to Analytics Providers
More complex frameworks are used for the crypto market. Kaiko assesses liquidity through trading volume, market depth, and slippage simultaneously, emphasizing that one metric is insufficient. Liquidity is also distributed among many exchanges, with a significant share of global market depth concentrated on a relatively small number of venues.
There are also liquidation heatmaps . They show not actual orders resting in the order book, but calculated areas where liquidations may occur under a particular structure of leverage and open positions. CoinGlass explicitly describes its models as calculations of levels based on market data and leverage parameters, while Hyblock describes them as projected levels of potential liquidation.

In practice, it therefore makes sense to distinguish three layers:
visible liquidity—orders in the order book;
conditional liquidity—assumed stops and other orders that have not yet been activated;
calculated liquidity—for example, potential liquidations and other modeled levels.
Misconceptions About Liquidity Zones
The term’s popularity has led people to apply it to almost any area from which price has ever reversed. Forum discussions show how widely traders’ ideas differ about what counts as liquidity. In some discussions, a liquidity zone is practically equated with support and resistance levels; in others, it refers exclusively to a cluster of stops.

Mistake No. 1: “The Market Is Deliberately Hunting My Stop”
This scenario is often described as follows: price approached a level, took out the stops, and immediately moved in the opposite direction. However, the existence of such a pattern does not by itself prove deliberate “stop hunting.”
The mechanics may be much simpler. If conditional orders are genuinely concentrated at a particular level, their activation increases the flow of market orders. When book depth is insufficient, this can accelerate the movement. Osler’s research shows precisely that clusters of stop orders may amplify price movements and create cascades. This does not mean that a market maker must deliberately move the entire market specifically toward retail traders’ stops.
On forums, this issue produces opposing interpretations: some participants call such movements a liquidity sweep, while others point out that ordinary order-book dynamics are enough to explain many cases.
Mistake No. 2: “Liquidity Is Just High Volume”
Volume and liquidity are closely related, but they are not synonymous. Volume shows how much has already traded. Liquidity describes the ability to execute a new trade with acceptable spread, slippage, and price impact.
For example, a market may experience an enormous surge in volume at the very moment liquidity deteriorates: orders are canceled, the spread widens, and one large market order moves the price through several levels. Kaiko therefore recommends examining not only trading volume but also market depth together with slippage.
Mistake No. 3: “A Large Order-Book Wall Will Definitely Hold the Price”
A limit order exists until it is filled or canceled. A large order alone therefore does not mean the level will provide reliable support or resistance.
For analysis, it is more important to observe what happens as price approaches the wall: whether the volume remains, whether orders are filled, whether aggressive opposing flow appears, whether absorption occurs, or whether the level is rapidly depleted. Book dynamics are often more informative than a static snapshot. Kaiko separately warns that observed depth may be overstated by pending orders that disappear quickly.
Mistake No. 4: “Every Previous High Is a Liquidity Zone”
A previous high can indeed serve as a reference point for an assumed cluster of sellers’ stop orders (buy stops). But this is a hypothesis, not an observed fact. Stop orders are not displayed directly on a conventional candlestick chart until they are activated.
It is therefore more accurate to say, “a pool of stop orders may probably be located above this high,” rather than “liquidity is definitely located here.”
Mistake No. 5: “Every Penetration of a Level Is a Liquidity Sweep”
In SMC/ICT, a liquidity sweep generally involves price moving beyond an obvious extreme and returning inside the range.
But an ordinary breakout may look exactly the same at first. Only subsequent price behavior shows whether the new price was accepted or the market returned to its previous structure. Even specialized materials on this concept emphasize that merely setting a new extreme is not enough to distinguish a liquidity sweep from a full breakout.
Mistake No. 6: “A Liquidation Map Shows Actual Stops”
As a rule, a liquidation map is a model that estimates potential liquidation levels based on price, open positions, and leverage structure. CoinGlass and Hyblock explicitly describe such tools as calculated or estimated levels. A liquidation heatmap should therefore be used as a map of potential forced order flow, not as a direct snapshot of the order book.
Popular Approaches to Identifying Liquidity Zones
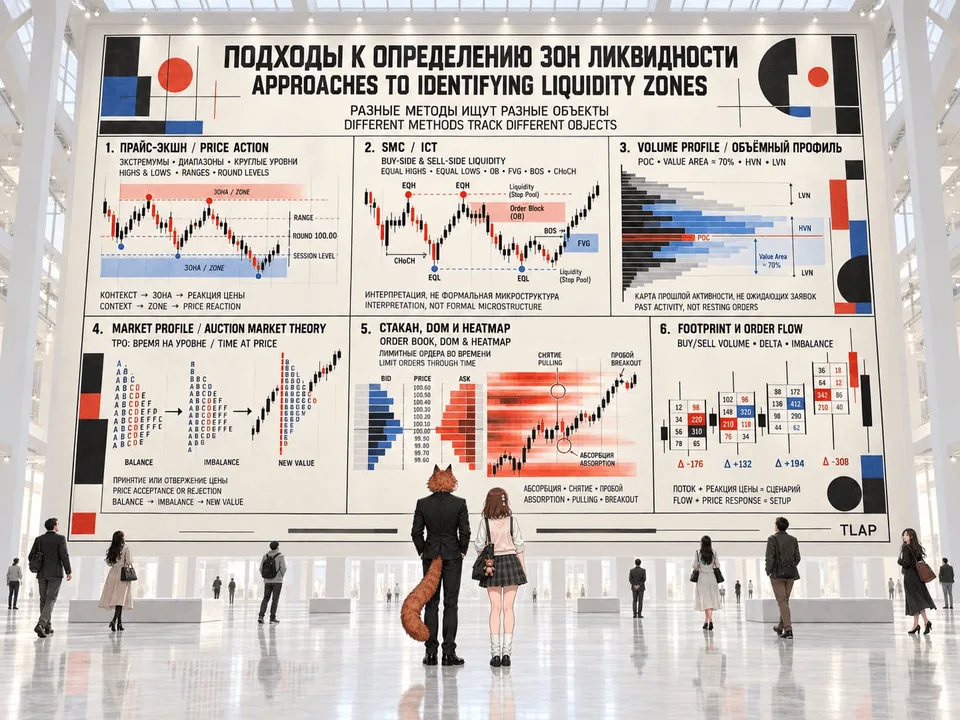
Different trading approaches seek different things. Two traders may therefore look at the same chart and identify different “liquidity zones.”
Price Action: Extremes and Reaction Areas
In classical technical analysis, the starting points are local highs and lows, range boundaries, levels from previous trading sessions, round values, and other prominent price references. They are of interest because market participants remember them and may place entries, stops, and take-profit orders nearby.
In this sense, classical ideas about support and resistance levels overlap with liquidity analysis (supply and demand), but they are not identical.
Support shows an area where demand historically strengthened, while price action tries to answer a different question: which orders might be activated if price reaches this area now?
Incidentally, CMC Markets explicitly emphasizes that support and resistance are zones, not mathematically precise lines.
The trading principle here is simple: first determine the context—a trend, range, or transitional state—then identify the key zone, and make a decision based not only on price touching the level but also on its reaction.
Smart Money Concepts and ICT
In SMC/ICT, the primary focus is assumed pools of buy-side and sell-side liquidity. Traders commonly mark equal highs and equal lows, previous daily or weekly highs and lows, and other obvious extremes.
This concept distinguishes liquidity sweeps, liquidity runs, order blocks, fair value gaps, BOS (Break of Structure), and CHoCH (Change of Character). The main idea is not to treat every level as support or resistance, but to view it as a potential area of order concentration and wait for confirmation of the reaction after the level is reached.
It is important, however, not to transfer SMC terminology into formal microstructure without qualification. It is primarily a method of interpreting a price chart. The presumed existence of an order pool on the chart provides no information about its exact size.
Volume-Based Models
Volume Profile answers a different question: where the market has already completed the greatest number of trades.
POC is the level with the highest traded volume. The Value Area shows a selected range, usually about 70% of volume. HVNs, or High Volume Nodes, are areas of elevated volume concentration; LVNs are areas through which price moved more quickly and where fewer trades accumulated.
Volume Profile is best viewed not as a map of waiting orders, but as a map of past trading activity. Nevertheless, when price returns to areas of high horizontal volume, a reaction often occurs.
Volume Profile helps show where the market previously accepted price and where it moved through quickly.In practice, this means an HVN may be viewed as an area of potential slowing and balancing, while an LVN may sometimes become an area of rapid passage. But none of these nodes is an automatic buy or sell signal.
Market Profile and Auction Market Theory
Market Profile is built around the idea of the market as a two-sided auction. Unlike Volume Profile, the classic TPO approach primarily records the time price spent at a particular level. The profile therefore shows where the market developed accepted value and where price merely explored a level briefly.
In trading practice, this leads to a fundamentally different question: is the market accepting or rejecting the current price?
When the market is balanced, Auction Market Theory implies rotation within the value area. When an imbalance arises, price begins searching for a new acceptance range. Value Area boundaries, POC, profile extremes, and areas of low activity can therefore serve as references for continuation or return scenarios.
Order Book, DOM, and Heatmap
This is the analytical method closest to actual orders. DOM shows the current structure of bids and asks, while a heatmap shows how limit-order density has changed over time. Bookmap, for example, displays current and historical book liquidity together with executed trade volume.
Here, an observable liquidity zone may be defined, for example, as a persistent cluster of sell limits above the market. But it is better to base a trading decision not on its existence, but on how price interacts with the cluster.
If aggressive market buying is repeatedly absorbed by substantial supply, this is a sign of absorption. If the order disappears before price reaches it, its significance declines. If the volume is fully consumed and price continues moving, it becomes a breakout scenario.
Footprint and Order Flow
Footprint adds another level of detail: volume is distributed within a candle by price level and divided by the direction of aggression. TradingView allows traders to analyze buy/sell volume, delta, and imbalances between adjacent price levels.
Here, a liquidity zone is identified less in advance than through order-flow behavior as price approaches. For example, high selling volume at the highs does not by itself mean the market will reverse. But a combination of high volume and price’s inability to continue moving may form a trading scenario.
What Counts as a Strong Zone
There is no universal ranking of zones, but in practice it is useful to consider a combination of several features.

The areas of greatest interest are usually those where market structure, expected conditional order flow, and actual trading-activity data converge. For example, the previous weekly high coincides with a range boundary, a round level is nearby, and a significant ask appears in the order book when it is tested.
Even such confluence does not turn the level into a guaranteed reversal point. Liquidity is affected by market conditions, volatility, trading hours, news, book depth, and participants’ behavior. Kaiko separately emphasizes that liquidity must be analyzed dynamically and across different market regimes.
How to Identify a Liquidity Zone: A Step-by-Step Algorithm
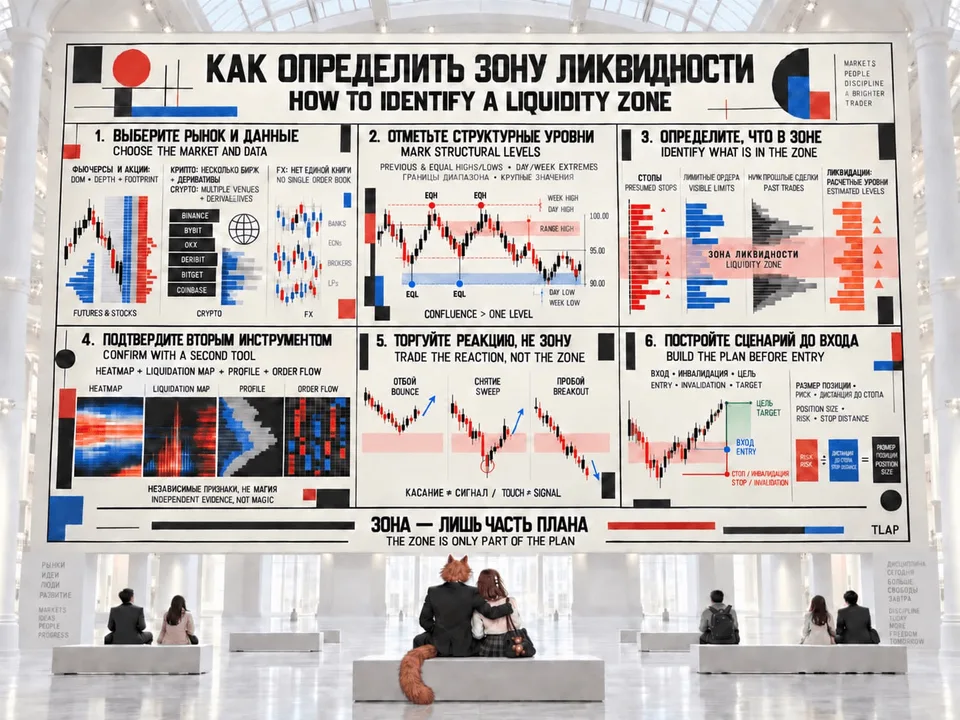
Step 1: Choose the Market and Data Source
First, determine exactly where you trade.
For a futures contract or stock with a centralized order book, you can use the order book, market depth, and footprint. For the spot or perpetual crypto market, it makes sense to examine data from several venues and derivatives metrics as well. The forex market is different: there is no single global order book because the market is fragmented among dealers and electronic venues.
This is a fundamental point. Binance’s order book is not the order book of the entire Bitcoin market, just as one FX dealer’s book is not the book of the global EUR/USD market. Nevertheless, some exchange-traded assets should be viewed on different venues: for example, during the European session, order flow and Volume Profile work better for Brent crude oil (ICE), while WTI (CME) looks cleaner during the US session.
Step 2: Mark Structural Levels
On a higher timeframe, mark previous highs and lows, equal highs and lows (double tops and double bottoms), daily and weekly highs and lows, range boundaries, and obvious round values.
The task here is not to declare every level “liquidity.” It is to create a list of places where future order flow may potentially concentrate.
The basis for such a hypothesis becomes especially strong when several reference points coincide: for example, the previous weekly high is also a range boundary and a round number. Research on foreign exchange orders shows that conditional orders do indeed cluster around prominent levels.
Step 3: Determine Exactly What Is in the Zone
Now answer the main question: what kind of liquidity are you actually looking for?
If it is a zone beyond the previous high, it concerns assumed buyers’ stops.
If there is a large ask in the order book, it is visible limit liquidity.
If the profile shows an HVN, you are seeing a concentration of trades that have already occurred.
If the liquidation map shows a bright area above price, it concerns potential forced closures.
These four phenomena should not be combined into one category.
Step 4: Seek Confirmation With a Second Tool
After marking the zones, it makes sense to verify them with an independent data source.
For example, an assumed zone above a high becomes stronger if, at the same time:
dense liquidity lies beyond the extreme on the heatmap;
a calculated liquidation cluster is located in this area;
an important profile level is nearby;
as price approaches, aggressive buyer flow appears but cannot push the price farther.
This is no longer a “magic zone,” but a confluence of several independent signals. Kaiko and BIS emphasize that liquidity is multidimensional and cannot be fully described by one indicator.
Step 5: Do Not Trade the Zone Itself—Trade the Reaction
This is one of the most important practical principles.
The mere presence of liquidity does not indicate that price will reverse. It may be absorbed, canceled, or disappear altogether. A scenario is therefore usually built around price behavior after contact with the zone.
For example, as price approaches a previous high, at least three different scenarios are possible:
rejection: price tests the level and quickly returns below it;
sweep: price moves above the extreme, activates some of the expected orders, and then returns to the range;
breakout: price moves above the level, accepts a new range, and continues moving.
In Auction Market Theory terms, the last option means price acceptance at a new level rather than a simple return to the old value. In order-flow analysis, final classification also requires observation of the subsequent trade flow.
Step 6: Build a Scenario Before Entry
A good liquidity zone should answer not only “where might movement occur?” but also where to enter, where the scenario is considered invalid, and where to place the next target.
For example, a trader assumes that sell-side liquidity is present below the range low. One scenario is to wait for price to penetrate the low, return to the range, and provide confirmation on a lower timeframe. Another is to treat the breakout as continuation and look for an entry on a retest of the newly accepted lower level.
In both cases, the zone is only part of the trading plan. Position size is determined by the distance to the stop and the acceptable risk, not by how “strong” the liquidity appears.
Conclusion: How to Use Liquidity Zones in Trading
In practice, a liquidity zone can be considered in three roles.
The first is a movement target. If a pool of buy-side liquidity is assumed above an obvious high, it can be used as a potential area for price to reach.
The second is a reaction area. After the zone is reached, the trader analyzes whether price rejection, absorption, a change in delta, a return to the range, or continuation of aggressive movement has appeared.
The third is a scenario-change area. If price does not merely penetrate the level but is accepted above it and continues forming a new structure, the assumption of a rejection scenario weakens.
This is why a liquidity zone is not a trading signal by itself. It instead answers the question “where might things become interesting?”, while the market’s reaction determines the entry point.
Terms: Liquidity, Volume, and Support
Let us review the main terms once more.
Support/resistance shows where price has historically reacted.
Volume Profile shows where the market has already traded actively.
Order book shows where visible limit orders are currently resting.
Liquidity pool in SMC/ICT indicates where conditional orders, primarily stops, may be located.
Footprint/order flow shows how aggressive trades interact with available liquidity.
Liquidation heatmap estimates where forced order flow may potentially arise because of liquidations.
These tools do not have to show the same picture. On the contrary, their divergence can sometimes be the most informative. For example, historical volume may be high while current depth is low. Or an assumed pool of stops may lie beyond an extreme, while there is no substantial opposing supply in the actual order book.
A professional approach to liquidity zones therefore begins not by searching for the “correct line on the chart,” but by asking: what exact type of liquidity is assumed here, and what data can verify it?
Disclaimer
This material is provided solely for informational and educational purposes and does not constitute investment advice or an offer to enter into transactions.
Analysis of liquidity zones, order books, volumes, profiles, and calculated levels does not guarantee the direction of price movement. Market data may be incomplete, fragmented, or model-derived, especially in OTC and cryptocurrency markets.
Leveraged trading carries a risk of significant losses.