
Two Powerful Range Breakout Indicators on TradingView

At the moment, there are many range breakout indicators that automatically set s/l and t/p.
In this article, we will recall what a breakout is and examine two new very powerful breakout indicators on TradingView.
Breakout in trading: how to determine the moment the market exits the range
Breakout is a key concept in technical analysis that denotes the moment when the price of an asset overcomes an important support or resistance level and continues moving in the same direction. This event often signals the start of a new trend and serves as a signal to act for traders.

A breakout occurs when the price overcomes resistance or support. Such a price impulse is usually accompanied by a significant increase in trading volume and volatility, which confirms the strength of the move.
Why breakouts happen and how to identify them
Breakouts often happen after periods of consolidation, sideways price movement in a narrow range. As the price approaches a key level, traders' pending orders and stop orders accumulate. Their mass activation at the moment of the breakout creates a "liquidity release" effect and pushes the price.
To distinguish a true breakout from a false one, you need to pay attention to several important confirmation criteria:
- Close beyond the level. The price must establish itself beyond the level boundary (a candle close on the chosen timeframe above resistance or below support), and not just touch it.
- Support from volume. A true breakout is accompanied by a sharp increase in trading volume, which indicates strong interest from market participants.
- Level test (retest). After the breakout, the price may return to the broken level to test it from the new side. If the level now acts as support (in a bullish breakout) and the price bounces from it, this is a strong confirmation of the signal's strength.
Main trading strategies
Entry on the breakout.
The most aggressive approach is entering the market at the moment of the level breakout. The trader places a pending order (buy-stop or sell-stop) right at the resistance or support level in order to enter the trade automatically when it is broken.
Entry on a retest.
A more conservative strategy is to wait until, after the breakout, the price returns to the broken level to test it and open a position on the bounce from it. This often provides a more favorable risk-to-reward ratio.
Using chart patterns.
Breakouts often occur after the formation of technical analysis patterns such as triangles, flags, and rectangles. These patterns indicate a narrowing range and an imminent exit from it.
The main risk is a false breakout. This is a situation when the price briefly moves beyond the level but then reverses and returns to the previous range. To minimize losses from such scenarios, the following are necessary:
- Strict risk management: using a stop-loss in every trade is a mandatory rule.
- Additional confirmation: volume analysis and the overall market context increase the reliability of the signal.
Breakout Targets breakout indicator by AlgoAlpha
The AlgoAlpha team (more than 66.6 thousand followers at the time of writing) published the Breakout Targets breakout indicator on February 5, 2026. During the first 24 hours after the presentation, more than 4.4 thousand traders visited the indicator page. And this is clear evidence of great interest in the script.
The Breakout Targets indicator is focused on finding consolidation zones (dynamic "boxes") and automatically projecting three TP levels plus SL on a breakout. It uses WMA/EMA to recognize compression, ATR to calculate the stop, and TP as risk multipliers.
Thus, it is useful for systematic profit and risk management.
Before we examine the indicator settings, I will simply show a few screenshots taken during the day. BTC chart from February 6, 2026, timeframe M3.
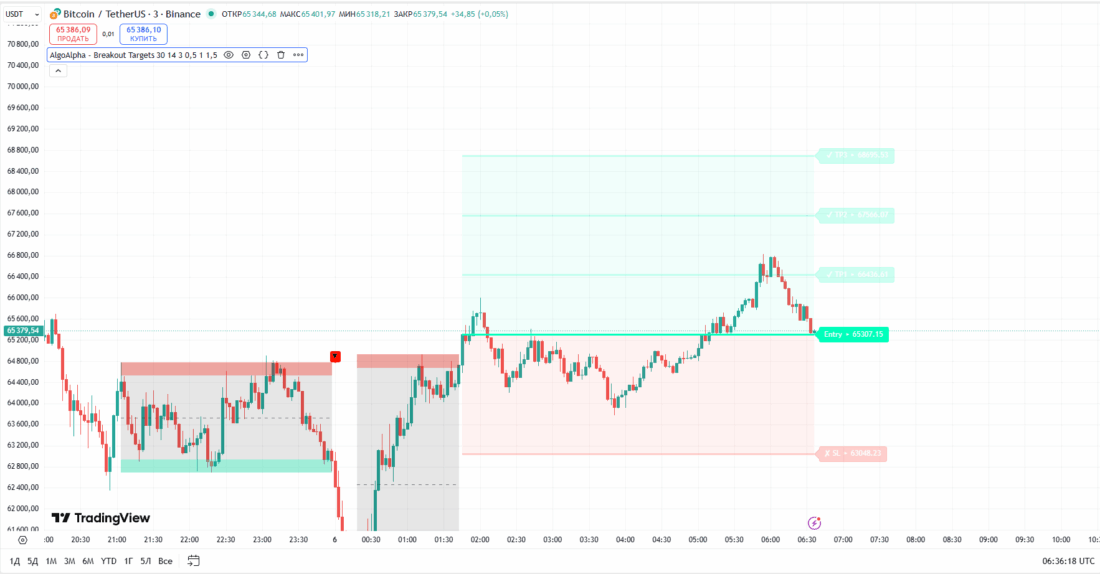
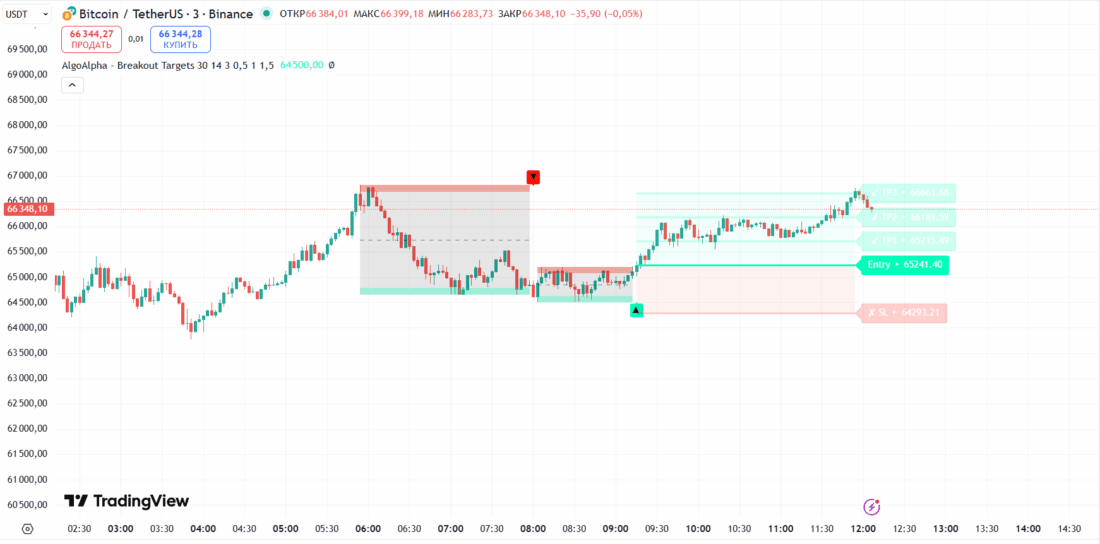
The difference in market situation is 6 hours. It is clear that the breakout ideas worked out quite well. At the same time, the indicator did not show a short breakout option, although it had started to draw a bearish box.
Now let us take a closer look at the indicator itself and its settings.
Range Detection Logic
Range detector.
Range detection occurs by comparing the weighted moving average (WMA) and the exponential moving average (EMA): when these MAs cross, the script looks for recent pivot points and draws a "box" (zone) between the pivot highs and lows.
Breakout confirmation.
A breakout is marked when the price closes outside the box, meaning the signals are based on the candle close, which reduces the likelihood of random false breakouts.
Breakout Trading Logic and Risk Management
The stop-loss is calculated through the average true range (ATR) - volatility provides the "risk distance." In turn, the three take-profit levels are calculated as multiples of the stop-loss range value (multipliers).
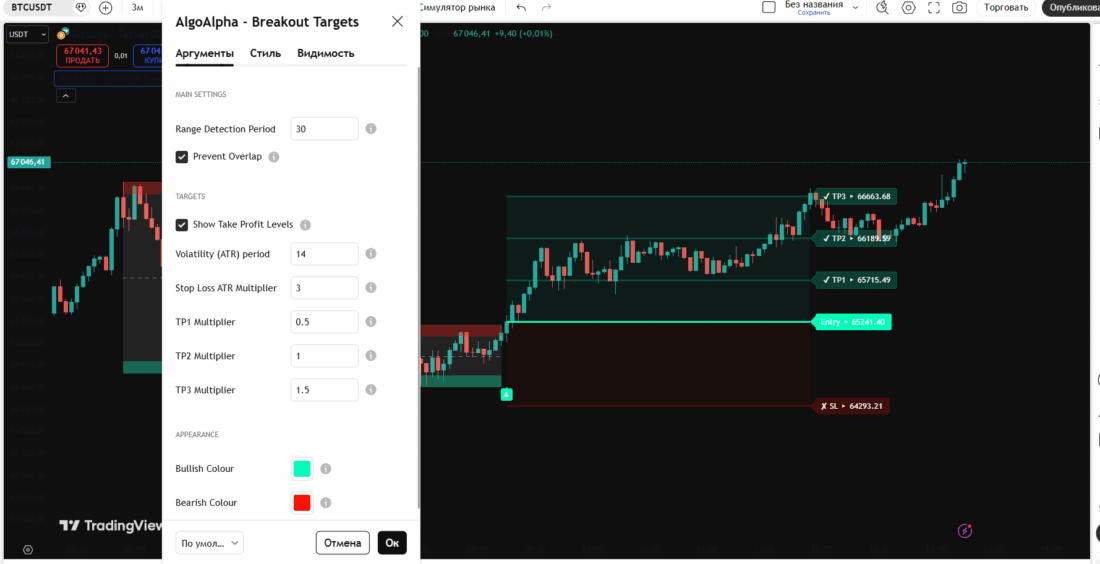
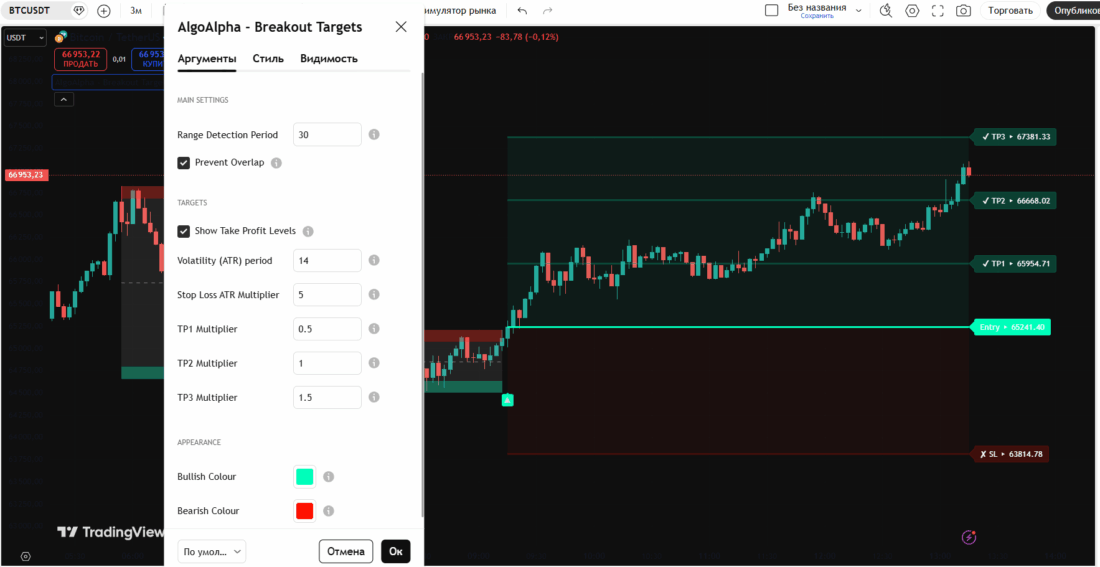
This is controlled by the Stop Loss ATR Multiplier parameter, which sets the ATR value for stop placement. The larger the multiplier, the wider the stop.
The charts below show Stop Loss ATR Multiplier 3 and 5. The difference in the risk/reward range levels is visible to the naked eye.
Visualization and Alerts
The indicator draws dynamic boxes (shaded boxes), breakout arrow markers (green/red), and horizontal Entry / SL / TP1-TP3 levels. There are built-in alert conditions for breakouts and target hits - useful for automating entries.
Key Settings
- Range Detection Period - sensitivity: higher means larger ranges, lower means smaller and more frequent ones.
- Stop Loss ATR Multiplier - the main risk parameter. You can change not only the multiplier itself, but also the TP levels relative to the multiplier.
- Prevent Overlap - does not draw a new box while the current one is still open, to avoid visual chaos.
In conclusion, I would note that the indicator is properly designed: it has a clear concept and logic (WMA/EMA -> box -> confirmed breakout -> ATR-SL -> TP-multiples), clear visualization, and alerts - very convenient for systematic use.
The Supertrend Breakout Boxes Breakout Indicator by ProjectSyndicate
The ProjectSyndicate development team (67.5 thousand subscribers) released the Supertrend Breakout Boxes breakout indicator on February 4, 2026. In the first two days, 4.4 thousand people viewed the indicator page.
Overall, Supertrend Breakout Boxes is a version of their Supertrend indicator adapted to search for consolidation zones and build "boxes" (box-zones) with automatic placement of BUY/SELL stop levels for entries.
According to the developers, the indicator is optimized for trading gold, but it also performs very well on Forex and cryptocurrencies.
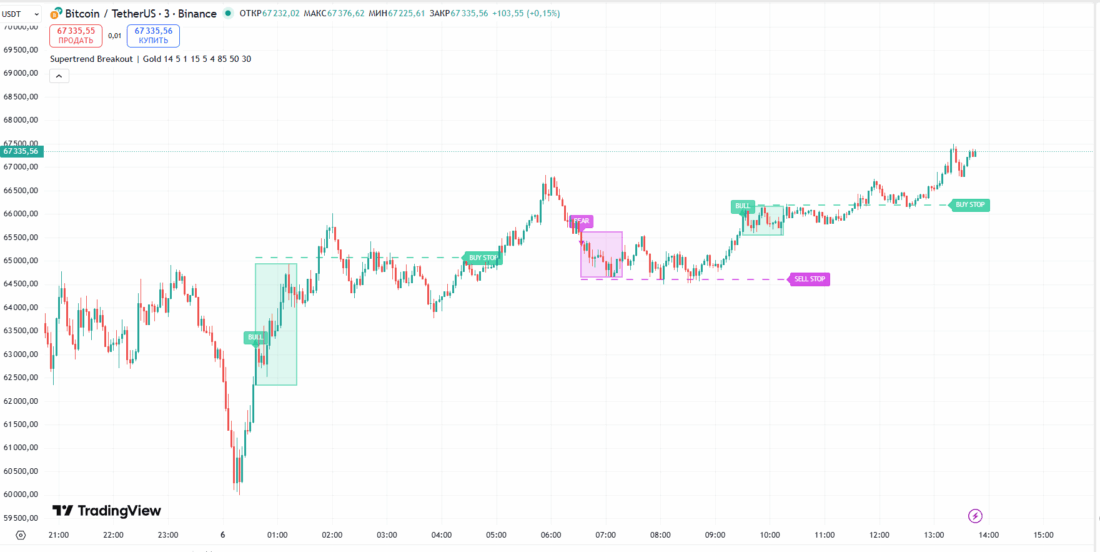
Before we examine the indicator itself and its settings, let us check what it shows on the same BTC chart that we analyzed above.
On the three-minute chart, the indicator marks consolidation and breakout zones a bit differently, but overall it is also quite good.
On M15, the indicator draws very nice boxes. And this is a strong argument in favor of studying the tool in detail.
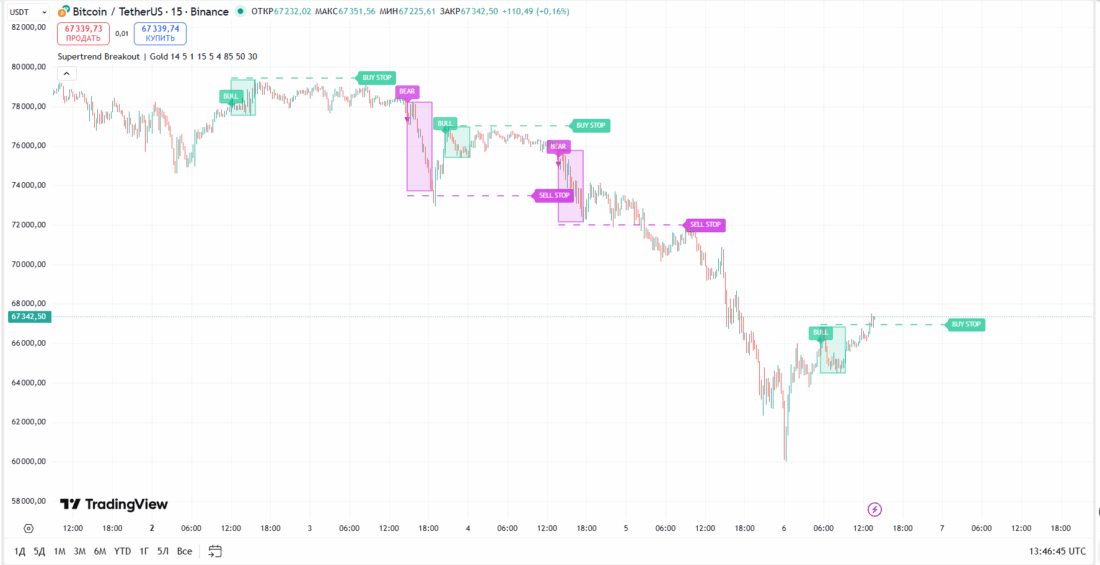
On the tool's page, the developers say almost nothing about how the indicator works, but they advise changing the ATR and multiplier settings.
Conclusion
The success of breakout trading depends not on the number of trades, but on competent risk management and discipline. And, of course, high-quality signals that make it possible to distinguish a true breakout from a false formation also play an important role.
Hundreds of indicator variations have been developed for breakout trading, but not all of them deserve attention. The Supertrend Breakout Boxes and Breakout Targets indicators discussed in the article, despite having been created only quite recently, are powerful tools that do a decent job of showing a range breakout.
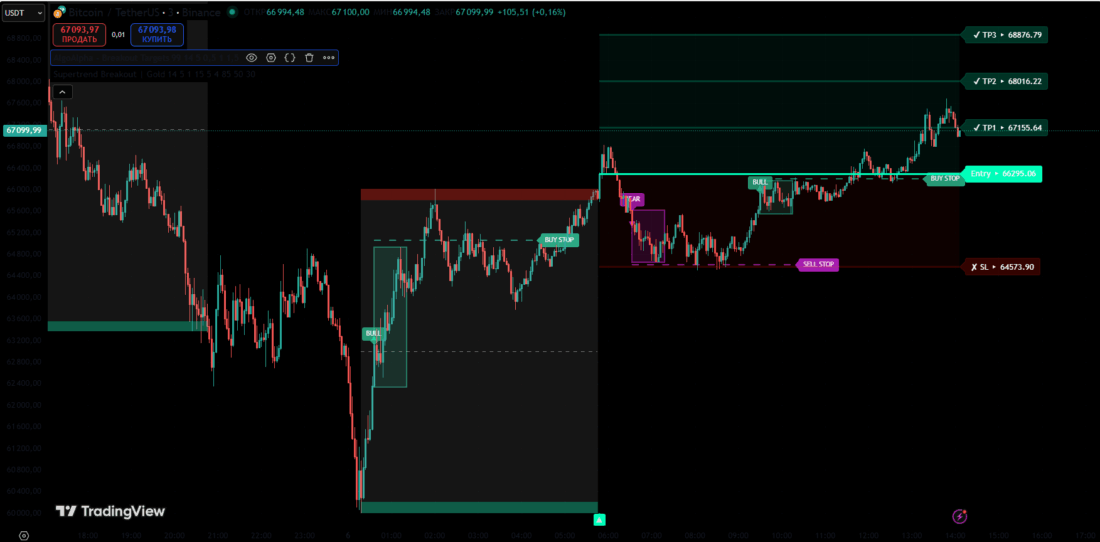
Using the indicators together on a chart will help produce signals that confirm and reinforce each other. It is only necessary to choose settings that satisfy the parameters of risk management.