Why FVG Imbalance (Fair Value Gap) Is Needed in Trading
In trading, an imbalance or disequilibrium (imbalance) is a situation when a strong skew arises in the market between buyers and sellers. Simply put, if there is an imbalance in the market, one side is pressing so strongly that price “flies through” a section of the chart with almost no opposing trades.
Very often in trading materials, alongside the term “imbalance” (or instead of it), people speak about FVG (Fair Value Gap), i.e. a “fair value gap.” At first glance it seems like another complicated concept, but that is not the case at all. In fact, the idea behind FVG is as old as the market: price always tends to return to where the balance of supply and demand was disrupted.
In this article, we will examine what FVG is, how it fundamentally differs from a classic gap, how to apply knowledge of imbalance in trading and, most importantly, how this same idea is implemented in different technical analysis systems, even if they never mention the terms FVG or imbalance.
What FVG (Imbalance) Is on a Chart
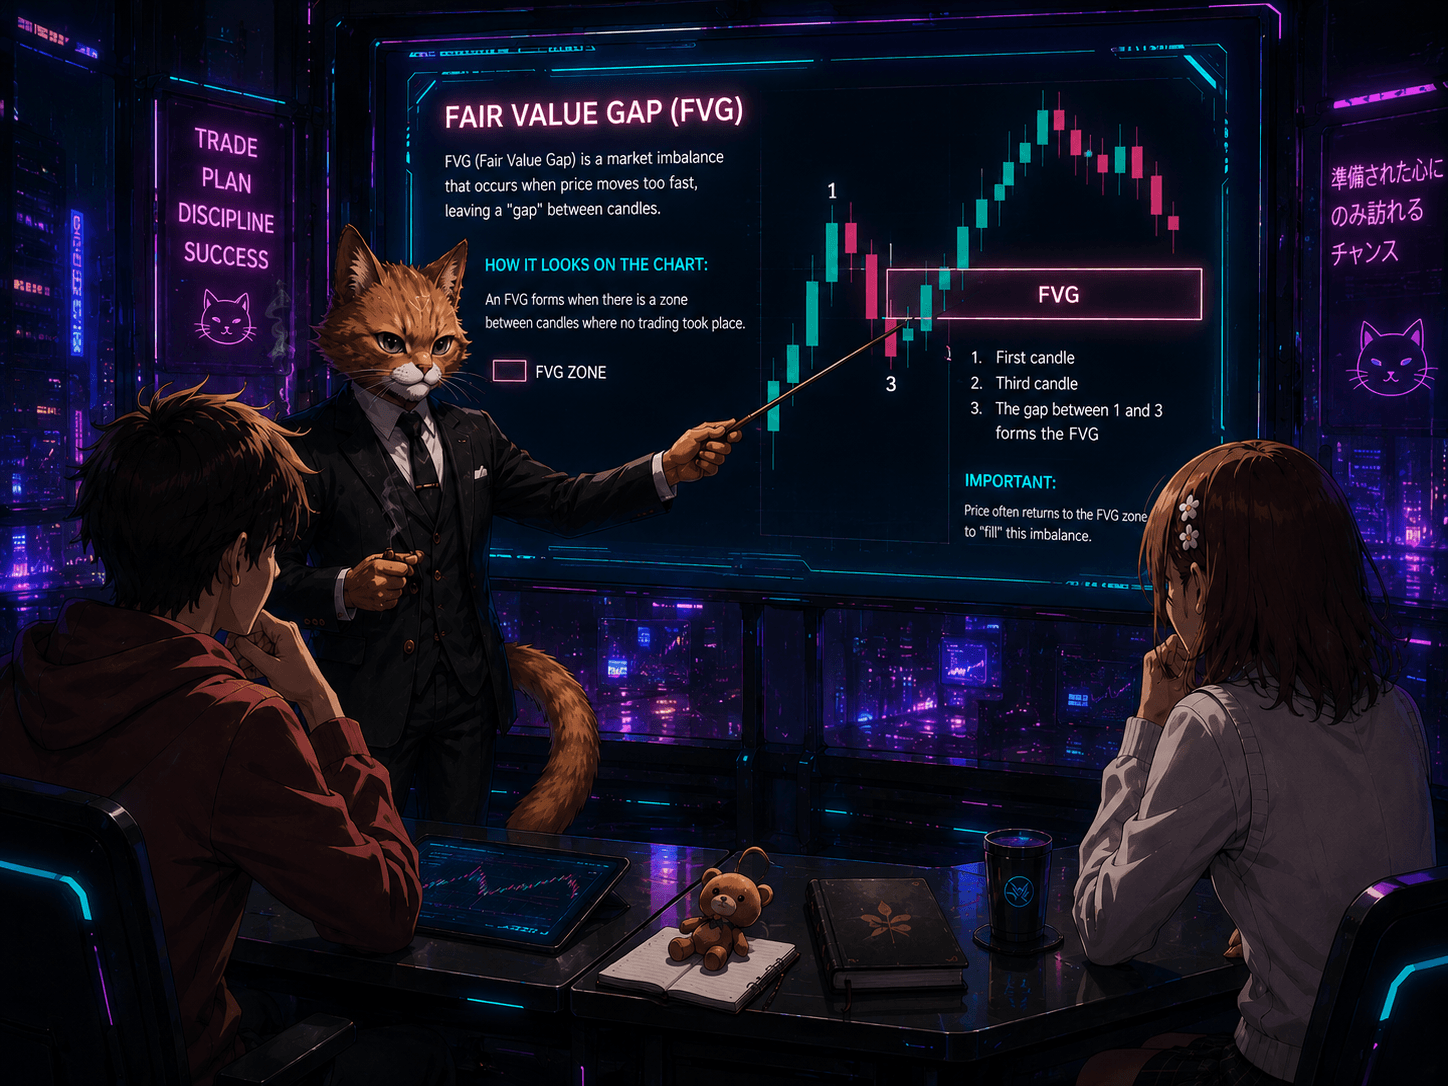
Fair Value Gap (FVG) is a price gap that forms within three consecutive candles and reflects an aggressive, unbalanced price movement.
The standard definition of FVG is built on three candles.
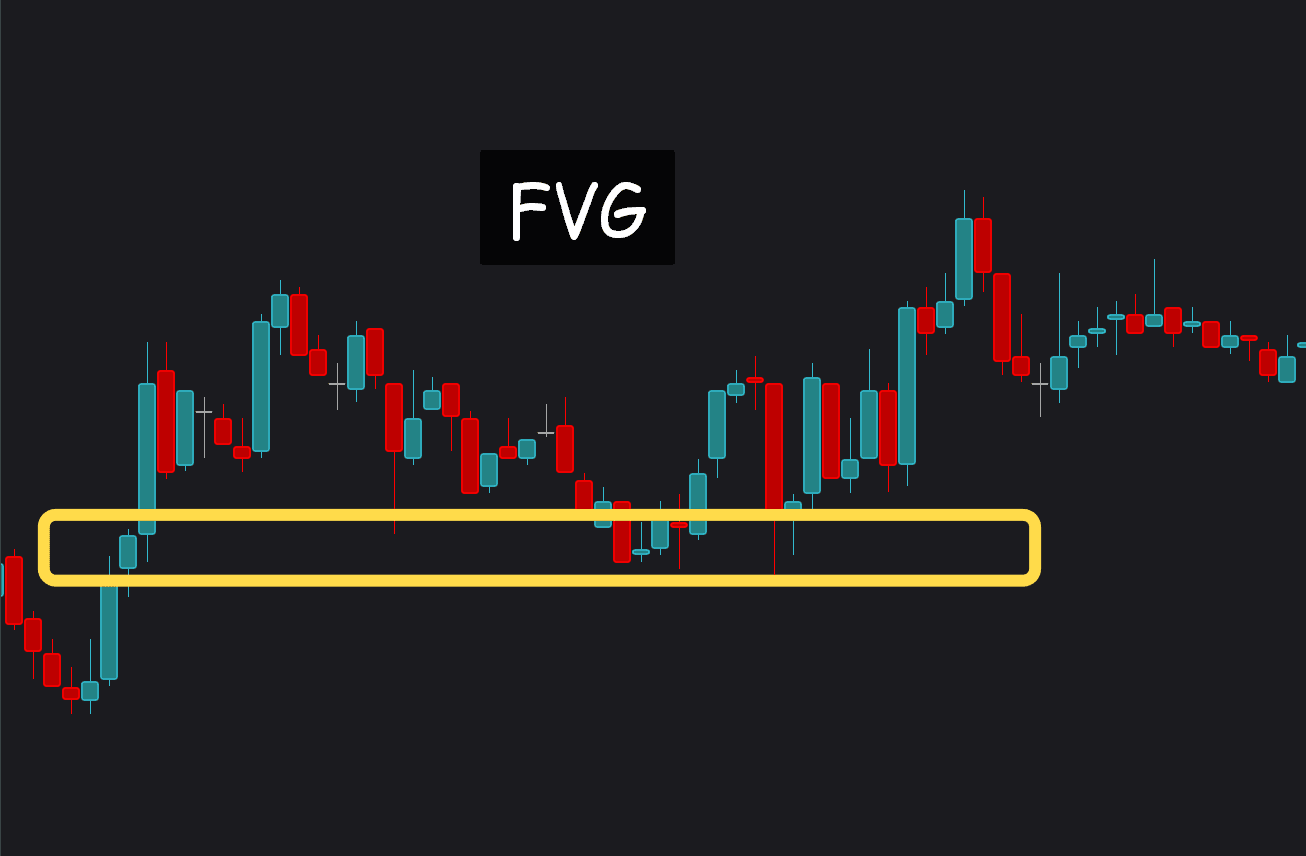
An FVG appears when the low of candle 3 is above the high of candle 1. The zone between the high of the first candle and the low of the third is the fair value gap — a price area that the market passed through too quickly, without balancing supply and demand. On a chart, this zone is often shaded with a rectangle.
In the bearish version, everything is mirrored: the high of candle 3 is below the low of candle 1 — the zone between them will be a bearish FVG.
Why is this called a “disequilibrium” (imbalance)? Because in this area one side of the market (buyers or sellers) was so aggressive that it met virtually no resistance. The market did not fully “trade through” these prices and did not find an equilibrium value there. And since the market is a constant search for fair price, it will tend to return and fill this inefficiency.
Why Price Returns to FVG: The Logic of Rebalancing
The market strives for efficiency — this is an axiom. If there was not enough trading volume at some price to establish a fair balance, then that price becomes a magnet for future movement. Large players (Smart Money) know that it is precisely in imbalance zones that pending orders, stop losses, and liquidity accumulate, which are needed to build a position or close it.
A return to FVG is, in essence, the process of filling an inefficiency (rebalancing). When price returns to this zone and participants trade through the imbalance, opposing orders meet, volume is formed, and only after that can the market continue moving in the original direction. For a trader, this pullback provides an entry point with clear risk.
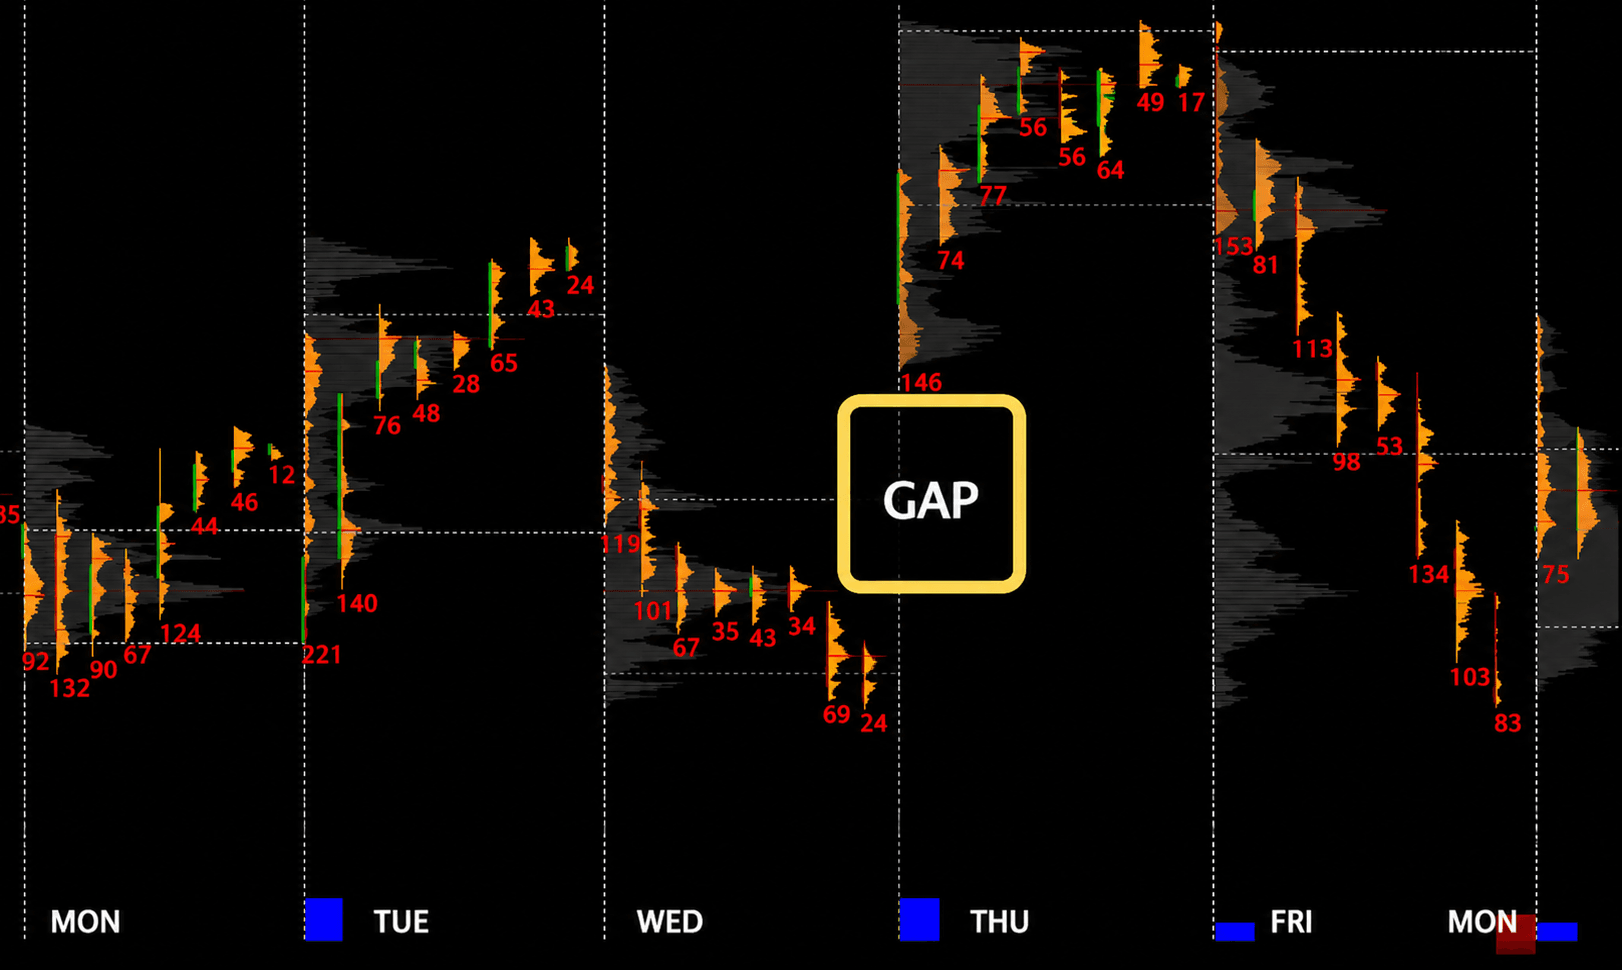
Now let’s look at this same chart, only through the lens of volume clusters.
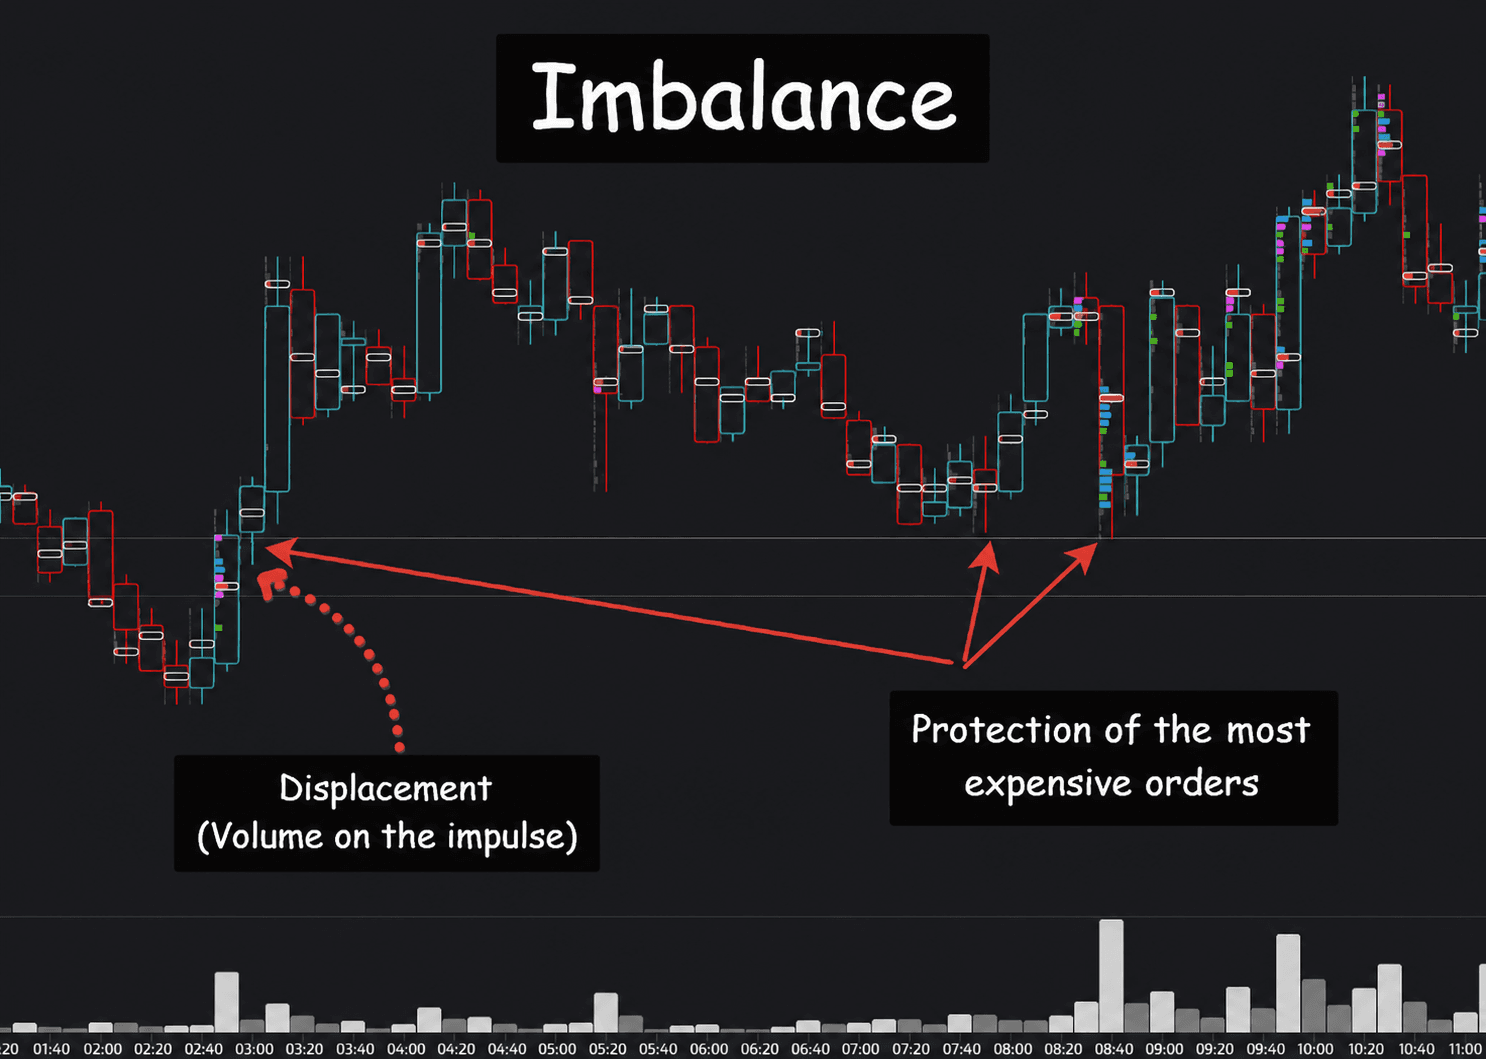
On the first volume impulse, we see growth in both vertical and horizontal volumes. The most expensive purchases act as support.
We see that volumes actually go above the last filtered clusters: they touch them only with “tails,” while there is no real trading, i.e. the last purchases became a support zone.
The Difference Between FVG Imbalance and a Regular Gap
Beginners often confuse FVG with a gap, but they are different things. Let’s examine the difference between imbalance and a classic gap in more detail.
A classic gap is a break between the closing price of the previous period and the opening price of the next one. Usually gaps are clearly visible on daily or weekly charts: a stock closed yesterday at 100 and opened today at 105 because of news. A gap is empty space on the price scale where there were no trades at all.
FVG, however, is found inside a continuous flow of candles on any timeframe. It does not require a trading halt or a session change. It is a three-candle structure where the gap exists between the wicks of the first and third candles, but the second candle can partially or completely close this gap with its own wick (unlike a classic gap, where the break yawns between adjacent bars).
For an FVG imbalance, what matters is not isolation from the neighboring candle, but precisely the absence of overlap between the 1st and 3rd from the viewpoint of candlestick analysis, and the presence of volume on the push-through from the viewpoint of objective market structure.
This leads to a simple conclusion: a classic gap is a special type of imbalance. This is especially noticeable in futures markets. For example, futures on U.S. indices during the RTH session (regular trading hours, i.e. from 8:30 to 15:15 CT — Central Time in the North American time zone).
There is a break between sessions (a gap), and this is often a signal that the impulse will continue. But within round-the-clock trading there was no break, while there was an FVG (if assessed from the standpoint of overall liquidity).
Thus, FVG is a more general concept of "price inefficiency" that runs through a chart of any scale.
FVG Imbalance in Different Technical Analysis Systems
Imbalance (FVG) is an objective reality, since it is a zone where, for example, buyers completely defeated sellers. Naturally, not all systems operate with objective data on trading volumes, but all describe imbalances specifically as the strongest formations. At the same time, each school of technical analysis calls this in its own way.
Gap Theory
The direct predecessor. Classic technical analysis says: "Gaps tend to close." Whether it is a session-opening gap, a breakaway gap, or an exhaustion gap, price almost always returns to its level. An FVG is the same "intraday gap" that likewise tends to be filled, because the market does not tolerate voids.
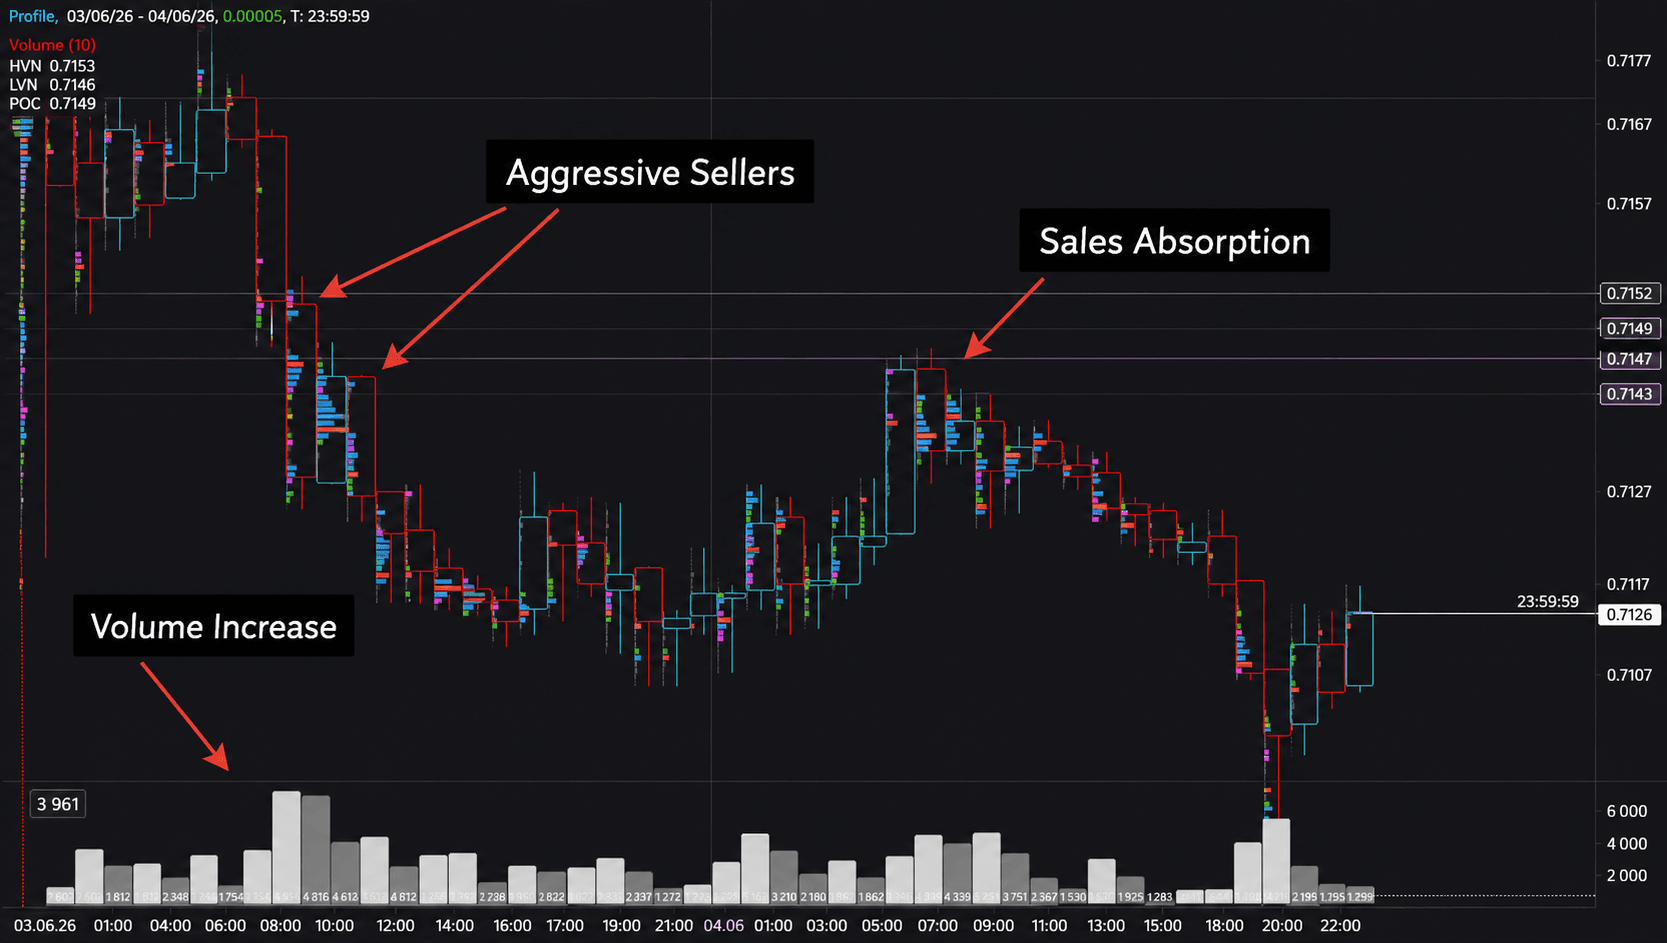
VSA (Volume Spread Analysis)
VSA teaches that a wide spread on rising volume without resistance indicates a strong imbalance in favor of buyers. However, after such an impulse, a zone of "inefficient movement" forms.
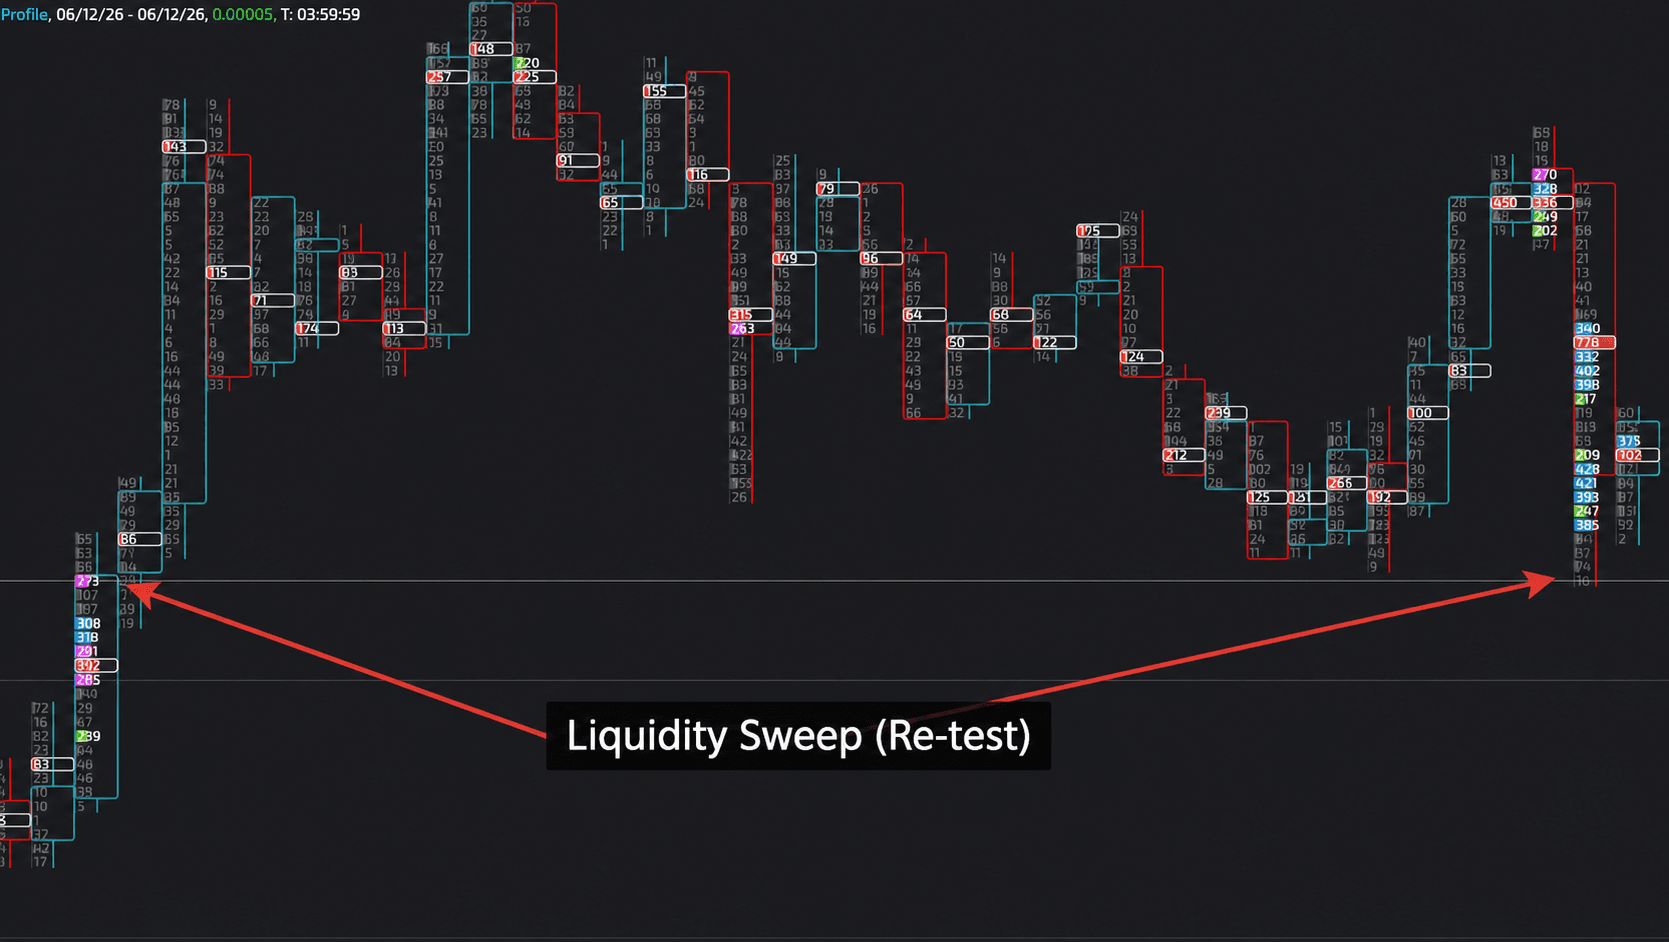
The Wyckoff method assumes that after an impulse, price often tests this zone to determine whether the market is ready to move further. This return to the area of the impulse bar, where "there was volume, but there was no trading balance," is the FVG retest described in the language of VSA.
Elliott Waves and Fibonacci Corrections
In classic wave analysis, an impulse wave is always followed by a corrective one. The correction almost always returns to 38-62% of the impulse length, that is, directly into the zone of the fastest movement, where the imbalance was being formed.
As a rule, FVG is located precisely between the 0.5 and 0.618 Fibonacci retracement levels, giving a logical explanation of why these exact levels work: there is an untraded zone there that requires rebalancing.
Price Action and Support/Resistance Levels
The "breakout and retest" pattern is the bread and butter of a price action trader. When price breaks through a level and then returns to it, it is essentially stress-testing the zone where an imbalance recently appeared.
Often this return falls specifically on the area of the price gap (that same FVG) that formed during the breakout; the trader simply marks it not with a rectangle, but with a horizontal level. Swing traders who trade pullbacks to "supply and demand zones" (Supply & Demand) actually use the same FVG logic, only calling these zones the "proximal" and "distal" candle lines.
Japanese Candlesticks
Long marubozu (candles without shadows) are graphical evidence of a powerful imbalance. Between the open of such a candle and the close of the previous one, a gap often remains, which is then filled.
The three-candle combination "Three White Soldiers" or "Three Black Crows" is a classic pattern within which there is almost always an FVG, predicting a further pullback to the middle of the pattern before the trend continues.
Order Flow and the Tape
Traders who read the order book and the tape call an imbalance "imba" (from imbalance), a situation when, at a specific price level, aggressive market orders completely absorb passive liquidity, leaving a "hole" in the order book. A subsequent return to this price for retesting is routine practice for scalpers. FVG on the chart is a visual reflection of that very "hole" from the order book.
How to Apply FVG in Trading: A Practical Scheme
Step 1. Finding FVG on the Chart
Open the chart of any liquid asset (timeframe no lower than M5, although professionals may start with M1 and even with a tick chart). Look for a sharp impulse move consisting of two or three long candles. If the shadow of the third candle does not overlap the shadow of the first (as described above), you have an FVG. Mark this zone with a rectangle. In a bearish market, look for gaps during declines.
To simplify this task, we recommend using the tool "Fair Value Gap Indicator". It lets you quickly find interesting moments on currency pairs and metals, so you can then study the context in more detail and make a decision.
If you are interested only in "weekend" gaps, then we recommend using the tool "Weekend Gap Detector".
Step 2. Context
An FVG imbalance by itself is not a signal. Its strength depends on the context.
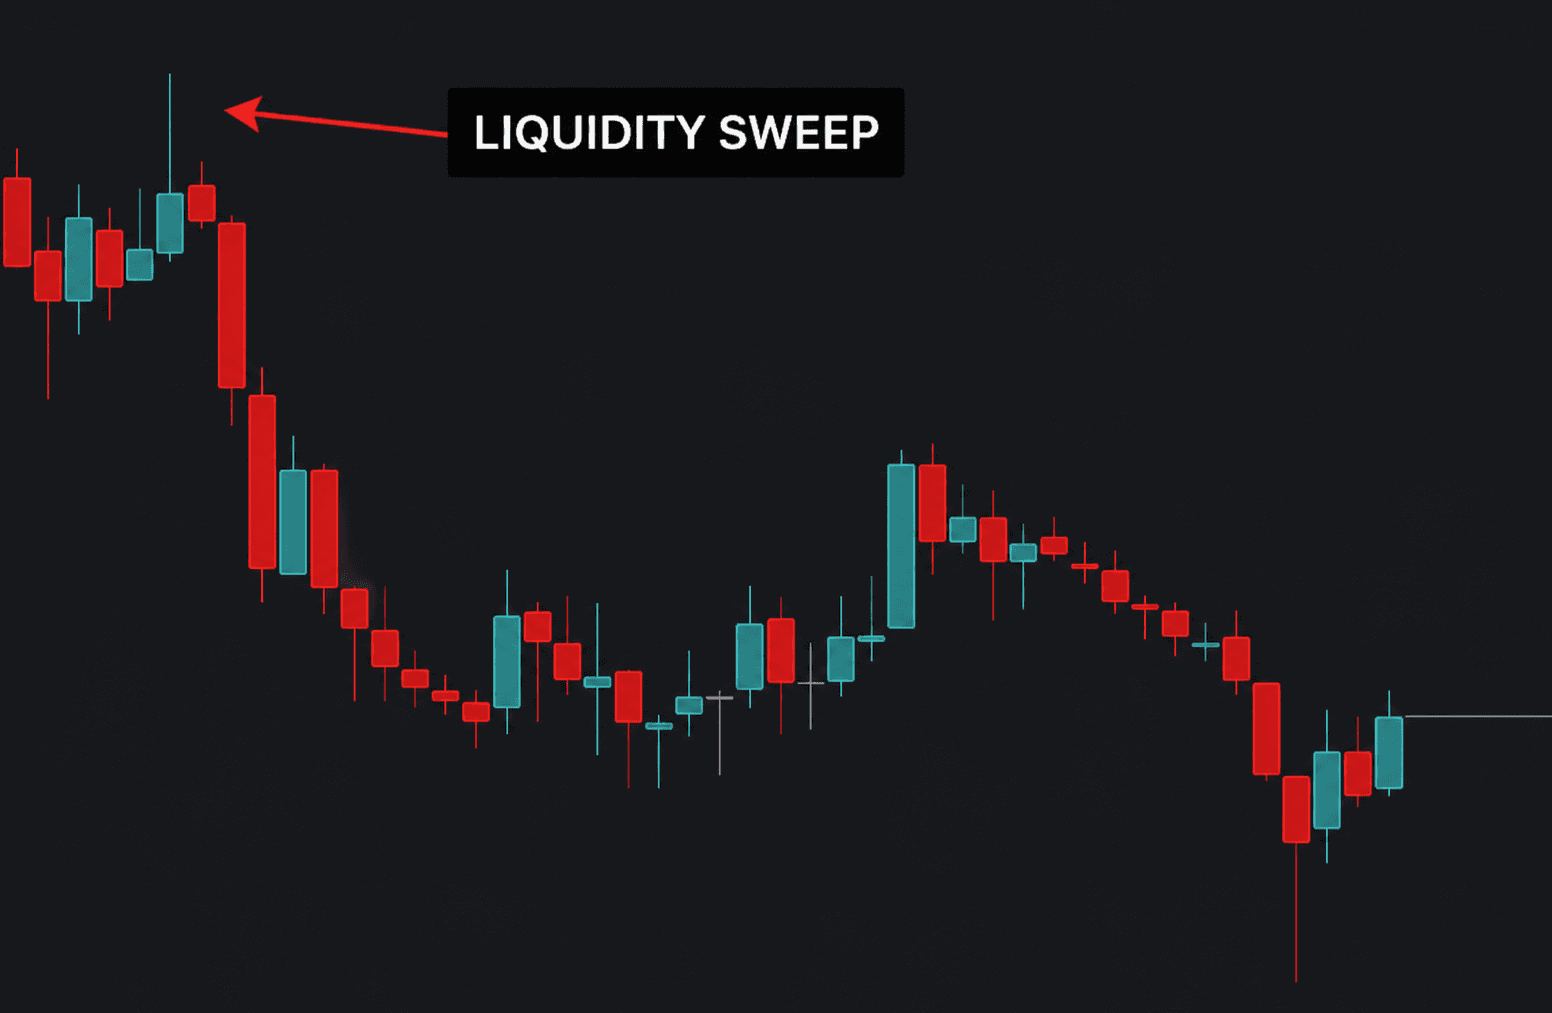
An FVG formed after liquidity has been taken (for example, after a false breakout of the previous high/low) carries more weight.
An FVG on a higher timeframe (H1-H4) is stronger than on minute charts.
The larger the volume on the candles that created the imbalance, the more significant the zone is.
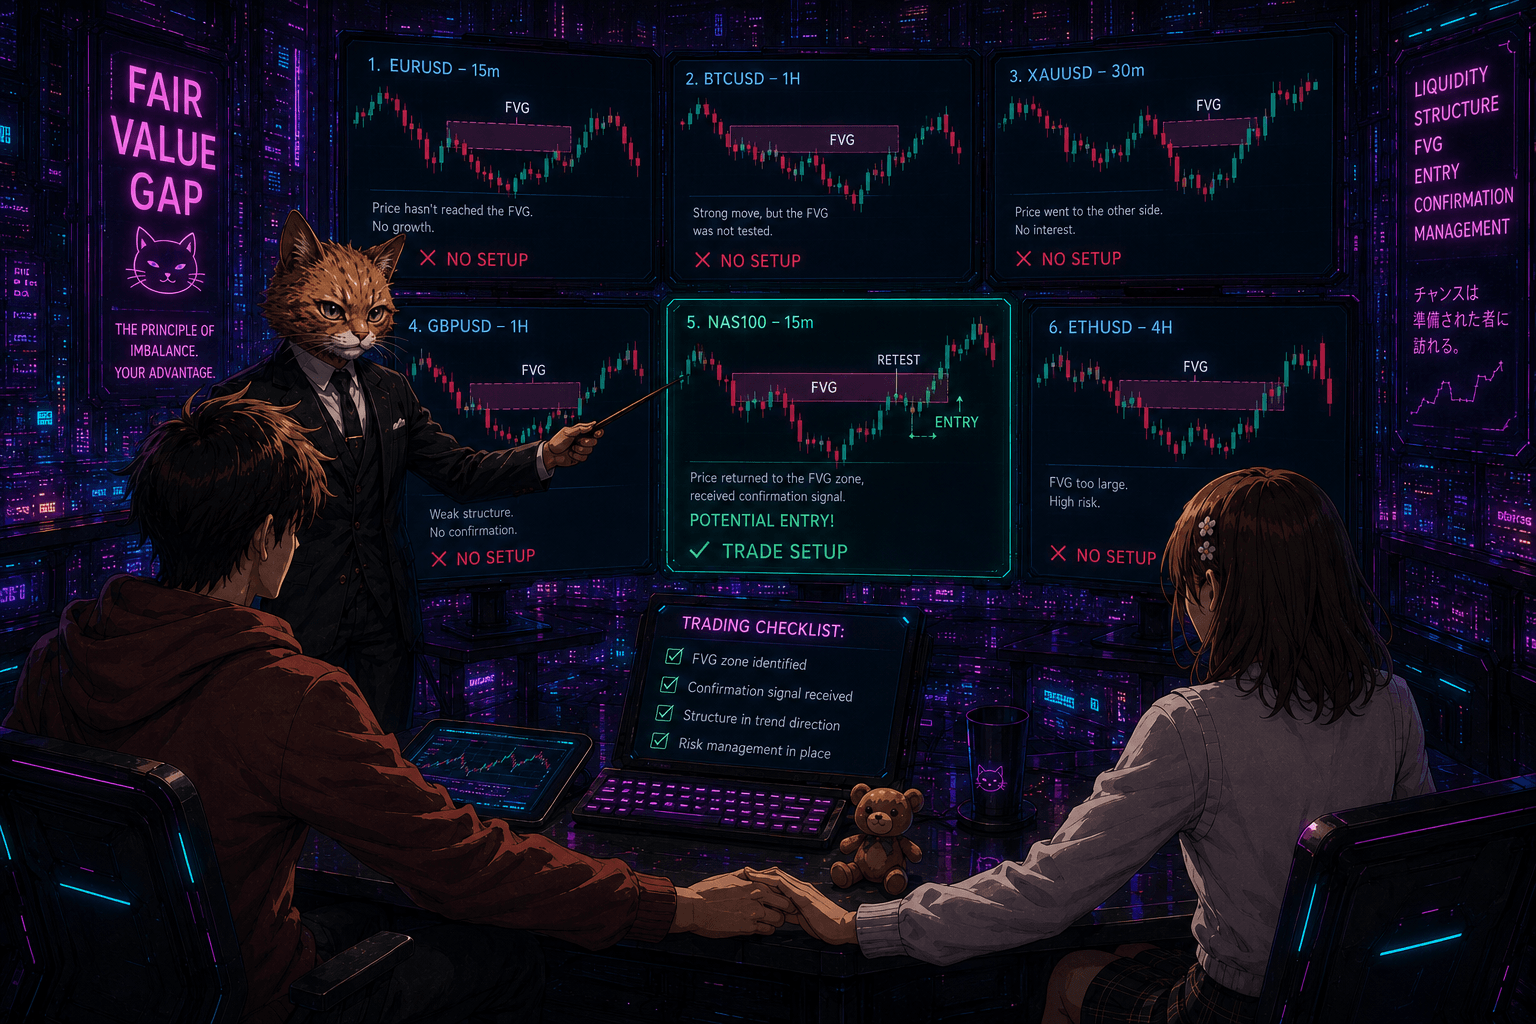
Step 3. Entering a Position
Wait for the price to return to the FVG zone. The ideal scenario is when price touches the middle or edge of the zone and forms a reversal pattern (pin bar, engulfing). An entry can be made:
Aggressively: with a limit order inside the FVG zone.
Conservatively: after a confirming signal on a lower timeframe (for example, a structure shift on M1-M5 during an FVG retest on M15).
Step 4. Stop Loss and Take Profit
The stop loss is usually placed outside the FVG, slightly below the low (for a bullish FVG) of the candle from which the impulse began, or beyond a local extreme.
Take profit is the nearest opposite liquidity zone (equal highs/lows), the next FVG, or a strong order block. The risk/reward ratio should be at least 1:2.
Common Traps of FVG Imbalance
Not every FVG plays out. If price broke through the zone and consolidated beyond it, the imbalance is "broken," and it is no longer worth looking for an entry at that moment. At the same time, you need to stay alert, because if the imbalance occurred inside a balance and the "break" of the impulse did not lead to the development of a reverse move, then you can expect movement in the original direction after additional liquidity is collected.
A single FVG without support from market structure (trend) often turns into a trap for buyers/sellers, i.e. it is a reversal signal. A good signal here: after an imbalance in one direction, we see either a sharp imbalance in the opposite direction, or, after a smooth pullback and a mild breakout of a potential entry zone with its test, an imbalance in the opposite direction.