
Supply and Demand Levels on the Chart
 Hello, forex trader friends!
Surely, all of you have more than once seen how price, barely touching a support/resistance level, immediately bounced off with tremendous speed and rushed away. What was that? Most likely you saw the work of a supply/demand zone. Today we will touch on this aspect of Price Action trading. We will examine what supply and demand levels are, how to find them on the chart, how they work, and, of course, how we can benefit from this knowledge.
What Are Supply and Demand Levels?

If we convey the main idea of working with supply and demand levels in one sentence, then it would be: "buy at the bottom, and sell at the top."
Before we move on to the chart, let us first sort out the theoretical part for a better understanding of the subject.
Let us imagine that you are trading tomatoes at a market. The price of tomatoes at the moment is 30 rubles per kilogram. Other sellers set about the same price. At this price, tomatoes are bought actively and nobody has anything left. Let us imagine that some sellers decide to raise the price and put tomatoes out at 35 rubles. The others look at them and in exactly the same way begin selling at 35 rubles. Buyers continue buying them, but a little less actively. But all the same, in the end, all the tomatoes are sold out.
The next day, having looked at this, some sellers decide that they can also sell at 40 rubles. Why not? People will buy anyway. All the others repeat after them and put 40 rubles. Buyers begin to be less active, half the tomatoes are sold out. But overall the price remains profitable for the sellers.
The next day, a very greedy seller decides to set the price even higher and starts selling tomatoes at 45 rubles. The others look at him and think: "why are we any worse?" And everyone sets the price at 45 rubles. But people stop buying. It gets to the point that they begin to protest. "Have you completely lost it, selling tomatoes at 45 rubles! We are boycotting you and will not buy tomatoes at all!"
The sellers then decide to lower the price to 40. People still continue the boycott and do not buy them. The price rapidly falls to 35 rubles, but people still refuse to go buy them. And in the end the price returns to 30 rubles. People are pleased, say that this is acceptable, everything is as before. They are ready to buy again.
In this example, we have a level from which purchases go well. This is 30 rubles. The price started upward from it, went to 45 rubles and quickly dropped back to 30.
The 30-ruble level is a demand level, at which demand is active, that is, good buying takes place. And the price of 45 rubles acts as a supply level, at which a huge number of people willing to sell tomatoes has accumulated. But there are no buyers there and therefore the price decreases very quickly.
I want to clarify right away that the example I have just told you was exaggerated. And at the 45-ruble level, someone will still buy tomatoes anyway.
As a result, it turns out that the price of 30 rubles was a demand level, and the price of 45 rubles was a supply level.
Looking at this example, we can pay attention to the imbalance that arises when prices rise and receive the strongest push.
This happened at the 30-ruble level, when we have huge demand and supply is lacking, because all the tomatoes are sold out. Therefore, the price rises upward very quickly.
And exactly the same thing happens at the price level of 45 rubles, when we have a lot of supply, but demand is practically absent. Therefore, the price moves downward.
Thus, we can conclude: "When price moves downward, we observe more supply than demand. And when it goes upward, we observe more demand than supply."
Because of the imbalance of supply and demand, price either rises or falls. This is what working with supply and demand levels is based on.
Now let us move on to the chart and look at this process by example.
How Do We Determine Supply and Demand Levels on the Chart?

In order to find supply, we will look at the peaks of price movement, and in order to find demand, we will look at the troughs.
We need to mark peaks and troughs with fast and strong price movements. Fast growth for demand and decline for supply. The less time price spent at the level, the better for us.
First of all, as when marking support and resistance levels, you need to look at the highs and lows on the current chart:
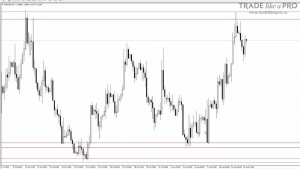
Note that the area nearest to the current price has been tested several times. And the lower one has not yet been tested. It was touched by price only once, and therefore this area is stronger than the one that has already been tested.
At the marked levels, we observe that price spent only a short time there. It almost immediately reversed and moved downward with large candles. An important factor here is the time that price did not spend at the level. The less time price spent at the level, the more significant this level is. And it is worth remembering the size of the candles. The larger these candles are, the stronger the reaction.
In addition, supply and demand levels become mirror levels. Exactly like support and resistance.
If we pay attention to the last highlighted area, we can see that at first there was supply there, and then a strong breakout:
Price overcame the supply, absorbed its remnants, and rose higher.
And now this area has become a demand zone:
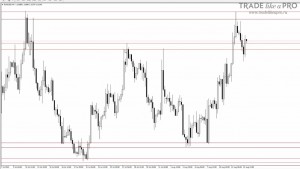
As you can notice, there was a quick rebound from it here.
For this situation on the chart, I would not mark any more levels. Because they should be visible and understandable to everyone with the naked eye.
Our task is to determine demand at the troughs, and supply at the peaks.
We find strong and fast price movements on the chart. Rises for demand and declines for supply. These should be large candles and price should not crowd in one place for too long. There should not be long consolidation. The less time price spends at the level, the better.
In addition, pay attention to round levels. Such as 1,100; 1,500; 1,300 and so on...
Do not scroll the chart far back, because what happened on it earlier is not so important for the supply and demand levels methodology. After all, these are not support and resistance levels, but a somewhat different topic.
And once again I want to repeat to you that the most important thing is that these levels should be noticeable not only to you, but also to other players. So that they will trade them.
What Happens at These Levels and Why Do They Work?

At these demand levels, large players place limit orders to buy, and at supply levels they place sell orders. Why does this happen? Because at these levels it is easier for large players to execute an order by collecting the positions of smaller players.
Every time price reaches a supply area, the sell orders of large players are executed. They absorb the buy orders that other players open, and with their help execute their own sell orders.
When the buy orders run out, price falls again. When it rises again to this same level, many sell orders of large players are once again executed with the help of the stops and buy orders of smaller traders.
When the opposing orders run out, price falls again.
The thing is that a large position cannot be opened just like that without a significant price change. Therefore, large players, banks, and market makers have to be cunning and set a kind of trap for other traders in order to open larger positions at their expense.
We discuss this in more detail in the course on the VSA methodology.
Now let's look at this supply area:
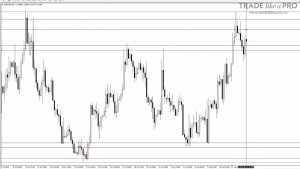
It was a supply level, but a large number of sell orders from major players were filled on it twice. The third time, as you can see, there were no major players left, and therefore the price decided to break through this level and moved higher.
From this we conclude that supply has the property of running out, exactly the same as demand. As soon as it ran out, nothing prevents the price from breaking through this level and moving farther.
Therefore, it is considered that for profitable trading, supply and demand levels are suitable only the first time, when the price has just touched the level. After that, we can sell or buy on the retest of the level. But when the price returns to it again (for the third time), it is no longer worth going in there, since a breakout is quite likely.
I should note that a higher candle high does not always mean that a new supply area has been created. And a lower low does not indicate that a new demand area has been created. It may simply be a spike, a trace left by the execution of a large number of orders.
In this trading, it is worth paying attention to the higher time frames. If you trade on H4, then keep an eye on the daily and weekly charts. So that your H4 buy does not run into a supply area on the weekly charts.
Use several time frames in your trading and do not forget to look at the level above. That is all from me. We will talk in more detail about how to make entries and exits when trading using supply and demand levels in the following lessons.
Best regards, Pavel Vlasov
TradeLikeaPro.ru