
All the Secrets of Price Action Patterns
 Hello everyone!
Many traders use the Price Action methodology, but do so "by intuition." Since the technique is highly variable, there is a certain advantage in that - the opportunity to develop your own style - but there is also a downside: the absence of rigid rules creates opportunities for self-sabotage and fundamentally incorrect trading with what seems to be a profitable methodology. Today we will try to fix that.
Recently I had the need to comprehensively study the behavior of Price Action patterns, find out how it is still best to trade one setup or another, determine the trading efficiency of each and the change in efficiency depending on the filters used. In other words, I needed to test all the ways of trading each pattern, how best to trade them - with the trend or against it, with pending orders or market orders, what risk-to-reward ratios are best, whether the patterns should be located at a level, what can serve as reliable support and what cannot, and so on.
Agree, such information would be very useful for everyone who uses candlestick patterns in their trading. Since I needed to collect the statistics anyway, I decided to present my findings in the form of an article and share the information with you.
Research Methodology

I will sequentially test each of the following patterns:
All of these patterns are quite widespread. In general, all Price Action patterns originally come from the Japanese culture of candlestick chart analysis; only the names differ, and sometimes the approaches themselves differ slightly. Therefore, I will give a brief description of the Price Action pattern and the name of its analogue in the Japanese version.
We will conduct the tests on the H1, H4, and D1 periods. We will take the testing period from 2000 to the present day. We will use the following currency pairs: USDCHF, GBPUSD, EURUSD, USDJPY, USDCAD, AUDUSD. These are the main instruments, the most widely traded. If we took all currency pairs for the tests, our research would stretch out for a month - for one pattern alone, with the current set, we would have to conduct more than 500 tests. Speaking of them.

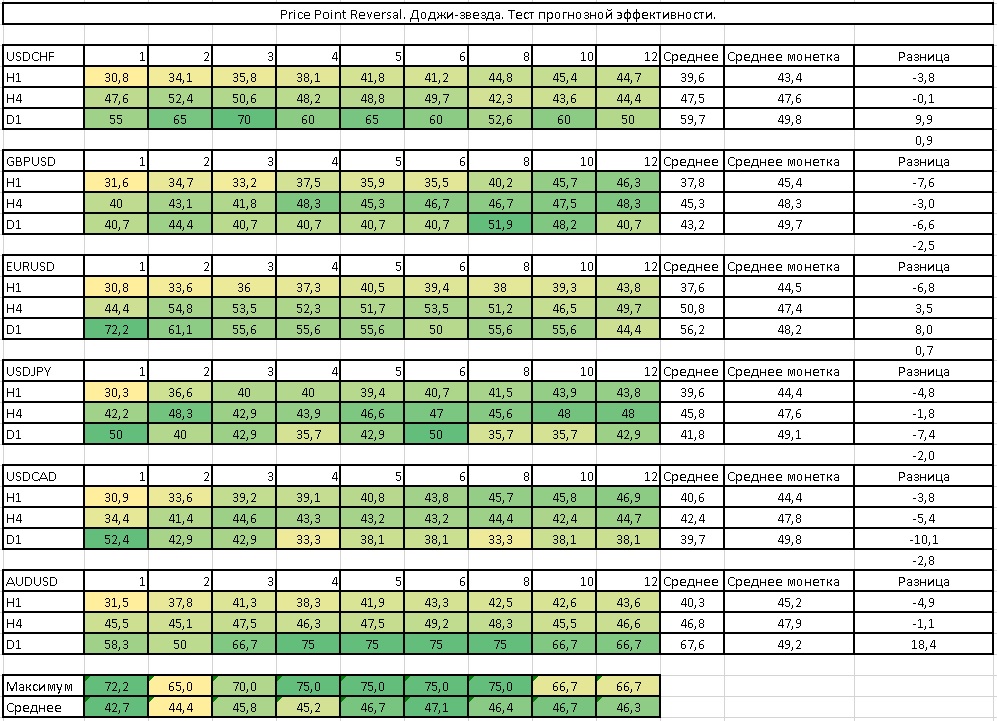
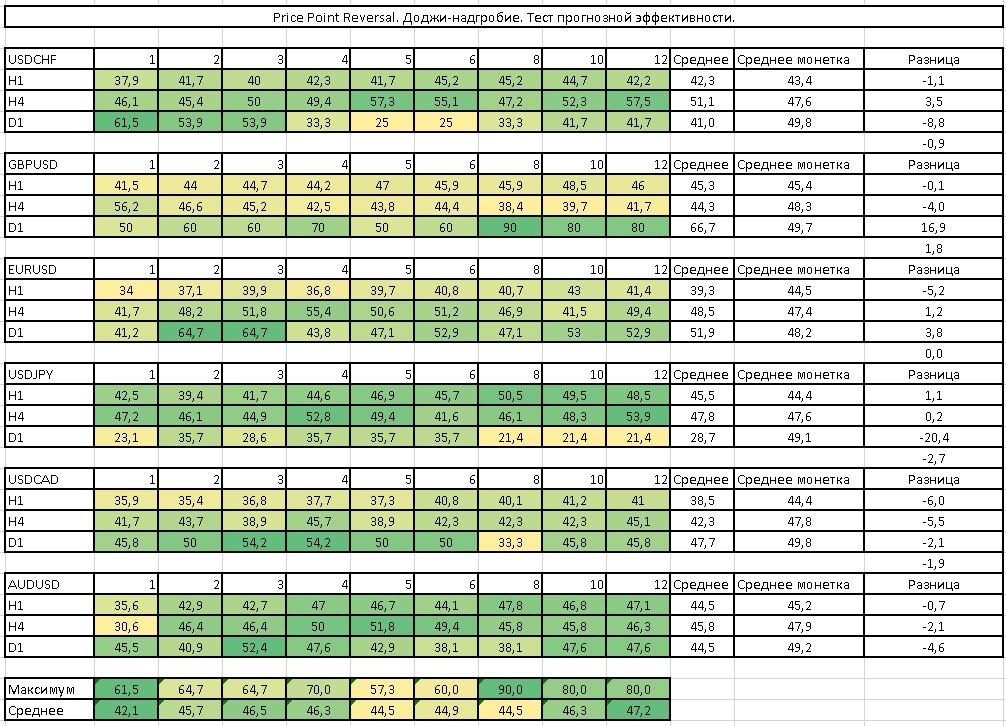
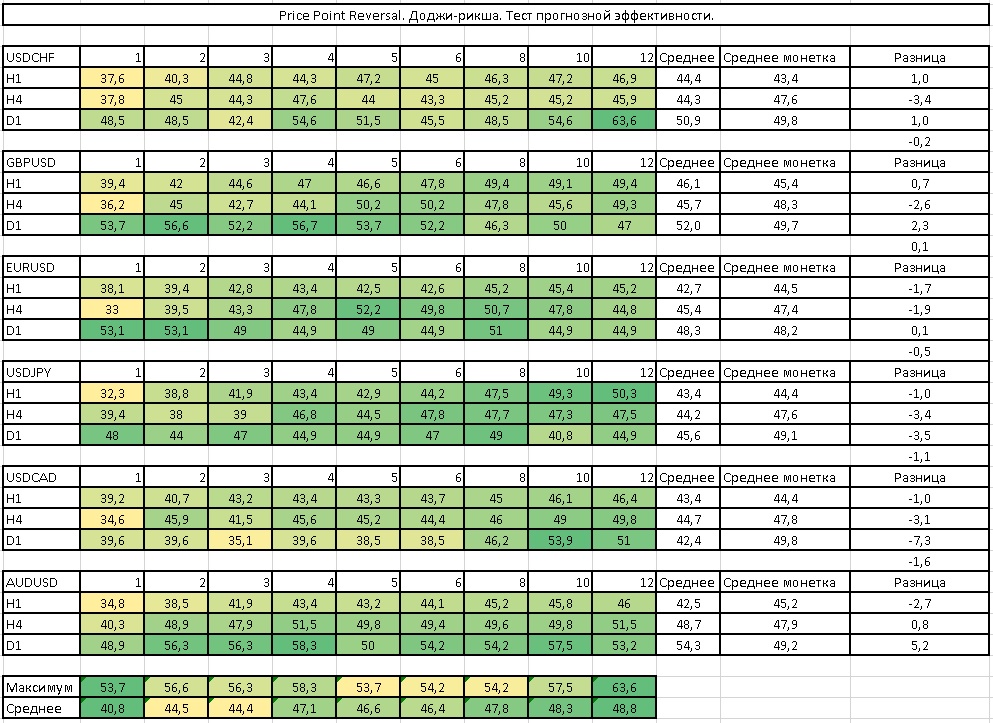
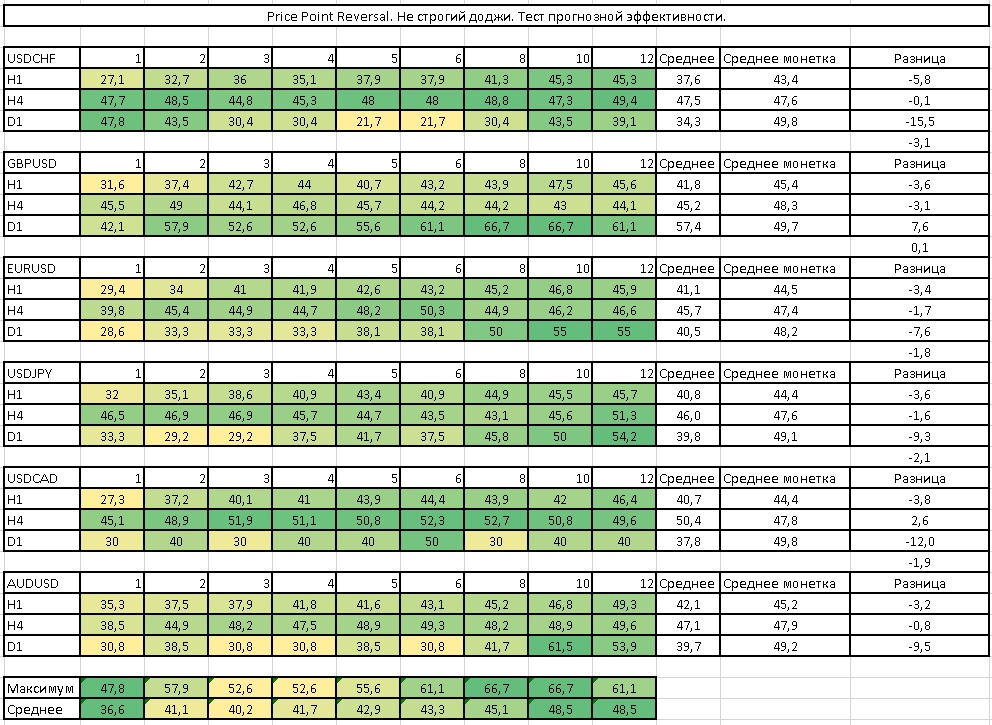
The first test we will perform to study the predictive ability of the pattern. Here, without setting stops and takes, when a pattern appears we will enter a trade and exit it after a strictly fixed number of candles from the opening of the trade - 1, 2, 3, 4, 5, 6, 8, 10, and 12. We will compare the result with the result obtained by flipping a coin. At the same time, we will compare the number of profitable trades, that is, in how many cases the forecast proved correct. It does not matter how far price moved away from the entry point. Thus we will measure the predictive ability of the pattern itself regardless of the system of entries, exits, money management, and position management - pure efficiency compared with completely random entries from coin flips. Let us call it the predictive efficiency test. When conducting this particular test, we will also test various recommendations and rules that strengthen or weaken the pattern. Each results table is for its own pair. The columns mean closes after a certain candle, the rows mean periods. The table contains percentages of profitable trades.
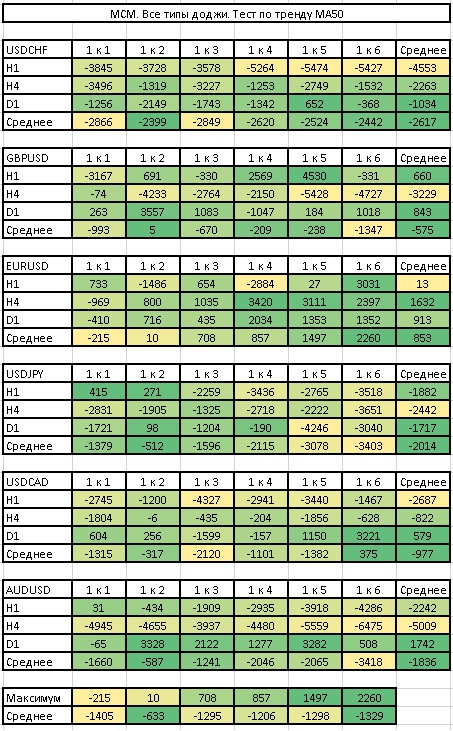
The second test is to determine the best ratio of stops to takes without any additional filtering of entries. Let us call this test the Risk/Reward test. Each results table is for its own pair. The columns mean the stop-to-take-profit ratio, the rows mean periods. At the same time, we will set the number of bars in the history to search for an extreme for stop placement equal to 10. The table contains final deposits. Trading is conducted with a fixed lot of 0.1.
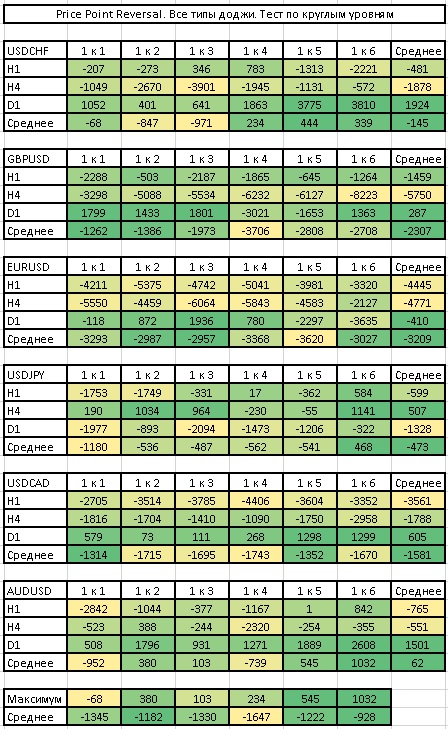
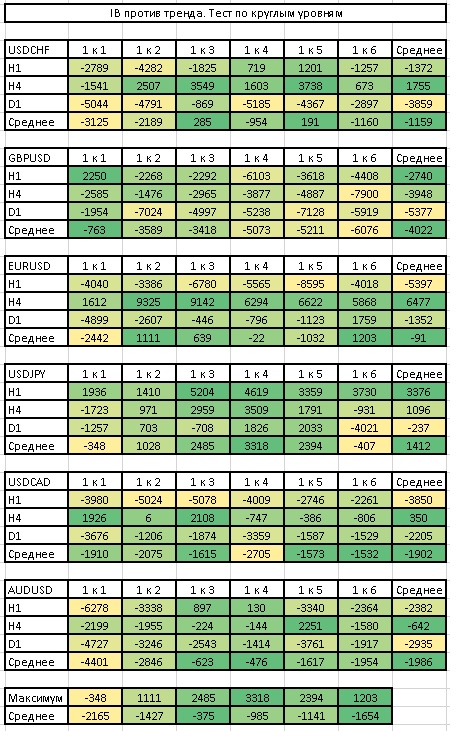
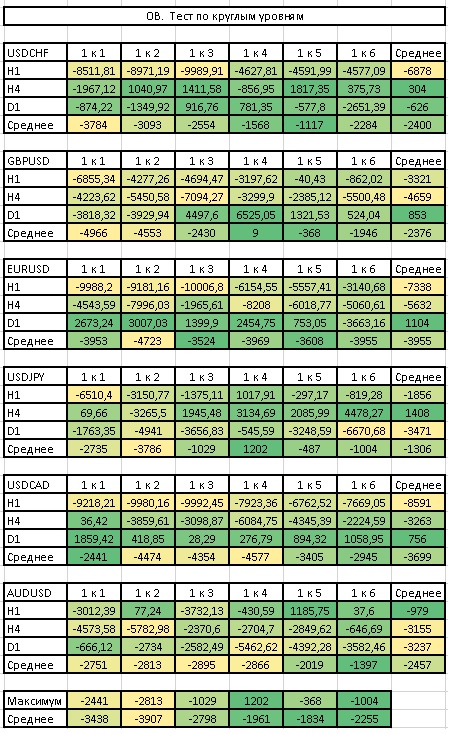
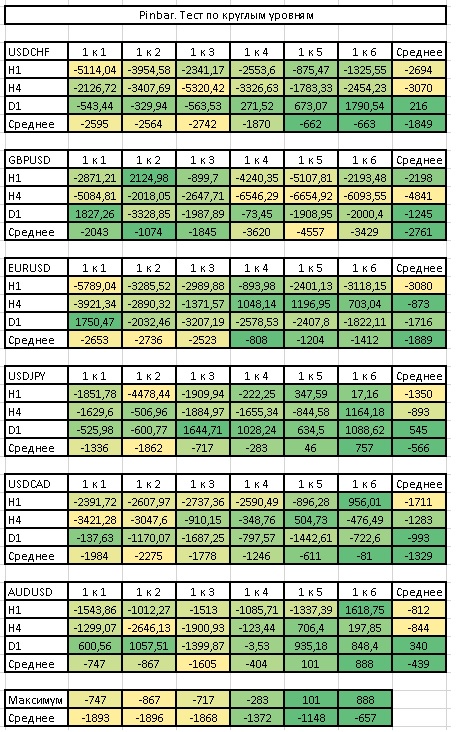
The third test is entry by pattern with filtering by a round level. That is, we will enter trades by pattern only if it rests on a round level. At the same time, we will also try to apply different profit-to-risk ratios. The level test. Each results table is for its own pair. The columns mean the stop-to-take-profit ratio, the rows mean periods. The table contains final deposits. Trading is conducted with a fixed lot of 0.1.
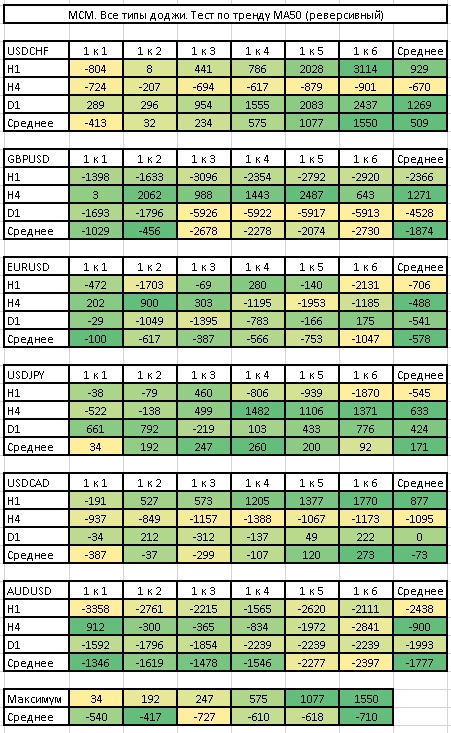
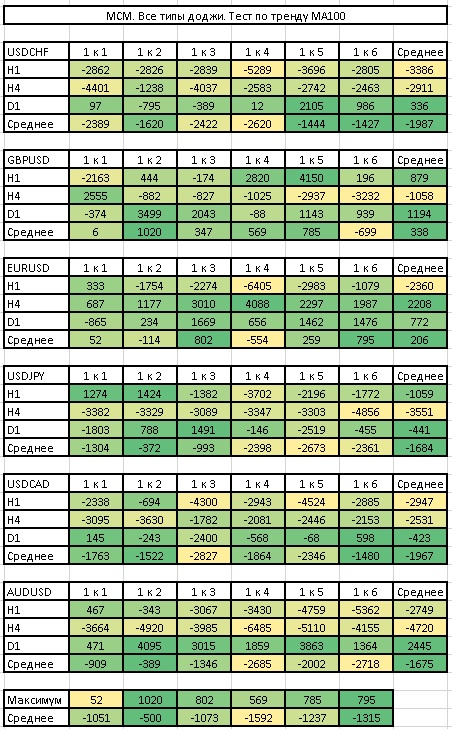
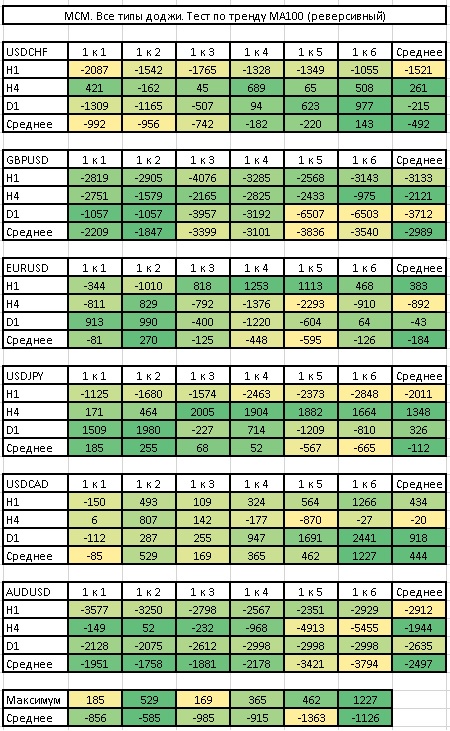
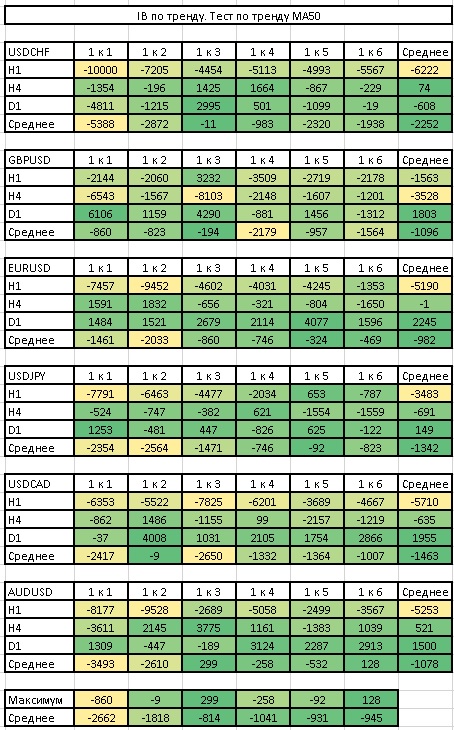
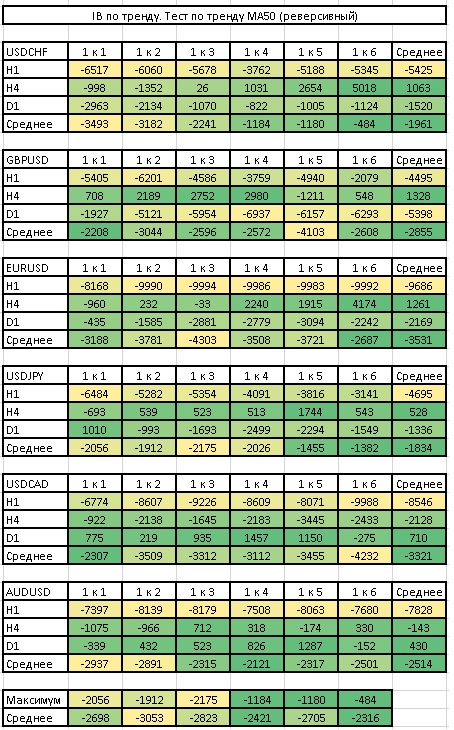
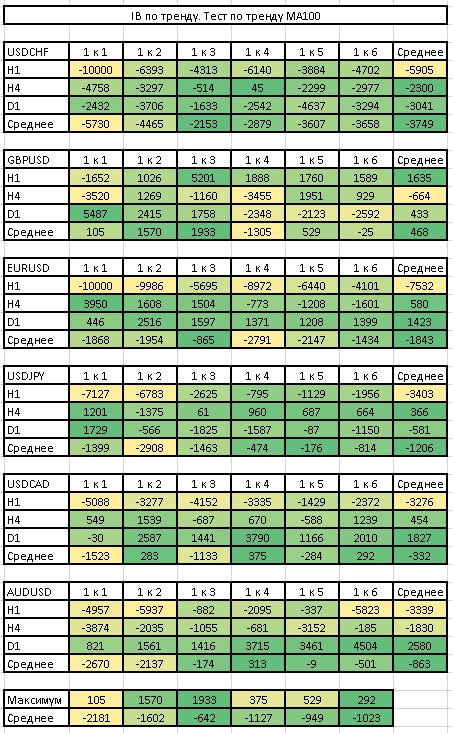
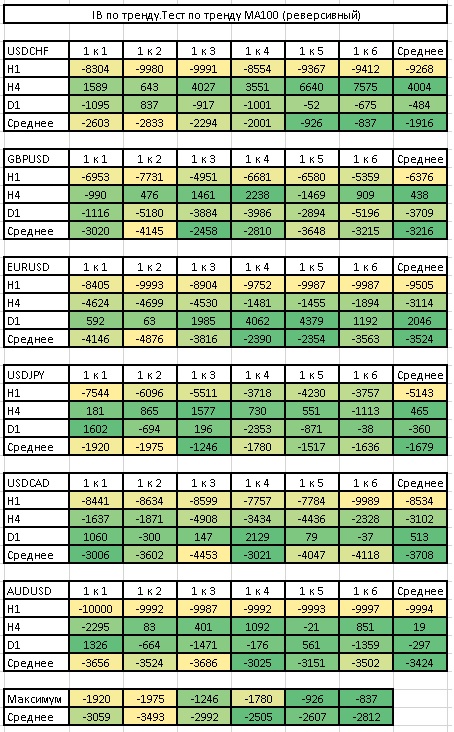
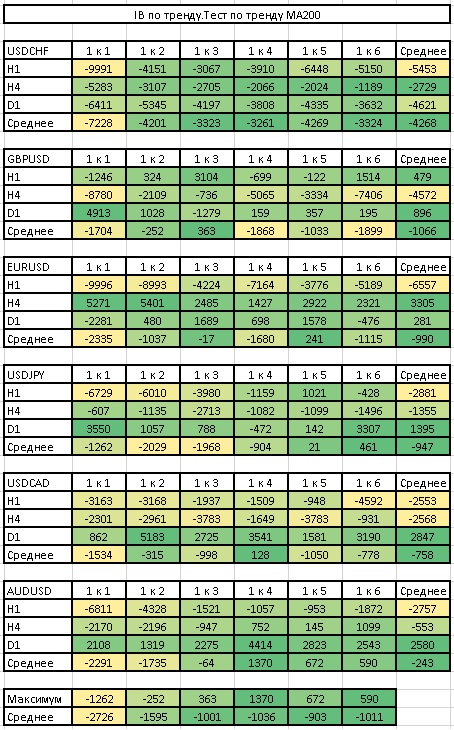
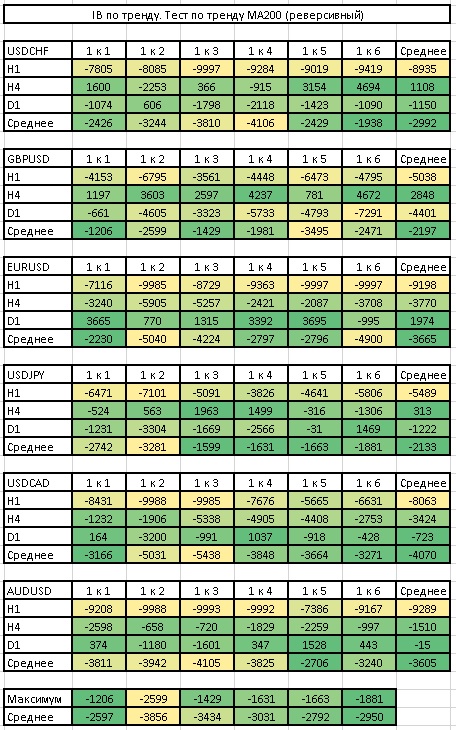
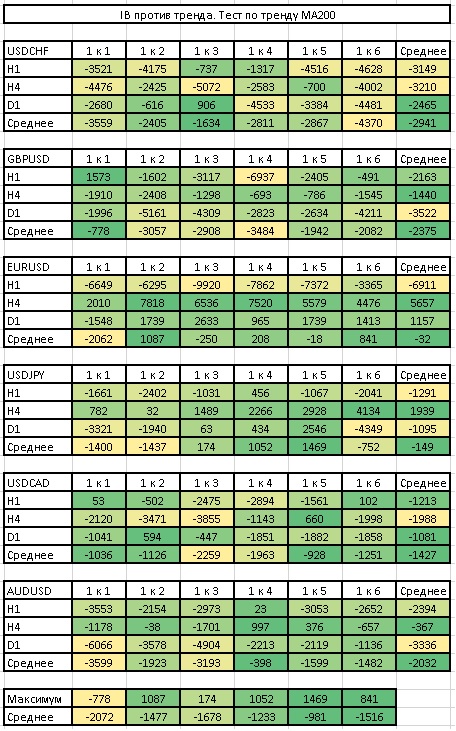
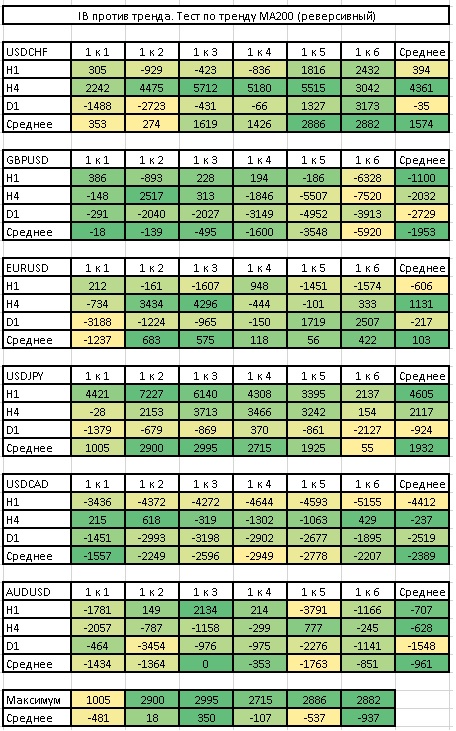
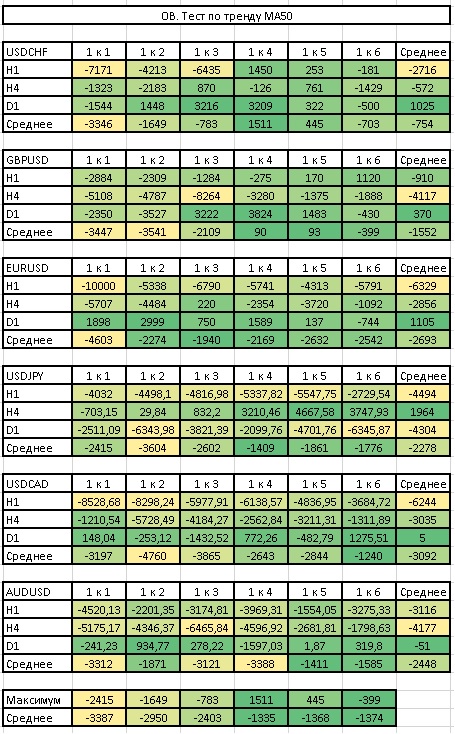
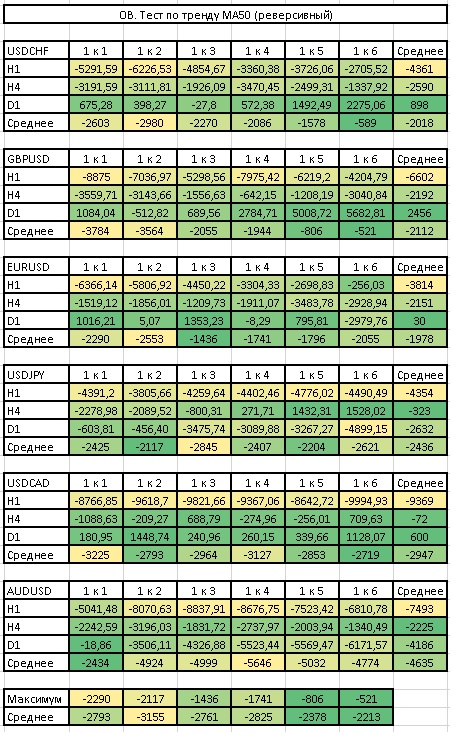
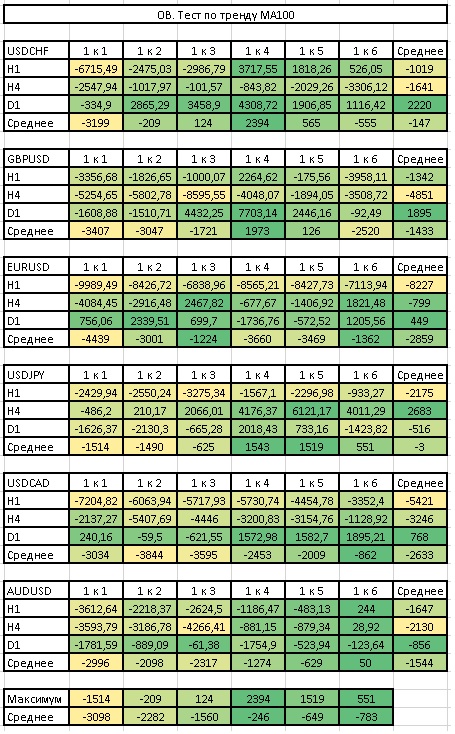
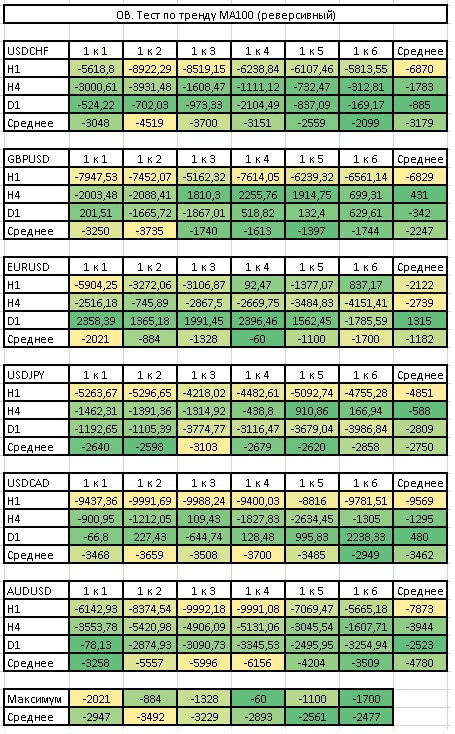
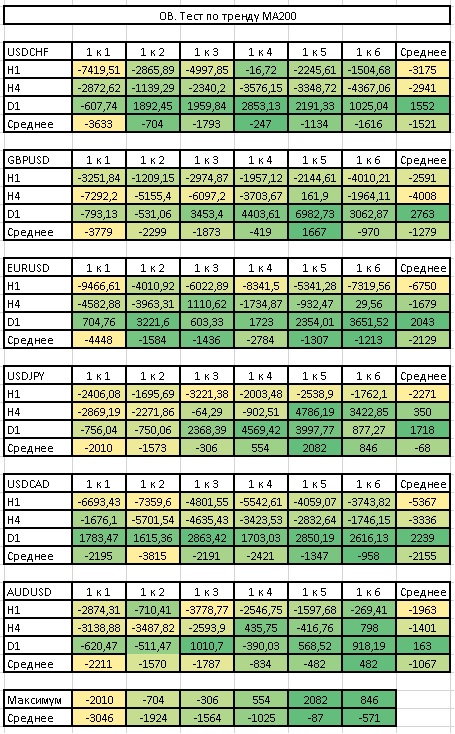
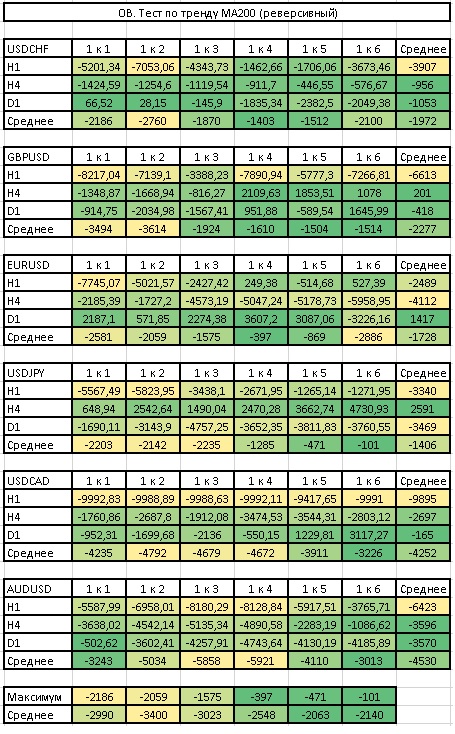
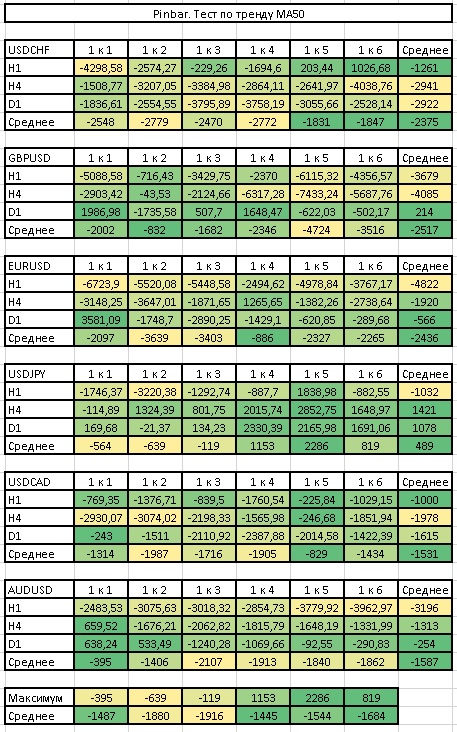
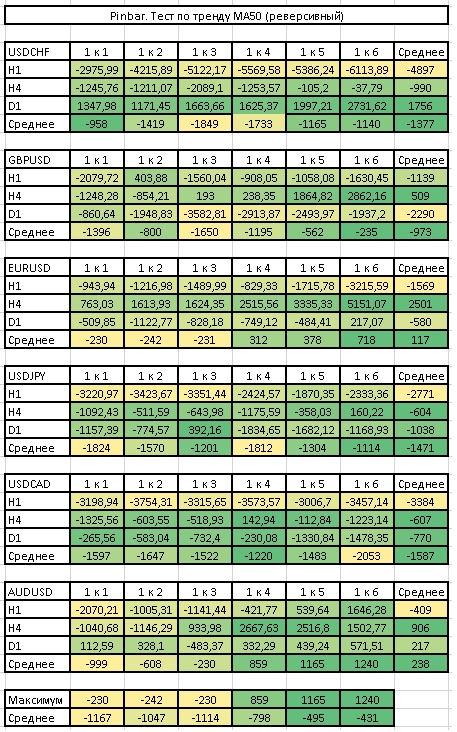
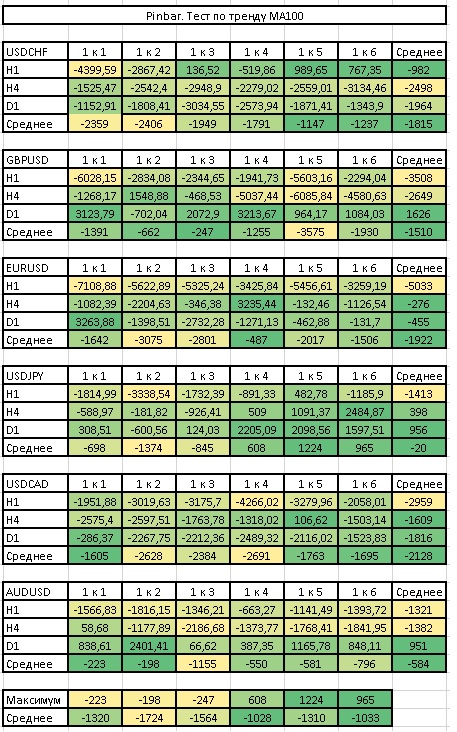
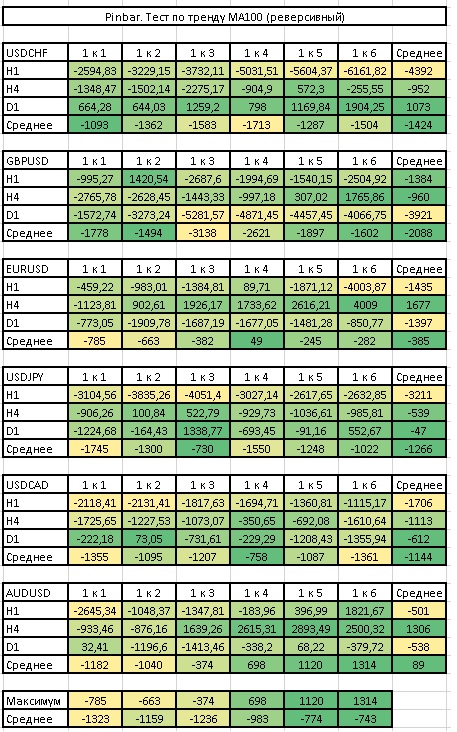
The next test is taking a trade by pattern when price is located relative to a moving average with periods 50, 100, 200. At the same time, we will also try to apply different profit-to-risk ratios. Let us call this the trend test. We will also conduct a test using the position of moving averages in reverse - we will allow sells when price is above the MA and buys when it is below. We will call this test the reverse one. Each results table is for its own pair. The columns mean the stop-to-take-profit ratio, the rows mean periods. The table contains final deposits. Trading is conducted with a fixed lot of 0.1.
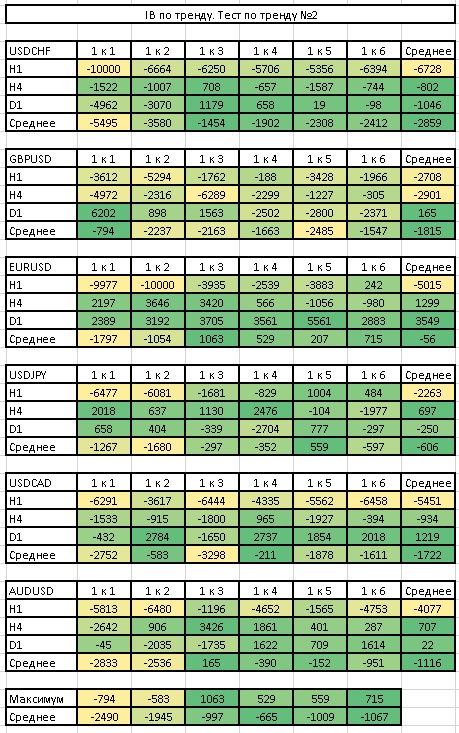
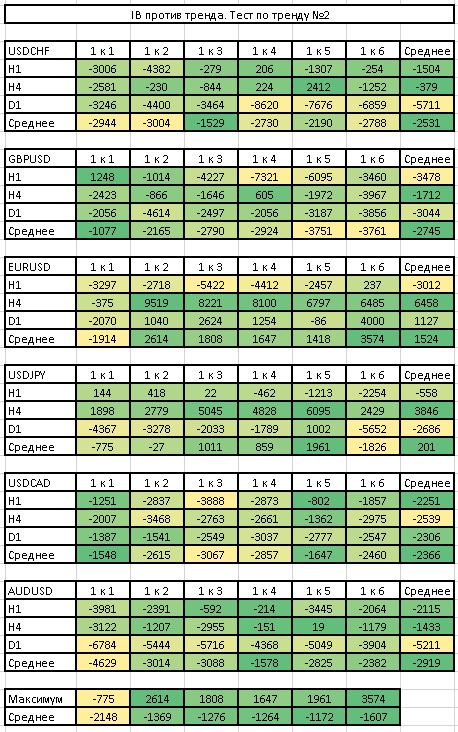
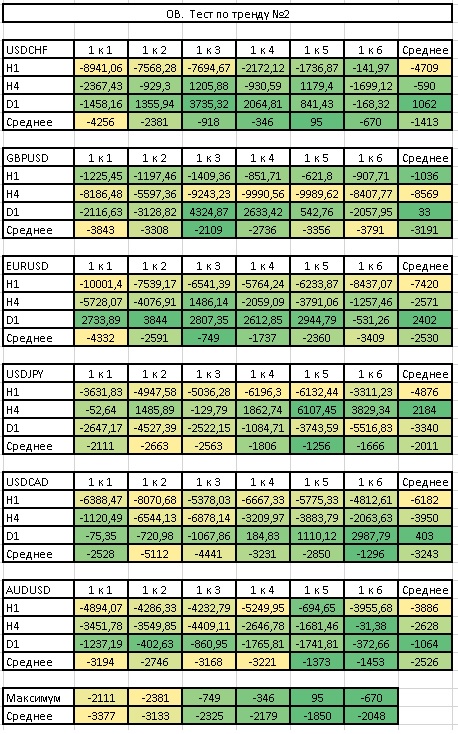
Next is the same test, only with filtering by two moving averages with periods 14 and 21 to determine the entry direction. If MA14 is above MA21, only buys are possible. And again we will also try to apply different profit-to-risk ratios. Trend test No. 2. Each results table is for its own pair. The columns mean the stop-to-take-profit ratio, the rows mean periods. The table contains final deposits. Trading is conducted with a fixed lot of 0.1.
The next test is the use of the same moving averages (50, 100, and 200) as support for the pattern. The MA level test (50, 100, 200). Each results table is for its own pair. The columns mean the stop-to-take-profit ratio, the rows mean periods. The table contains final deposits. Trading is conducted with a fixed lot of 0.1.
And the final test is with the use of oscillators: Stochastic, RSI, CCI, WPR. The oscillator test (Stochastic, RSI, CCI, WPR). Each results table is for its own pair. The columns mean the stop-to-take-profit ratio, the rows mean periods. The table contains final deposits. Trading is conducted with a fixed lot of 0.1.

At the end of each test section, we will draw brief conclusions about the success of applying one trading method or another. After completing all tests for a specific pattern, we will draw general conclusions about the effectiveness of its use and the best ways to trade it. We will also try to combine all the best techniques that we found for trading this pattern. Let us call this the pattern test.
Also, after obtaining the pattern test, we will try to use it to get an exit signal. We will call this the exit test.
And at the end we will put into use all the best things that we managed to find and see what comes of it. We will call this test the combined test.
There is one more point I would like to discuss before running the tests - subjectivity in defining patterns. The thing is that when describing patterns, authors often use adjectives regarding the candles that form the pattern such as large, small, medium. Characteristics such as a candle with almost no body and long tails are also common, for example. The point is that these concepts are alien to a machine; a computer understands only the language of numbers. The algorithm needs specifics to work. In other words: gentlemen, how many grams should we weigh out? This question can be answered in several ways - you can select a specific number of points to determine whether the candle before us is long or not, or you can use such a wonderful indicator as ATR. The ATR indicator measures the average volatility in the market, which is exactly what we need, since volatility changes from market to market and even from day to day. So, ATR shows the average value of volatility, that is, precisely the length of a medium-sized candle in the current market. Therefore, we will assume that:
- A small candle - from 0 to 0.6 of the ATR value;
- A medium candle - from 0.6 to 1.4 of the ATR value;
- A large candle - from 1.4 to 2.5 of the ATR value;
- A very large candle - from 2.5 to 4 ATR;
- A huge candle - above 4 ATR.
There is no body on the candle or the body is very small, up to 10% of the length of the whole candle. The same applies to the shadows.
- A small body (shadow) is up to 30% of the entire candle length;
- A medium one (body, shadow) is from 30% to 70% of the entire candle length;
- A full-bodied candle is one where the length of the shadows occupies no more than 30% of the entire candle length.
I think we are done with the basic definitions and can move directly to the tests themselves.
Doji Patterns

A doji is a candle in which the opening and closing prices are equal, or almost equal. There should also be shadows on both sides of the candle, of approximately the same size.
Before the doji candle, there should be a full-bodied candle of medium or large size in the direction of the trend. It is this candle that determines the nature of the doji.
When trading a doji, you should wait for confirmation, that is, one more candle should appear after the doji appears. If the last candle closes in the direction of the preceding trend, we get the Price Action pattern "Move - Congestion - Move" or "Movement - Consolidation - Movement", a trend continuation pattern. If the last candle is against the established trend, we have a Price Point Reversal pattern or a "Reversal Point". In the Japanese version, the pattern is called the "Morning or Evening Doji Star". Exactly the same pattern, but simply with a small candle instead of a doji, is called simply the "Morning or Evening Star". If a gap occurred between the doji and the candles surrounding it, then such a pattern turns into an "Abandoned Baby" pattern. Since gaps are a rare occurrence in the forex market, we will not single out this pattern separately.
As for the doji candle itself, it comes in three varieties:
- A doji star has a very small body (up to 10%) or no body at all, while the size of the candle itself is small (up to 0.6 ATR);
- The second variety is the gravestone doji, which strongly resembles a pin bar, only with practically no body;
- The third variety is the rickshaw doji. This candle has a small body located approximately in the middle of the candle and fairly large shadows in both directions of roughly the same size.
Also, when talking about a doji candle, they often mean a small candle (up to 0.6 ATR) with a small body (up to 30% of the length of the entire candle). Let us call this candle, within the framework of this study, a non-strict doji.
Now let us determine the frequency of occurrence of such a pattern on charts of different currencies and different periods. Here we will not use any filters or confirmations. We will simply check the very fact of the appearance of a medium or long full-bodied candle with a doji candle of one of four types.
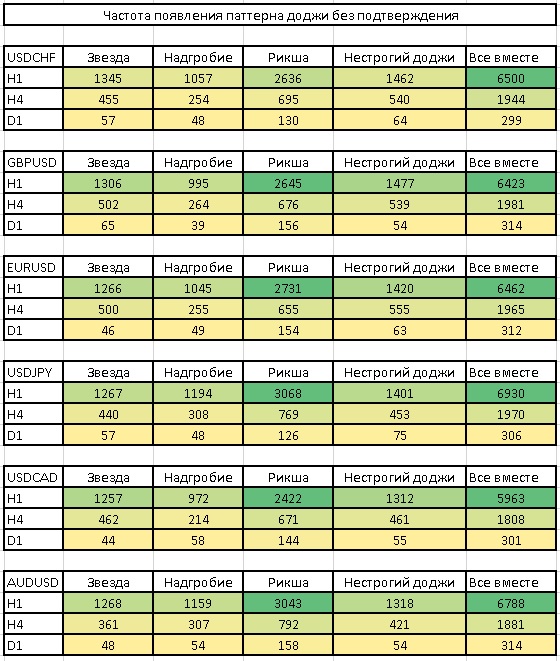 As you can see, the frequency of occurrence of the pattern on daily charts is quite low. Nevertheless, on H4 and H1 periods the pattern appears quite often.
Price Point Reversal

The first tests that we will conduct will be on the Price Point Reversal pattern or the "Reversal Point". The Japanese analogue is the "Morning or Evening Star". We will enter fully according to the rules of the pattern, with pending orders placed 5 points from the High/Low of the signal (confirming) candle. The predictive efficiency test is done without Stoploss and Takeprofit orders; for the remaining tests, the stop is set at the ten-bar extremum. That is, on the nearest 10 candles the lowest point for buys or the highest for sells is found, an offset of 5 old points is taken from this point, and the stop is set at the resulting level. Takeprofit is calculated as a ratio to the size of the stop in points: 1 to 1, 1 to 2, 1 to 3, and so on. Since we will be entering with pending orders, it is necessary to clarify the rule for deleting orders if they are not triggered. I will take the generally accepted version: if the order is not activated within 5 candles, it is deleted.
Predictive Efficiency Test
Here we will check the predictive efficiency of the pattern, that is, how likely a movement in the right direction is after a certain number of candles following the appearance of the pattern.
Doji Star
 Gravestone Doji
 Rickshaw Doji
 Non-strict doji
 Summary Table
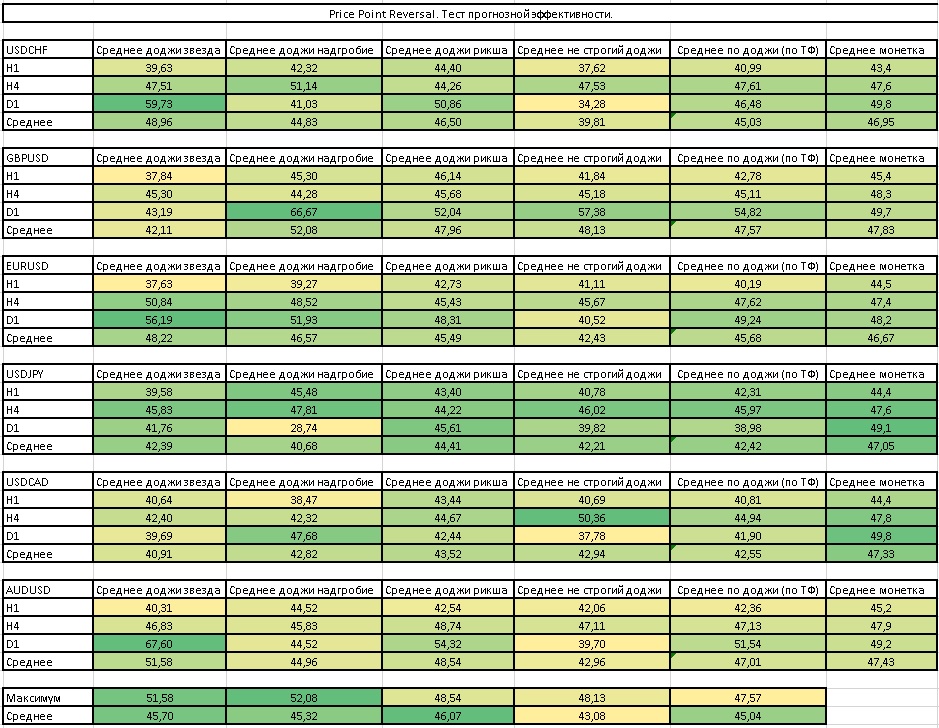 As can be seen from the results, there is no strong difference in which type of doji candle is used as a pattern. On some instruments the doji star works a little better, on others the gravestone doji, and so on. Therefore, in further tests we will combine all types of doji candles into one. In addition, you can see that on average the appearing pattern allows you to predict the price with a probability of about 45%. So how can you make money on such a pattern when we are wrong more often than we are right? The secret lies in the correct profit-to-risk ratio, which will be discussed further.
Risk/Reward Test

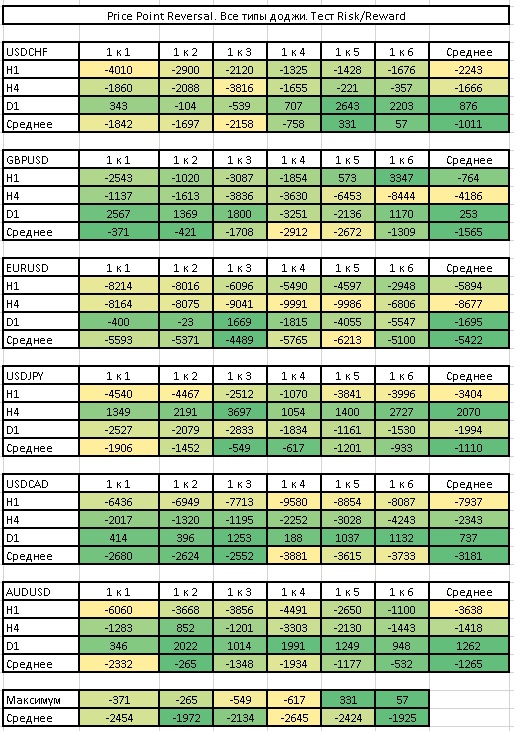 Based on the summary table, we can conclude that the classic 1 to 3 ratio is not suitable for all instruments. If you look at the average values across all pairs, you can see that the 1 to 2, 1 to 3, and 1 to 6 ratios perform best. Nevertheless, the larger the ratio, the fewer profitable trades you will have and the longer the drawdown periods will be. In addition, each pair should have its own profit-to-risk ratio selected, because, for example, for USDCHF it is optimal to use a 1 to 5 ratio, whereas for EURUSD this ratio is the worst possible. In addition, this ratio also differs for different periods. While for TF D1, 1 to 3 is mostly optimal, for H4 it is better to choose 1 to 2, and for H1, 1 to 5 or higher.

Round Levels Test
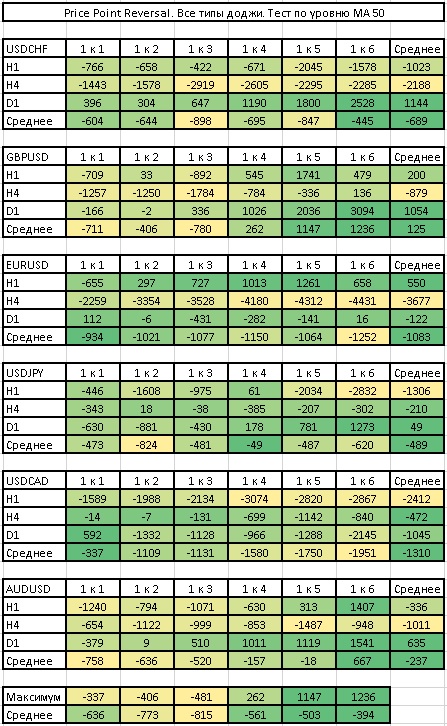
 Test at the MA 50 level
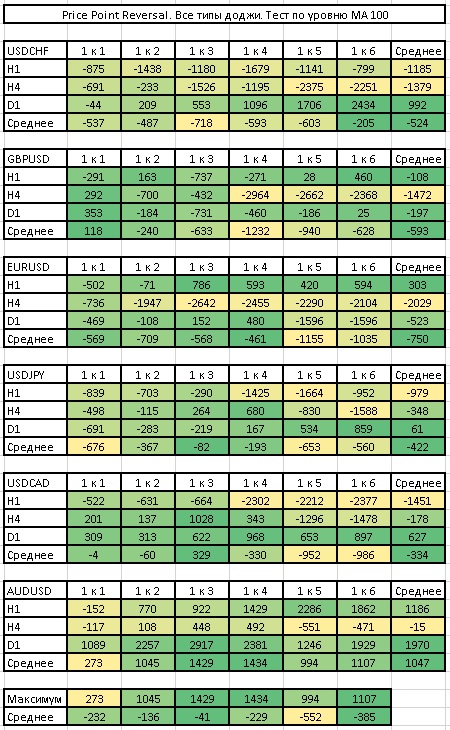
 Test at the MA 100 level
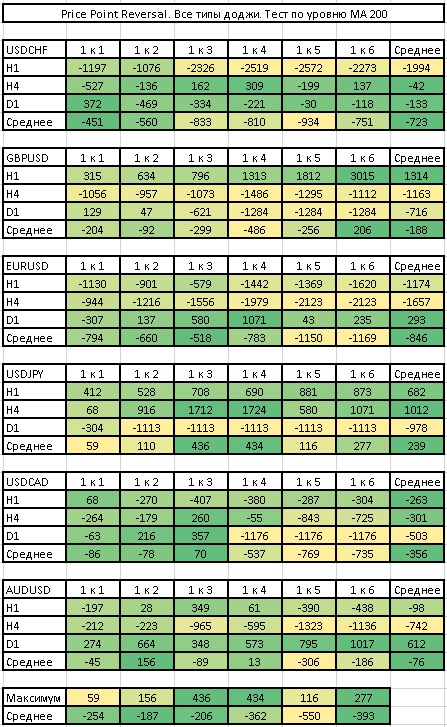
 Test at the MA 200 level
 Tests by levels - summary table
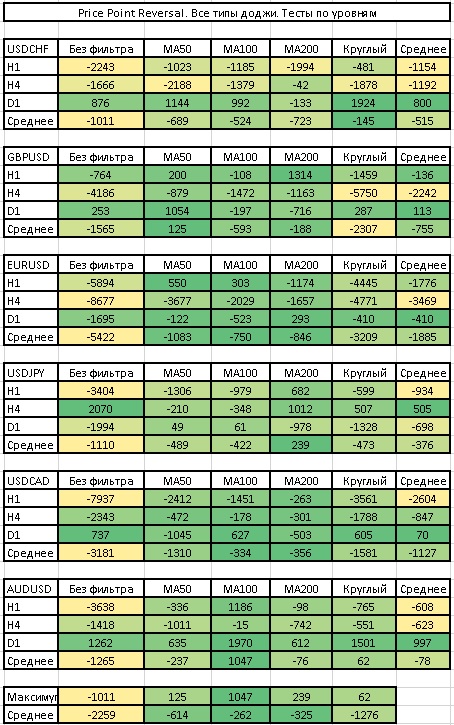 As can be seen from the table, the pattern with support from a level gives a much better effect, and it is not so important what is used as the level. And again, on different instruments the effectiveness of one or another type of level differs. For example, round levels are well respected on daily charts on practically all currency pairs, but on lower periods they are not respected at all. Using a moving average with a period of 50 as a level may be a good idea for the daily charts of USDCHF and GBPUSD and a very bad one for the USDCAD pair. At the same time, on average, MA100 proved itself best as a level. But on the USDJPY pair, levels work poorly in general. In general, once again there is no universal option here and everything should depend on the character of a specific currency pair. But we have made sure that a pattern resting on a level works better in most cases.
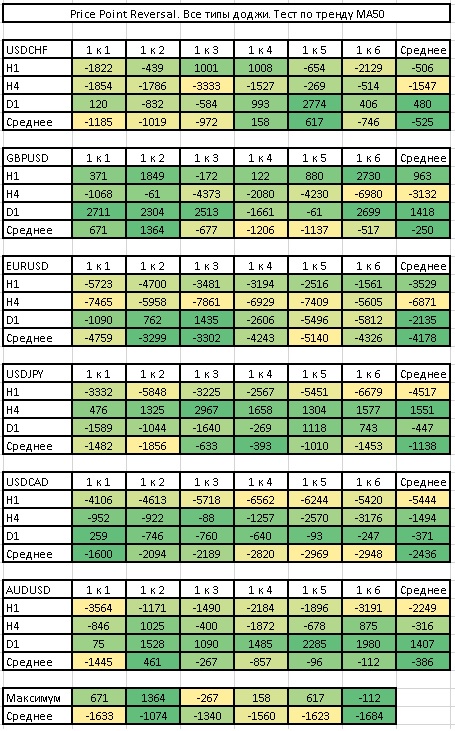
Test by MA50 trend

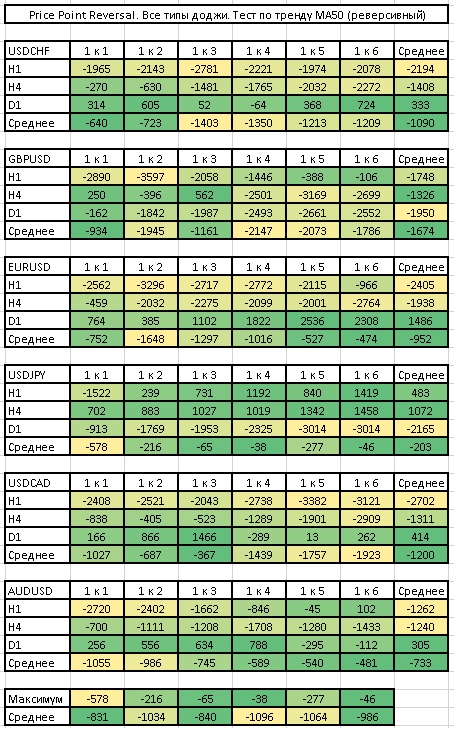
 Test by MA50 trend (reversal)
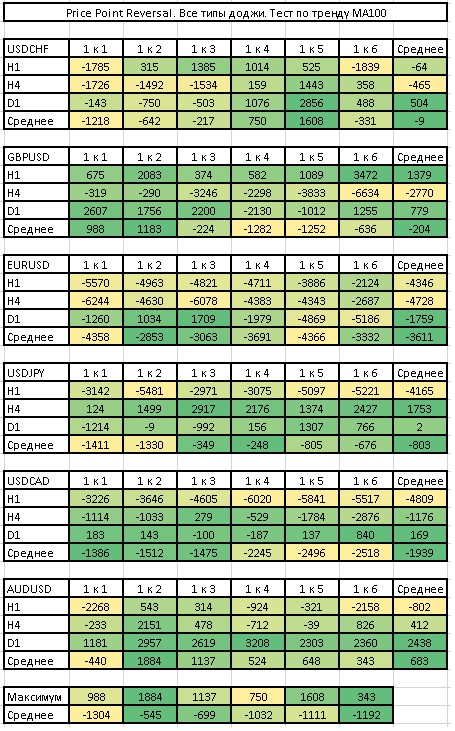
 Test by MA100 trend
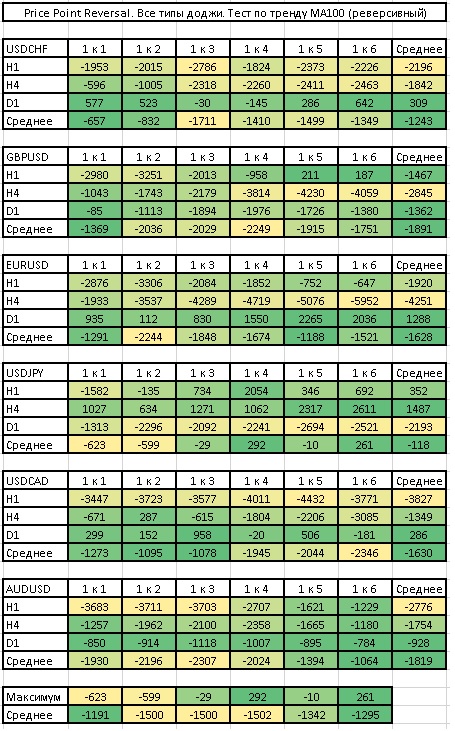
 Test by MA100 trend (reversal)
 Test by MA200 trend
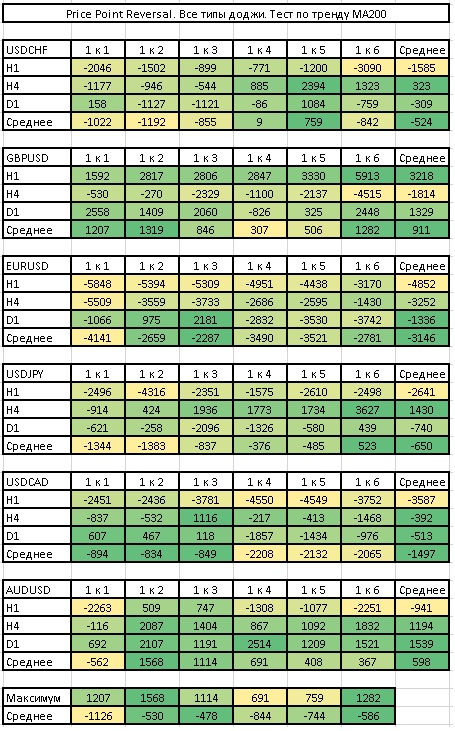 Test by MA200 trend (reversal)
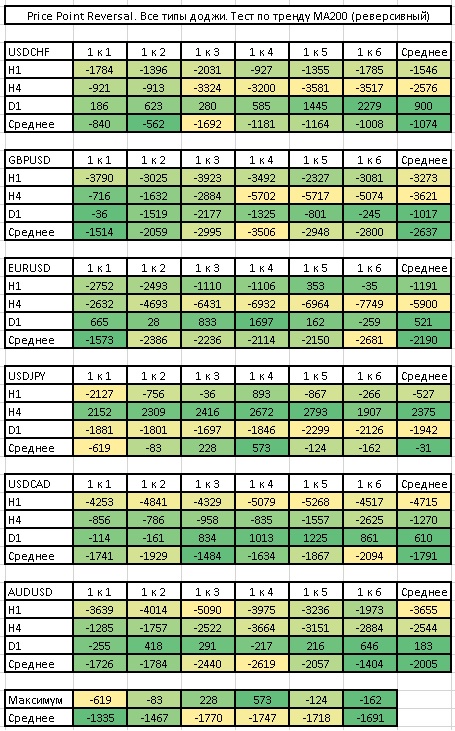 Test by trend No. 2
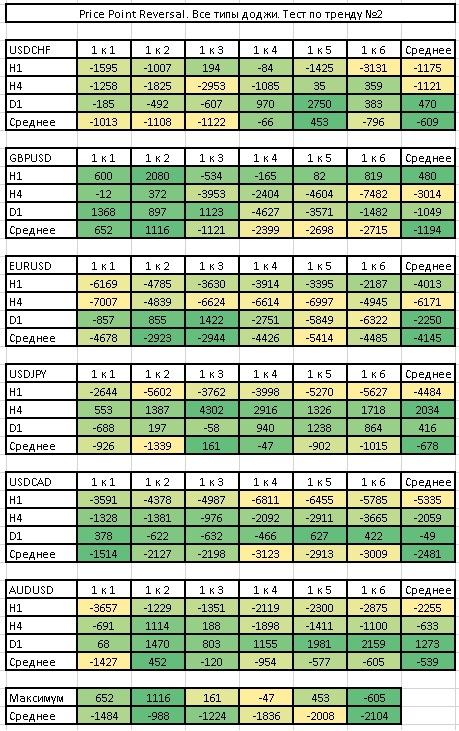 Tests by trend - summary table
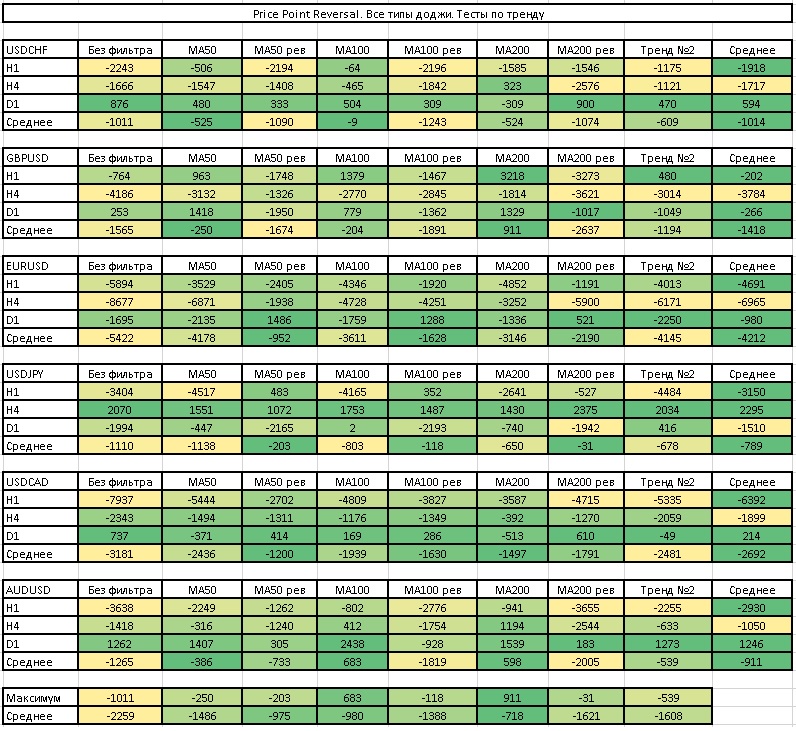 As can be seen from the table, the best indicator of the presence of a trend is the good old rule: when the price is above the moving average, the trend is up, and when it is below, the trend is down. At the same time, it is best to use moving average periods of 100 and 200. At the same time, this approach works best precisely on daily charts. Despite the fact that once again we observe individual preferences for each pair and period, in general it can be said that working with patterns along the trend really improves the initial result.
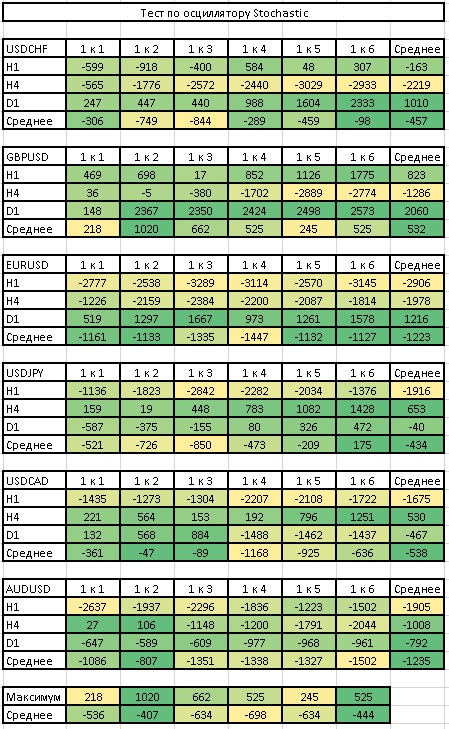
Test by the Stochastic oscillator

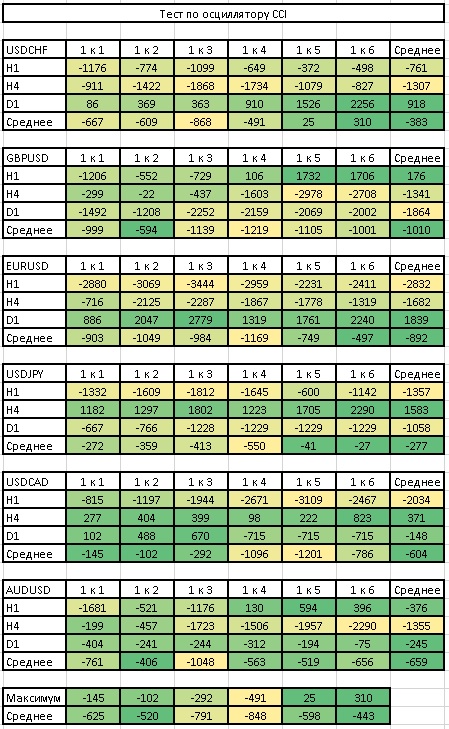
 Test by the CCI oscillator
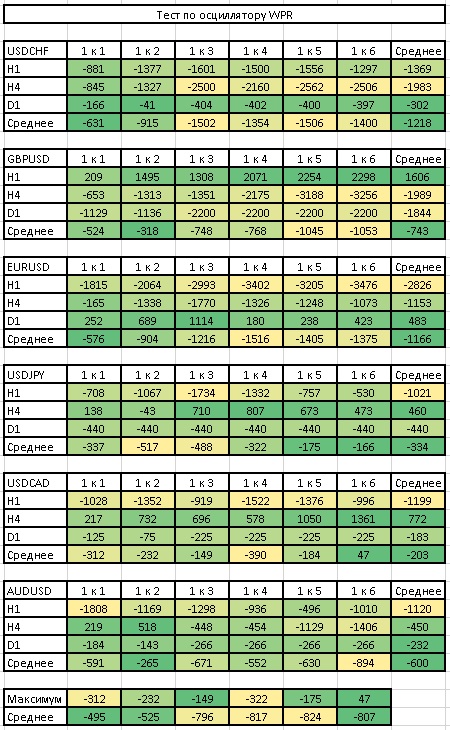
 Test by the WPR oscillator
 Tests by oscillators - summary table
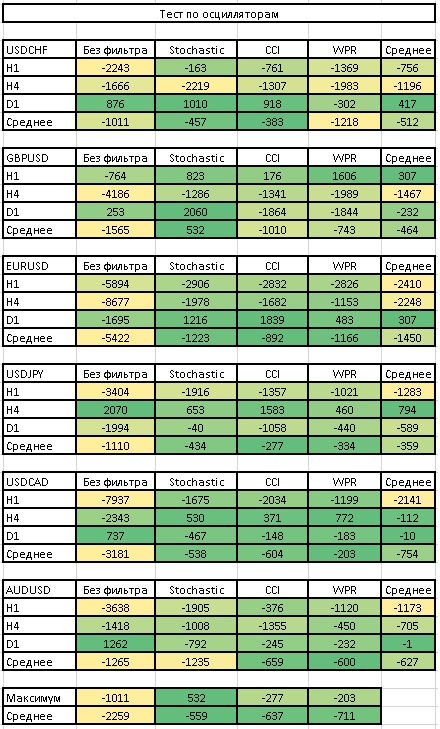 The use of oscillator readings as a filter undoubtedly improves the results. At the same time, the Stochastic Oscillator shows itself best in this role.
Pattern test

This is what pattern trading looks like on the H1 period for the currency pairs we are considering:
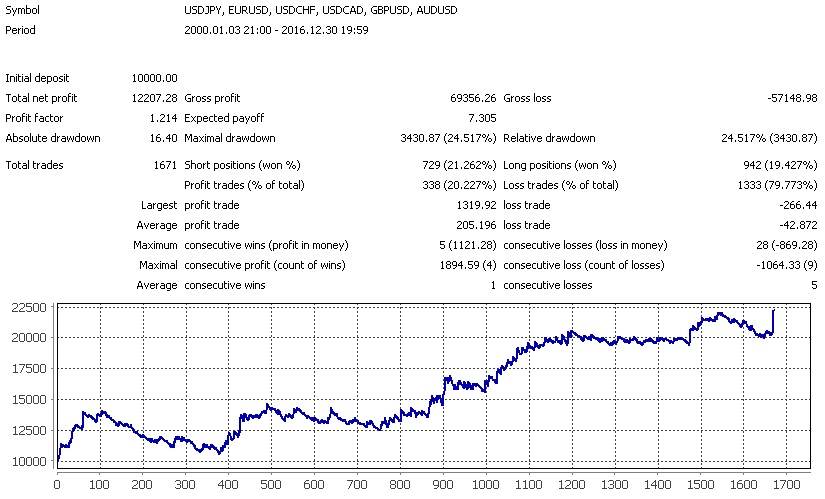 If we replace the standard stop by the candle shadow with a stop by the ATR indicator, we get the following result:
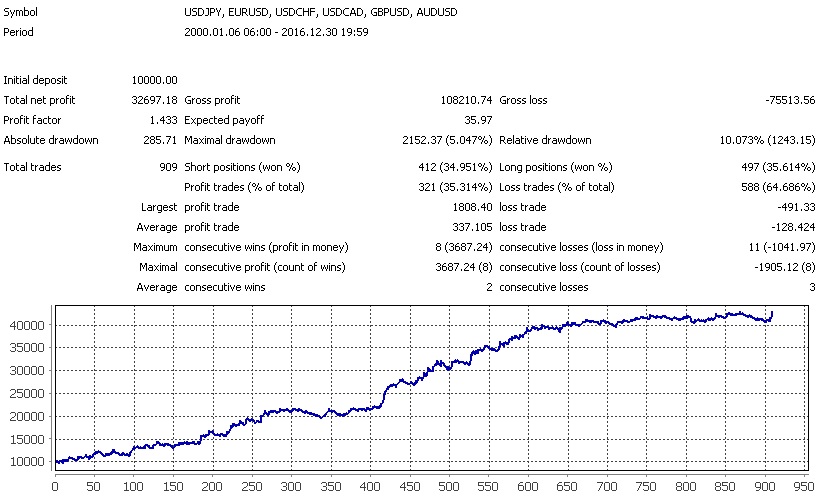 You can also add a trailing stop by candle shadows to the trading system - we will pull our initial stop loss after the price by the candle shadows:
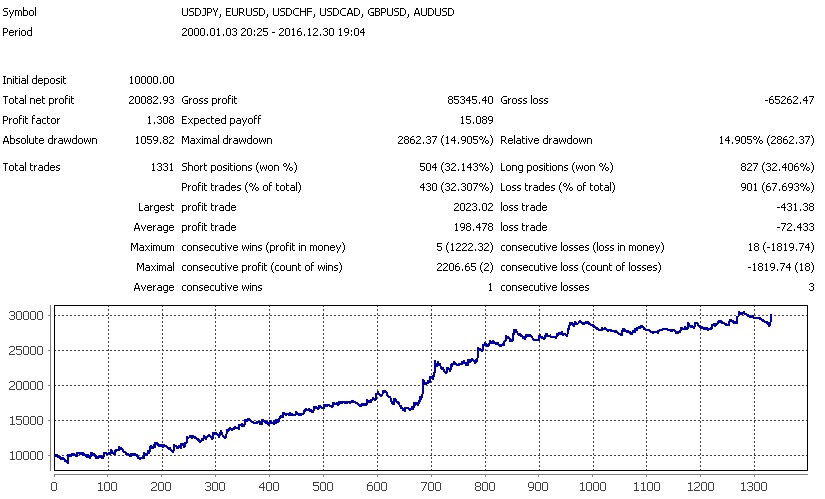 And here is what will happen if you use the opposite signal to exit the position:
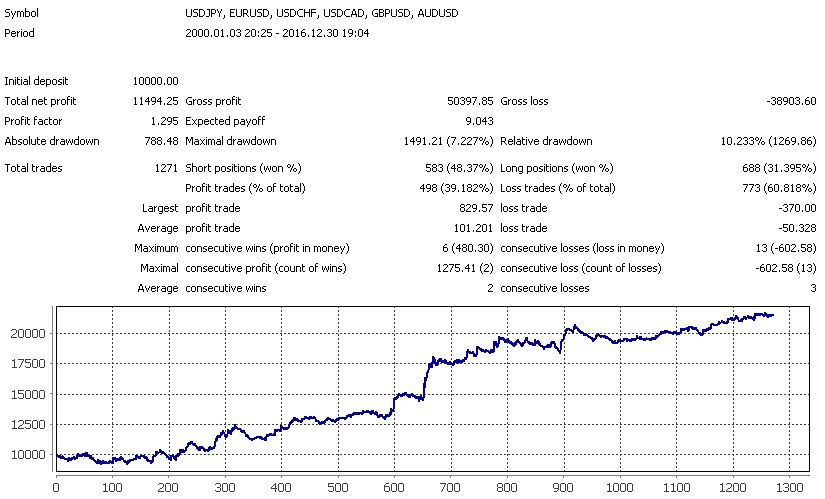 As can be seen from the tests, the best signal is achieved when setting the stop loss at a level of 2-4 ATR from the entry price and using an "entered and forgot" strategy. Both the use of a trail and the condition of exiting on the reverse signal only spoiled our statistics.
Now let's take a look at trading on the H4 period:
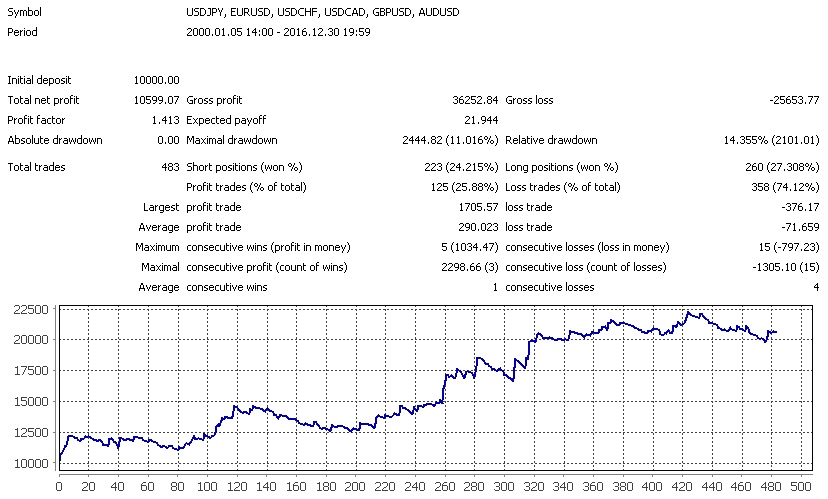 There are noticeably fewer entries, only 25% of the trades are profitable, but we still make money by placing stops according to the classic rule, below or above the candle shadow. Although the drawdown periods are quite long, the average winning trade is four times larger than the average loss. Let's apply 2-4 ATR stops:
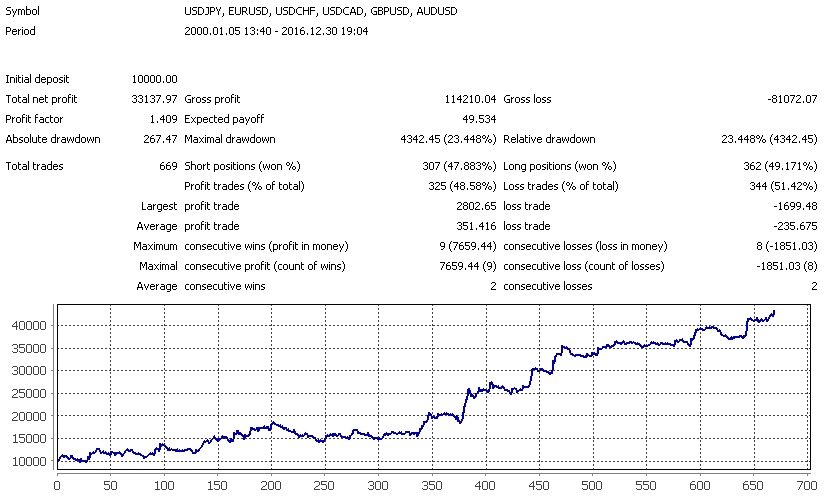 Our drawdown increased, the average profit is now less than twice the loss, but almost half of the trades are profitable. The expectancy increased and the profit tripled. Let's add a trailing stop:
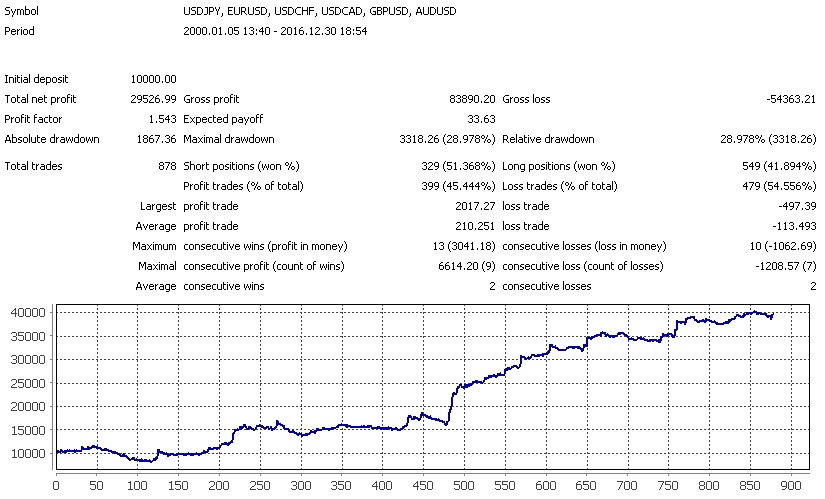 Here the data is very similar to the previous one, except that the profit factor rose from 1.4 to 1.55 and the balance curve became smoother. Now let's add an exit-on-opposite-signal condition:
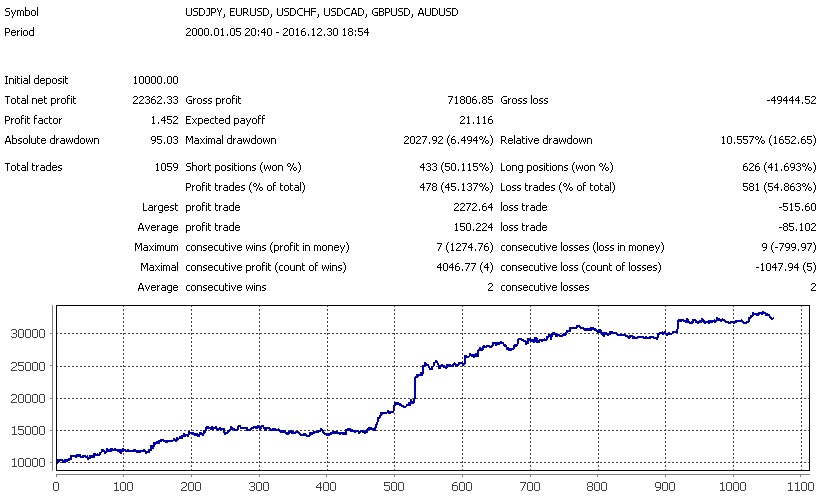 This condition slightly reduced the profit factor and the final profit, but sharply cut the drawdown from 28% to only 6%.
Conclusions

We found that there is no strong difference in which type of doji candle is used in this pattern. On some instruments the doji star works a little better, on others the gravestone doji, and so on. In addition, the classic 1 to 3 ratio is not suitable for all instruments. The optimal profit-to-loss ratio in this pattern varies from 1 to 2 to 1 to 6 depending on the instrument and the period. At the same time, both using levels and trading with the trend improve trading results. It is best to use the good old MA100 both as a level and as a trend indicator. And the best oscillator for filtering signals turned out to be Stochastic. As can be seen from the summary tests carried out, the pattern really works, the methods of filtering the signal by trend, by levels, and by oscillators also work, however each currency pair and each timeframe requires its own approach. As for trade management, it is clearly visible that a trailing stop based on candle shadows works well only on periods from H4 and above. Exiting on the opposite signal also proved effective on the H4 period and higher. But placing stop-loss orders below or above the candle shadow turned out to be ineffective. The ATR indicator multiplied by a factor from 2 to 4 is much better suited for determining the stop level.

The Price Action Pattern "Move - Congestion - Move" or "Movement - Consolidation - Movement"
Frequency of occurrence of the MCM pattern
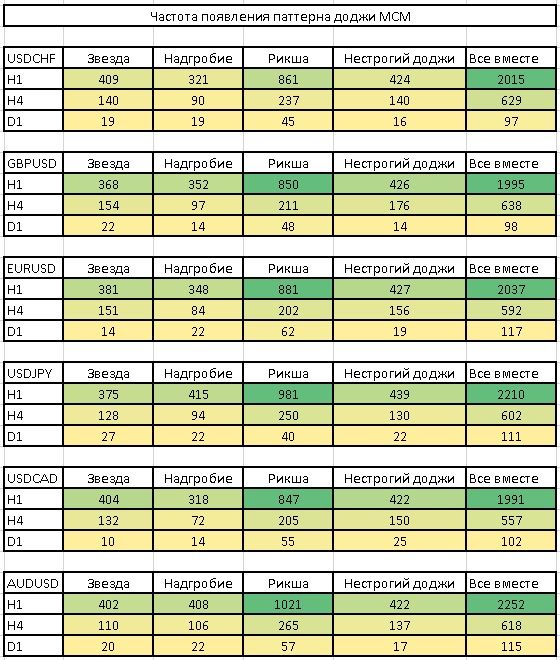 As you can see, the pattern does not appear very often even on the H4 period.
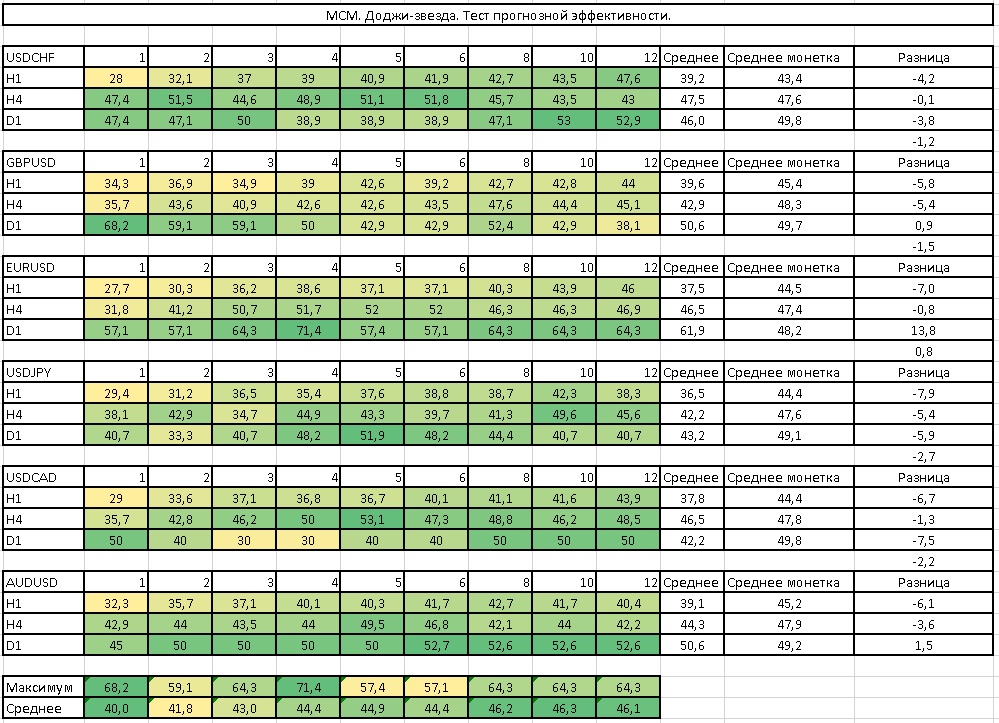
Predictive effectiveness test
Doji star
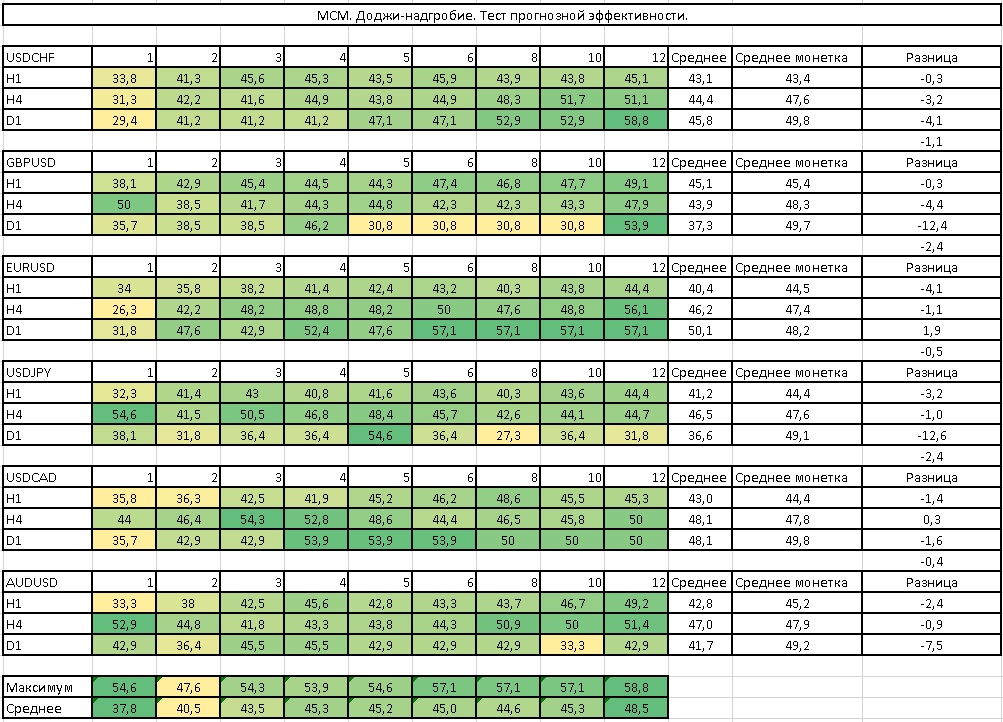
 Gravestone doji
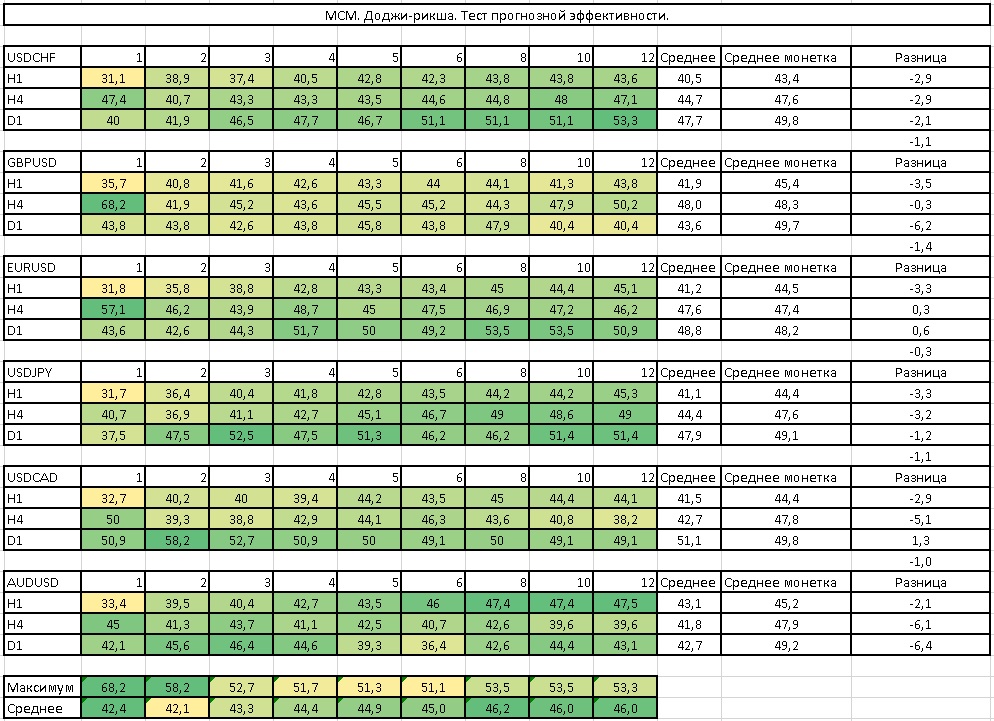
 Rickshaw doji
 Loose doji
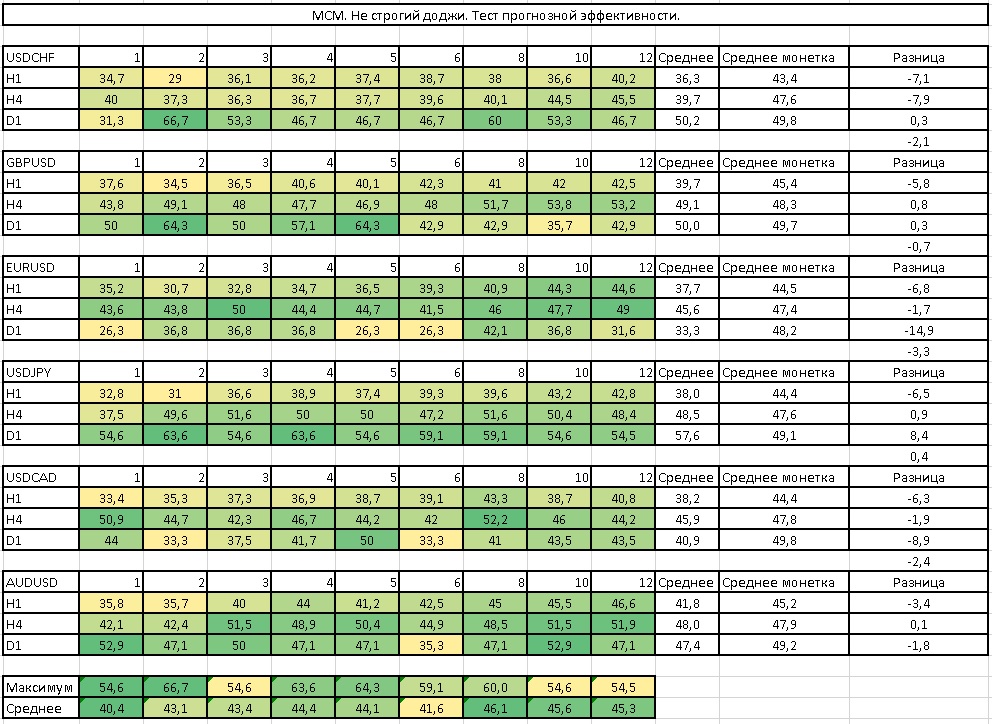 Summary table
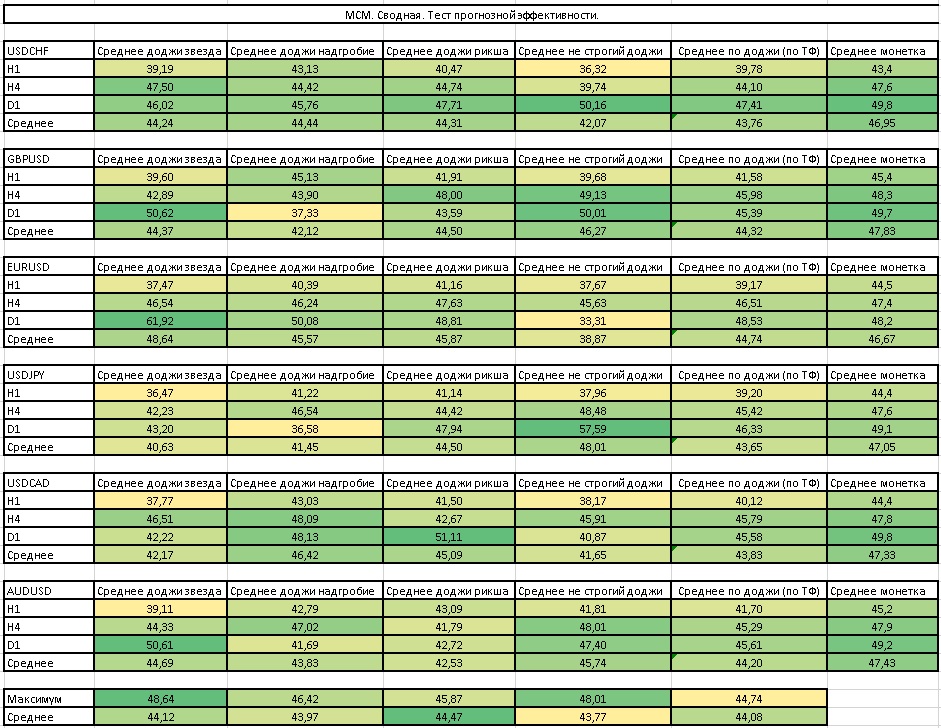 As can be seen from the results, there is no strong difference in which type of doji candle is used in the pattern. On some instruments the doji star works a little better, on others the gravestone doji, and so on. Therefore, in further tests we will combine all types of doji candles into one. In addition, you can see that on average the pattern that appears allows you to predict price with a probability of about 45%. So how can you make money on such a pattern when we are wrong more often than we are right? The secret lies in the correct profit-to-risk ratio, which will be discussed below.
Risk/Reward test

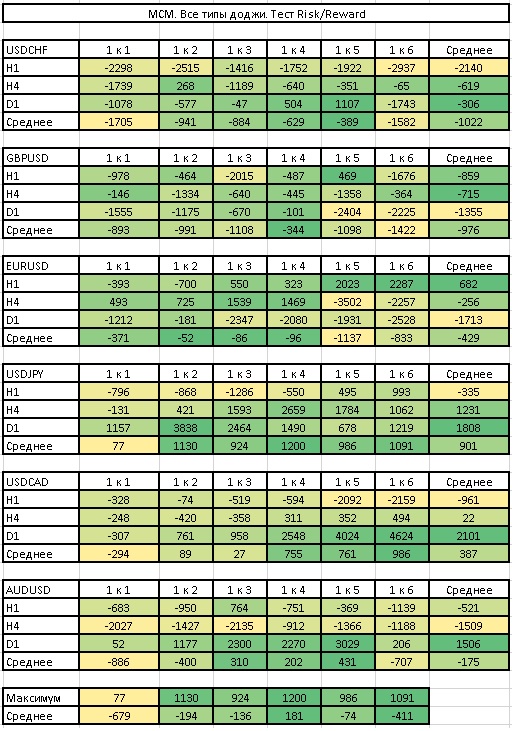 Based on the summary table, we can conclude that the classic 1 to 3 ratio is not suitable for all instruments. If you look at the average values across all pairs, you can see that the ratios 1 to 2, 1 to 3, and 1 to 6 perform best. Nevertheless, the larger the ratio, the fewer profitable trades you will have and the longer the drawdown periods will be. In addition, each pair should have its own profit-to-risk ratio selected.
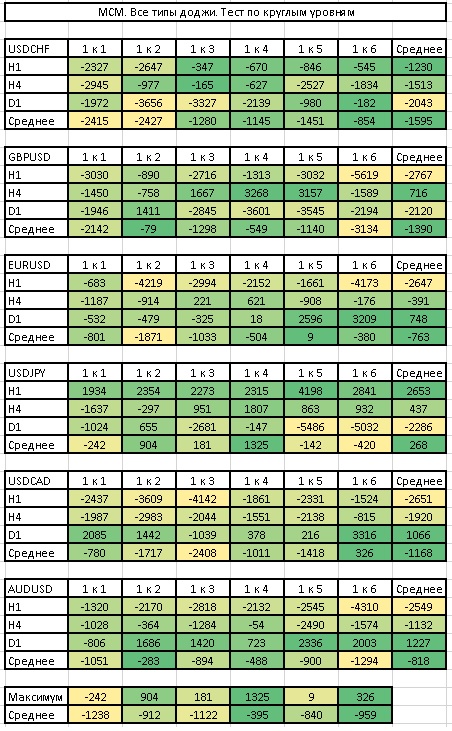
Round levels test

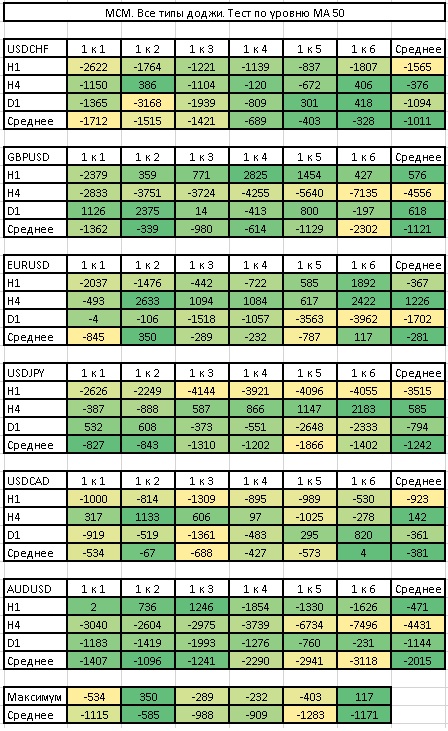
 MA 50 level test
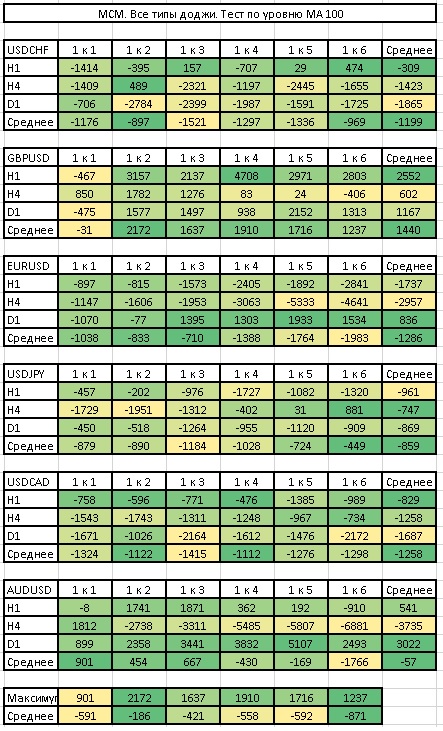
 MA 100 level test
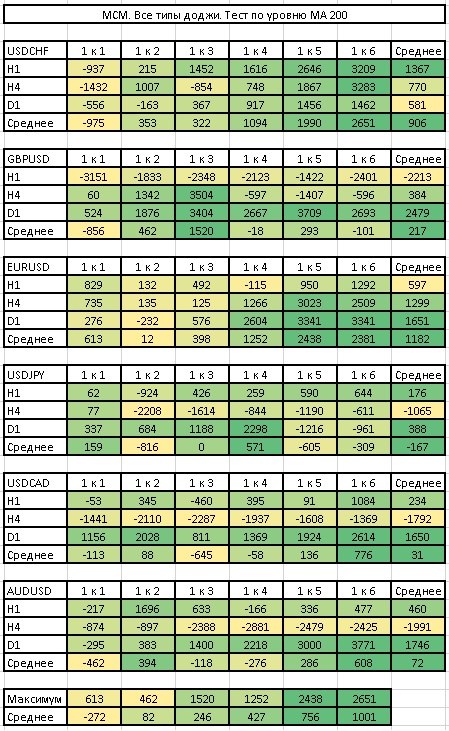
 MA 200 level test
 Level tests - summary table
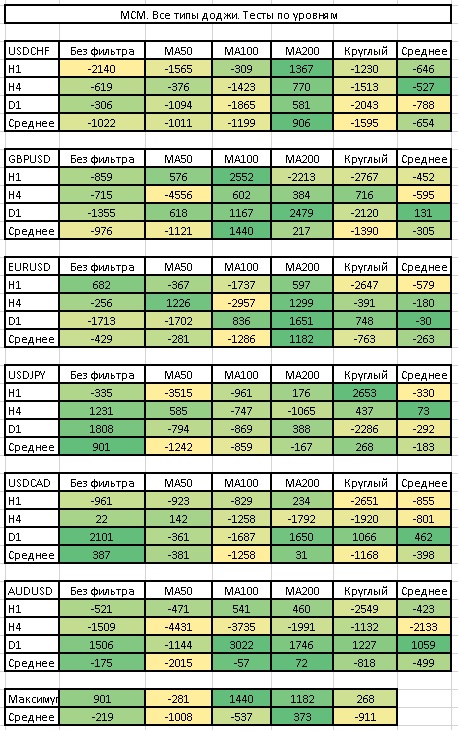 As can be seen from the table, the pattern based on a level gives a better effect, and it is not so important what is used as the level. And again, on different instruments the effectiveness of one type of level or another differs. For example, pairs such as USDJPY and USDCAD do not particularly respect any levels at all. At the same time, MA200 performed best on USDCHF and EURUSD, while MA100 on GBPUSD and AUDUSD. From this we can conclude that if you are going to use a moving average as a dynamic level, its period should be selected for the specific market.
Trend Test MA50

 Trend Test MA50 (reverse)
 Trend Test MA100
 Trend Test MA100 (reverse)
 Trend Test MA200
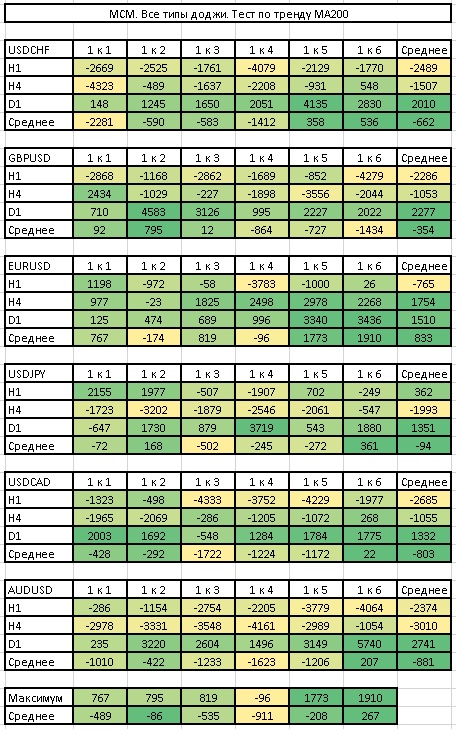 Trend Test MA200 (reverse)
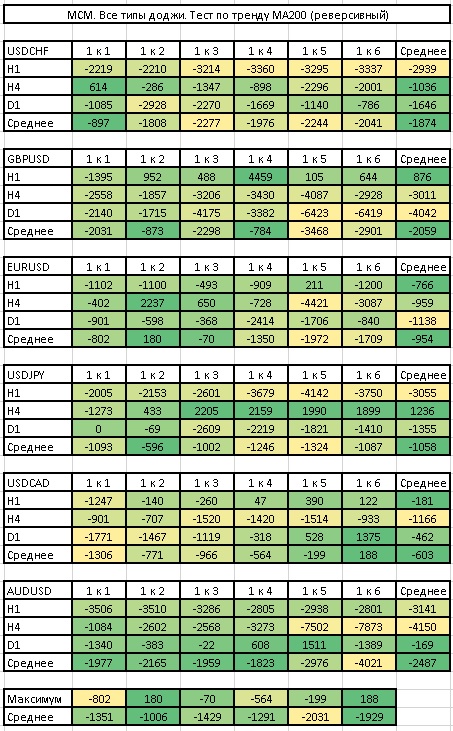 Trend Test No. 2
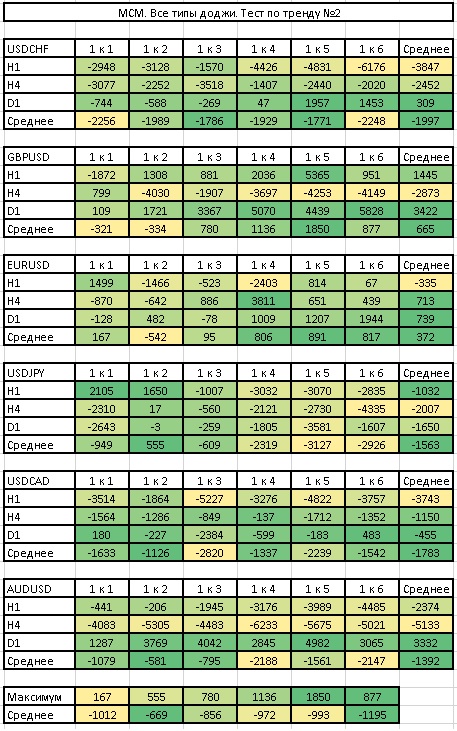 Trend Tests - Summary Table
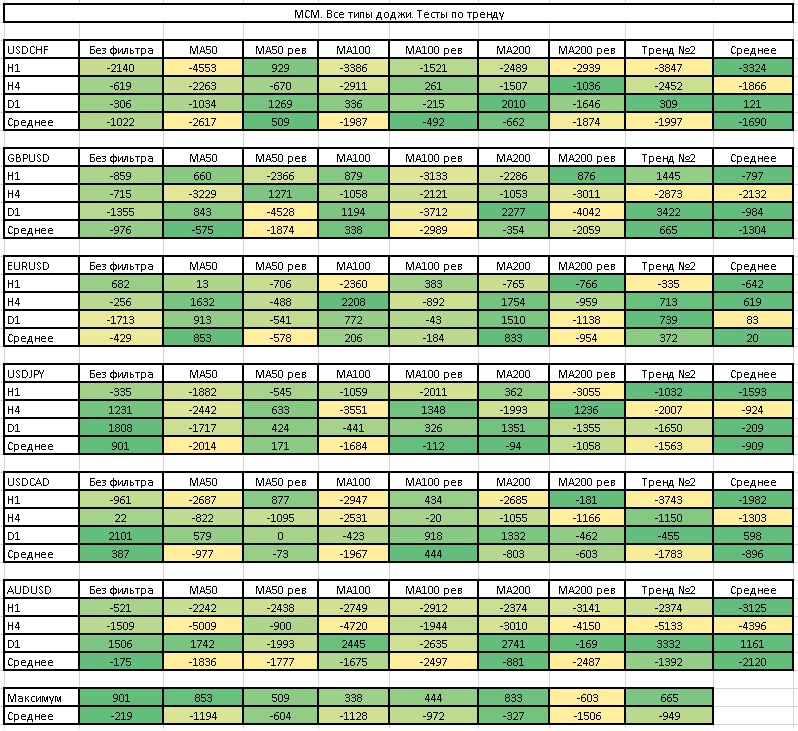 And again, the best indicator of the presence of a trend is the position of price relative to the moving average. At the same time, it is best to use moving average periods of 100 and 200. Despite the fact that we again observe individual preferences for each pair and period, in general we can say that working with patterns in the direction of the trend really improves the final result.
Oscillator tests are not conducted, since this pattern is a trend one.
Pattern Test

This is what trading the pattern on the H1 period looks like for the currency pairs we are considering:
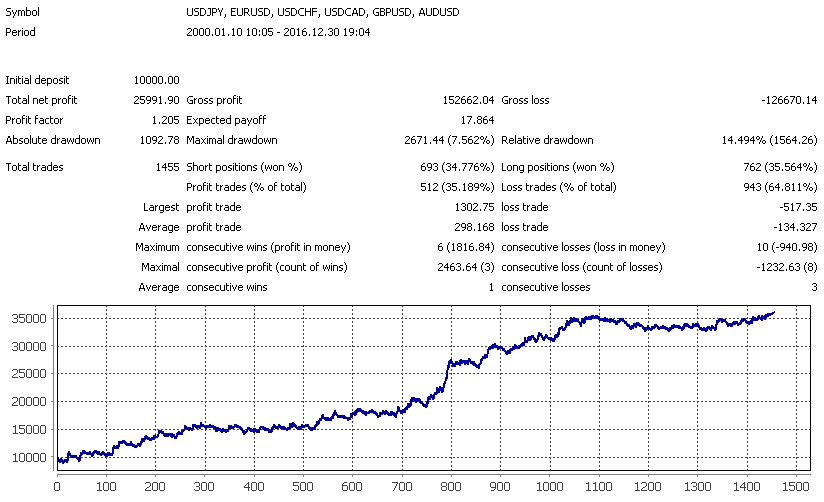 If we replace the standard stop by the candle shadow with a stop based on the ATR indicator, we get the following result:
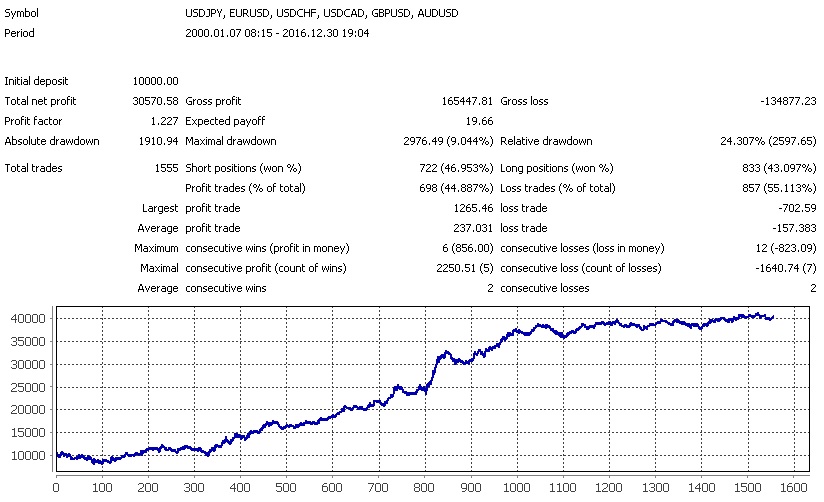 We can also add a trailing stop by candle shadows to the trading system - we will trail our initial stop loss behind the price by the candle shadows:
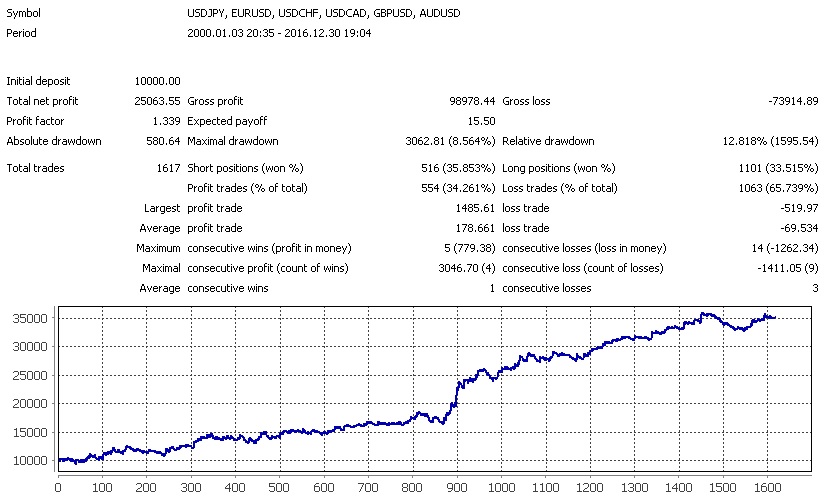 And here is what happens if we use the opposite signal to exit the position:
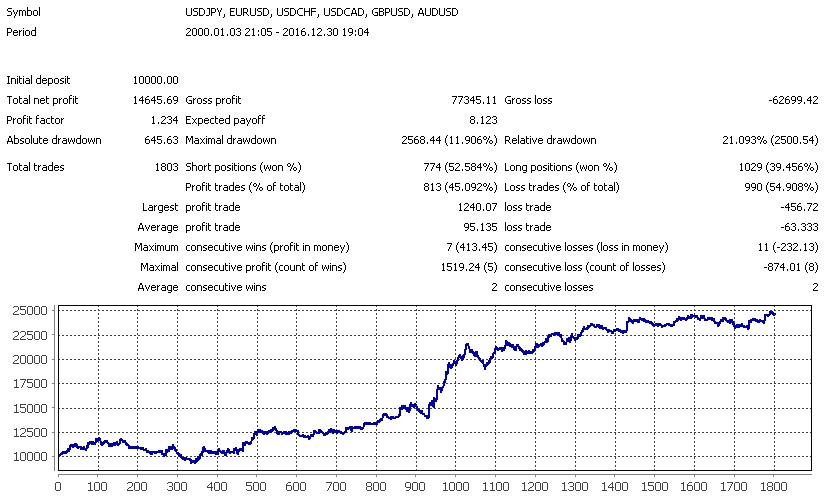 As can be seen from the tests, the best signal is achieved when setting a stop loss at the level of 2-4 ATR from the entry price and using the set-and-forget strategy. Both the use of a trailing stop and the exit condition based on the reverse signal only spoiled our statistics.
Now let us look at trading on the H4 period:
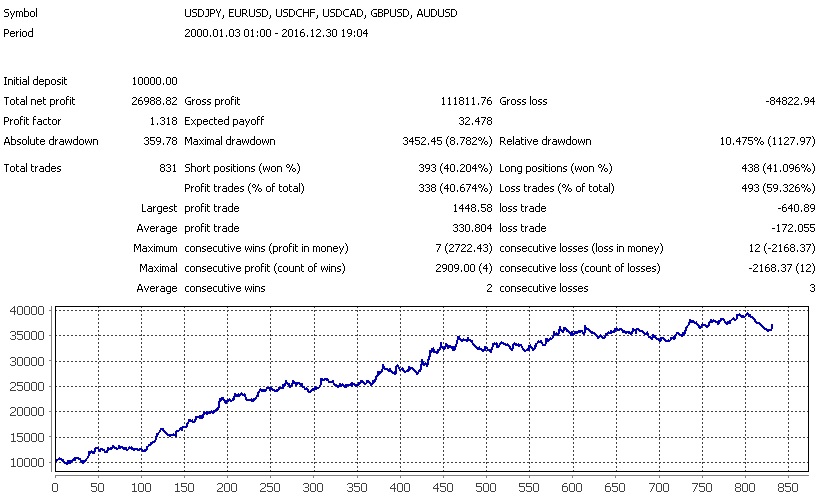 Let us apply 2-4 ATR stops:
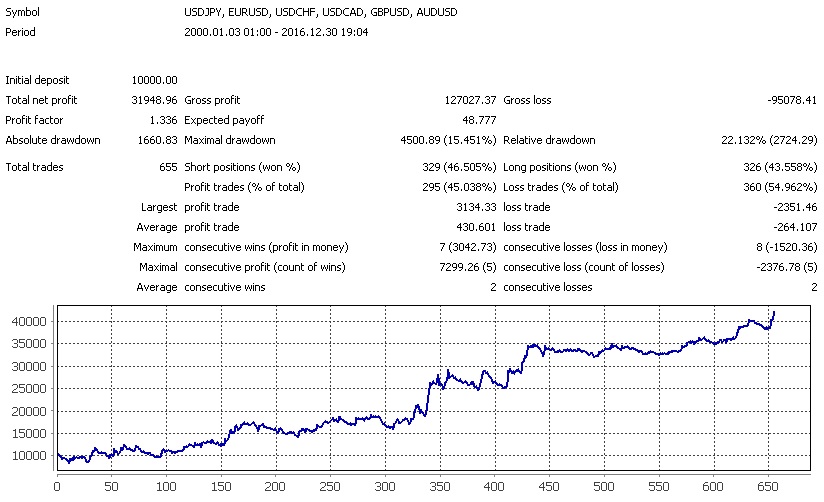 Let us add a trailing stop:
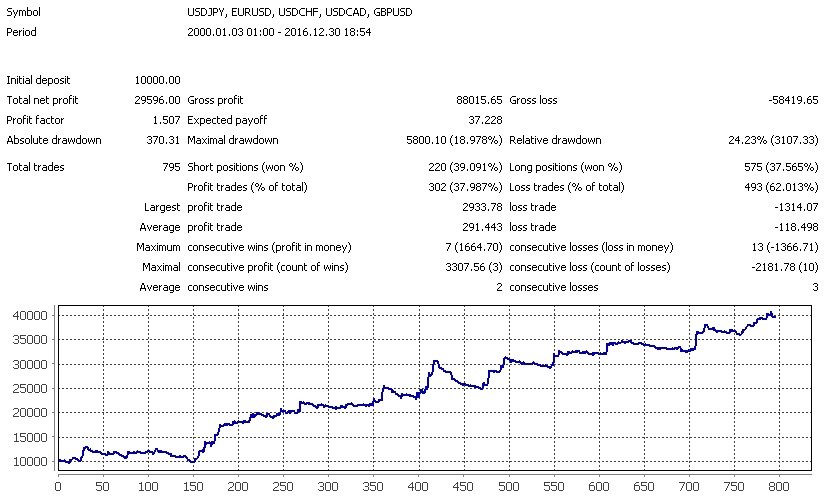 Now let us add an exit condition based on the opposite signal:
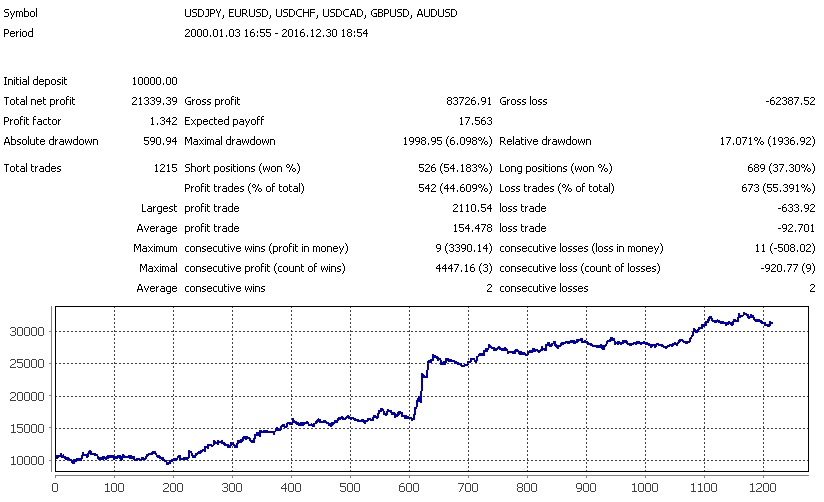 The best option again is when applying an ATR-based stop without interfering with the course of the trade.
Conclusions

We found out that there is no strong difference in which type of doji candle is used in this pattern. On some instruments the doji star works a little better, on others the gravestone doji, and so on. In addition, the classic 1 to 3 ratio is not suitable for all instruments. The optimal profit-to-loss ratio in this pattern varies from 1 to 2 to 1 to 6 depending on the instrument and period. At the same time, both relying on levels and trading with the trend improve trading results. It is best to use the good old MA100 both as a level and as a trend indicator. And the best oscillator for filtering signals turned out to be Stochastic. As can be seen from the summary tests carried out, the pattern really works, the methods of filtering the signal by trend, by levels, and by oscillators also work, however, each currency pair and each timeframe requires its own approach. As for trade management, it is clearly visible that a trailing stop by candle shadows works well only on periods from H4 and above. Exiting on the opposite signal also proved effective on the H4 period and above. But placing stop loss orders below or above the candle shadow turned out to be ineffective. The ATR indicator multiplied by a coefficient from 2 to 4 is much better suited for determining the stop level.
Price Action Inside Bar Pattern in Trend

Frequency of occurrence of the IB pattern
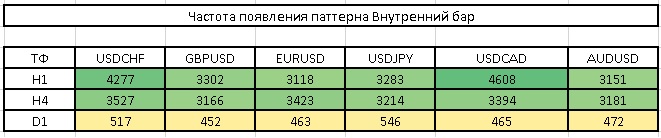 As can be seen, this pattern is a fairly frequent occurrence even on daily charts.
Predictive efficiency test
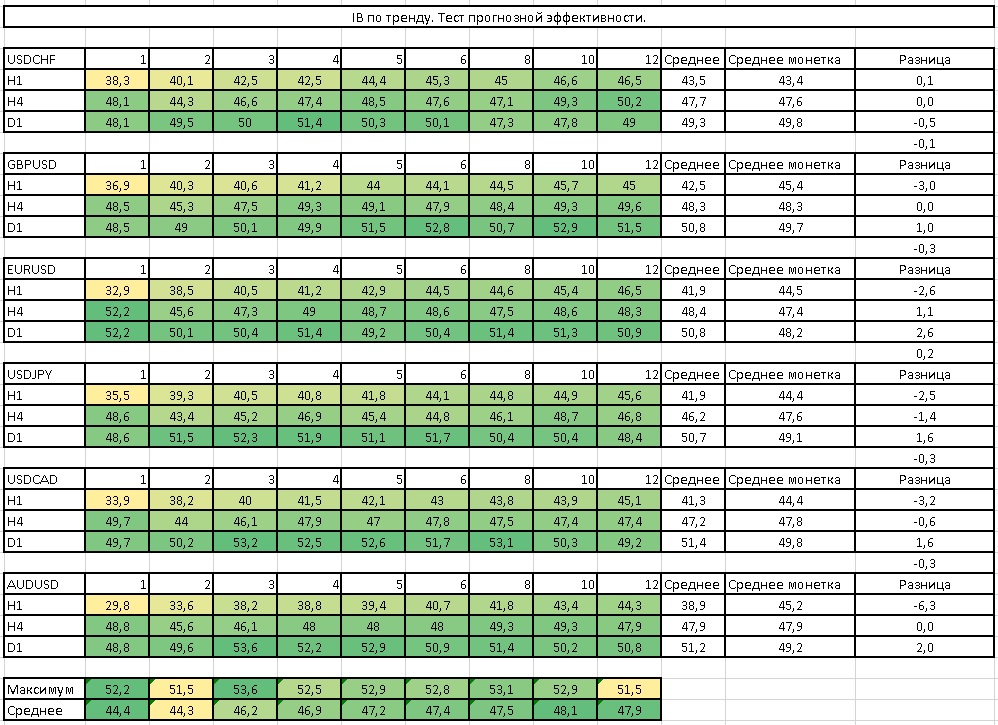 On the H4 period and above, the price direction determined by the appearance of the pattern is slightly better than a coin toss.
Risk/Reward test
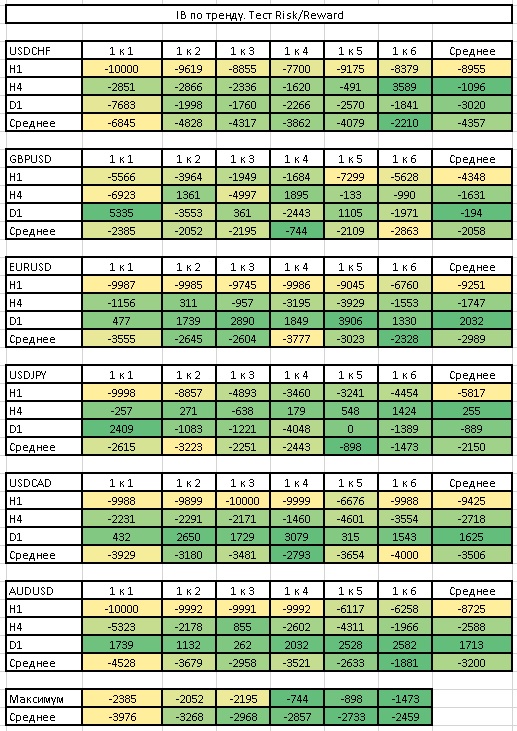 Profit-to-loss ratios from 1 to 3 and higher perform better.
Round levels test
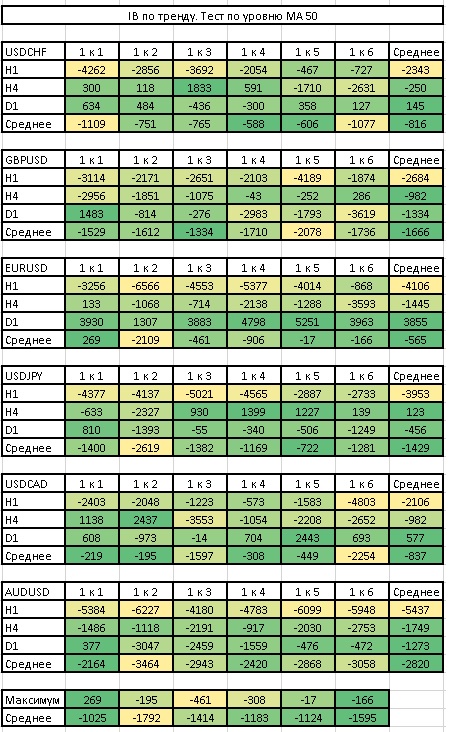
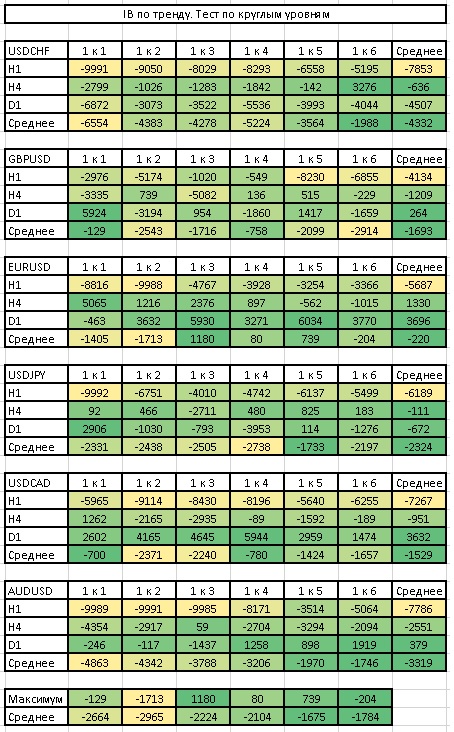 MA 50 level test
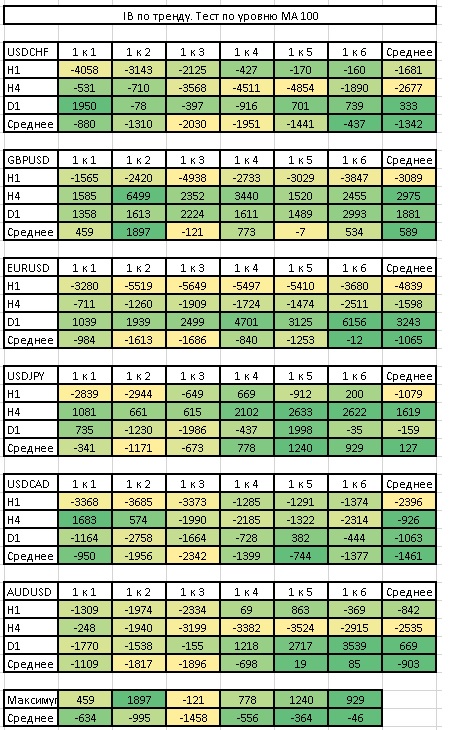
 MA 100 level test
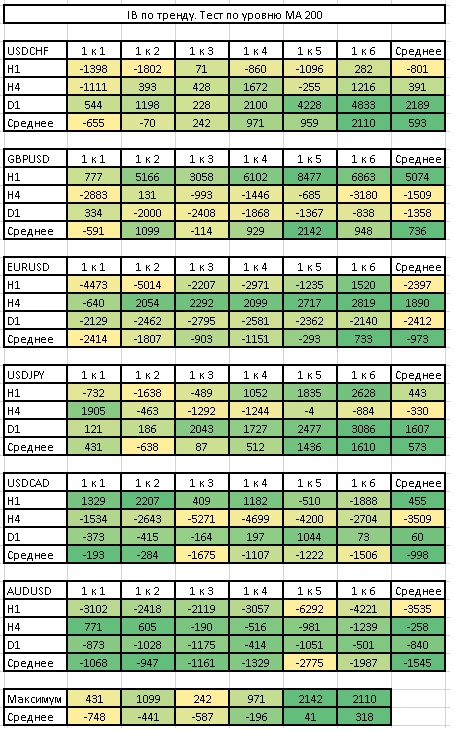
 MA 200 level test
 Tests by levels, summary table
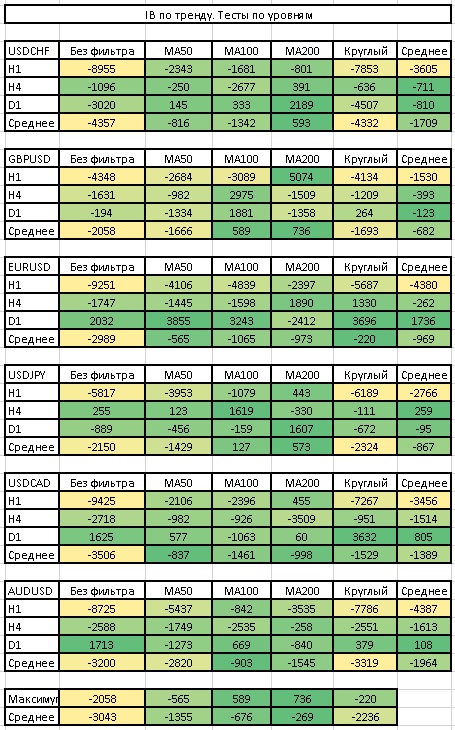 From the summary table it is clear that it would be optimal to use MA100 and MA200 as the level.
MA50 trend test
 MA50 trend test (reversal)
 MA100 trend test
 MA100 trend test (reversal)
 MA200 trend test
 MA200 trend test (reversal)
 Trend test No. 2
 Trend tests, summary table
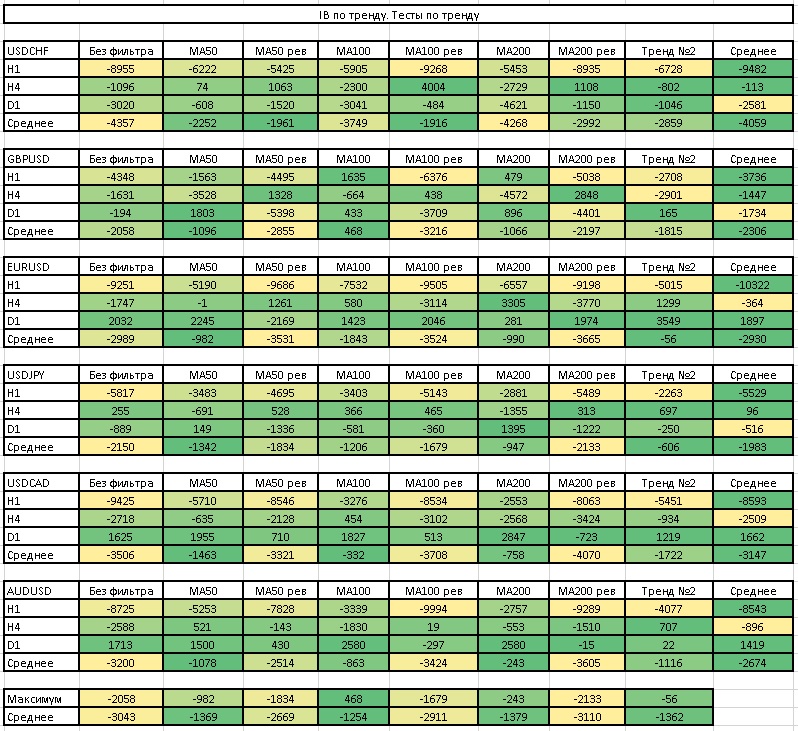 In most cases, taking the trend direction into account in trading improves the final result.
Pattern test

This is what trading the pattern on the H1 period looks like on the currency pairs we are considering:
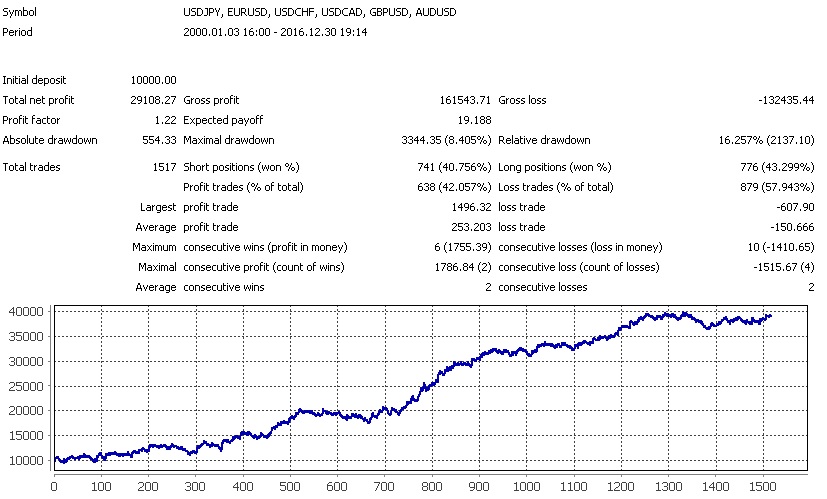 If we replace the standard stop by the candle shadow with a stop by the ATR indicator, we will get the following result:
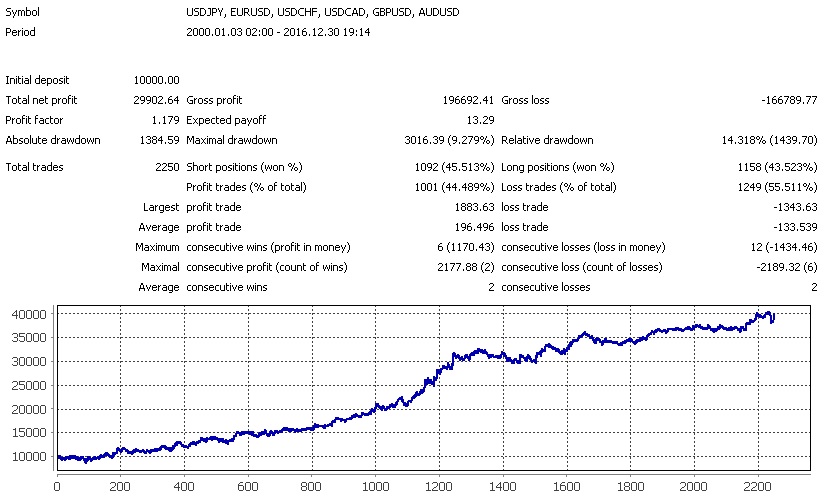 You can also add a trailing stop by candle shadows to the trading system: we will pull our initial stop loss behind the price by the candle shadows:
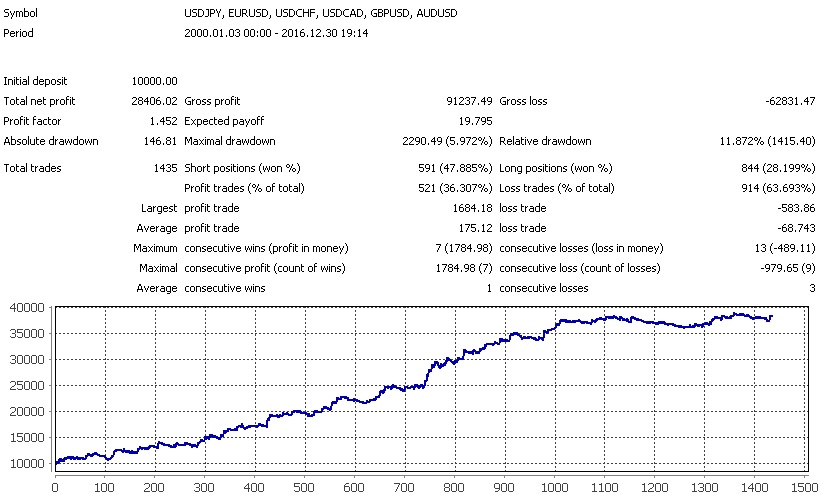 And here is what happens if you use the opposite signal to exit the position:
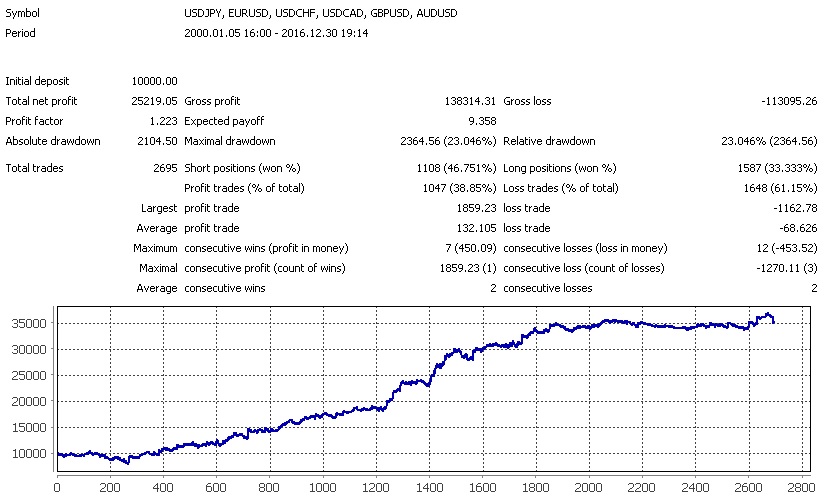 As tests show, the best signal is achieved when the stop-loss is set at 2-4 ATR from the entry price and with a "set and forget" strategy. Both the use of a trailing stop and the exit condition on the opposite signal only worsened our statistics.
Now let us look at trading on the H4 period:
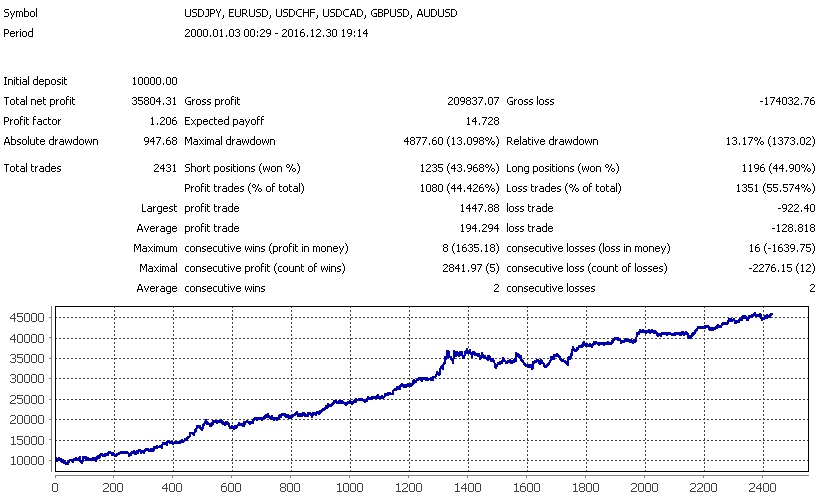 Let us apply 2-4 ATR stops:
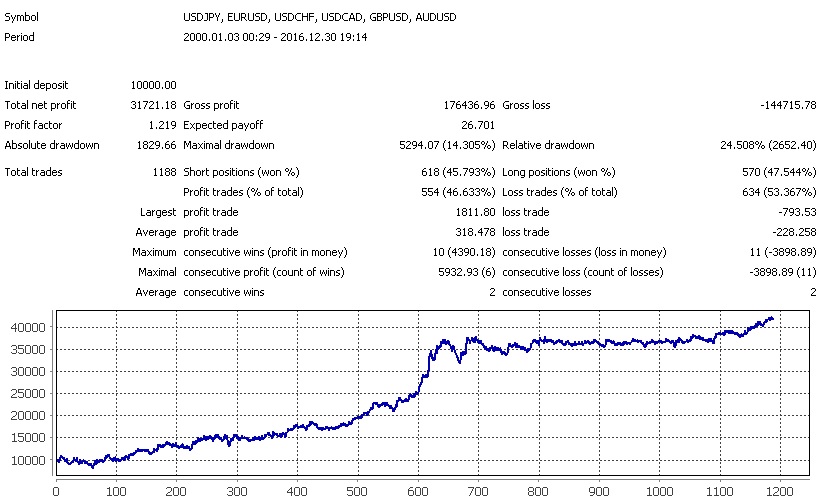 Let us add a trailing stop:
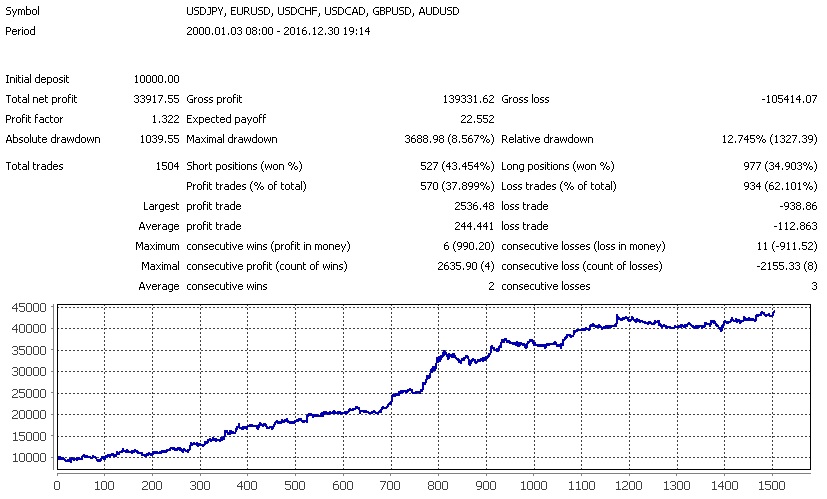 Now let us add an exit condition based on the opposite signal:
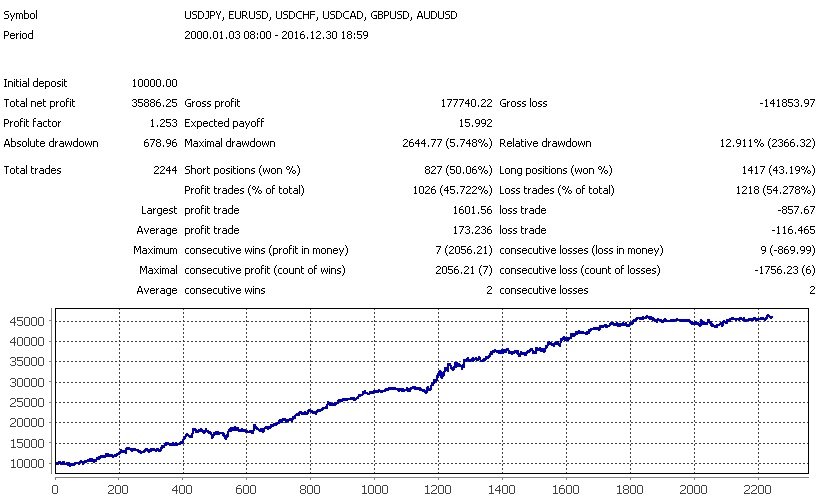 It is clear that this time the trailing stop and the exit on the opposite signal improved our trading.
Conclusions

For the inside bar pattern, as for all the previous ones, all the classic advice remains true - trade with the trend, look for levels, and keep the risk-to-reward ratio above 1 to 2.
Price Action Inside Bar Pattern Against the Trend
IB pattern occurrence frequency
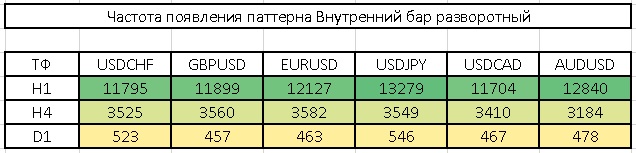 The pattern appears quite often
Predictive efficiency test
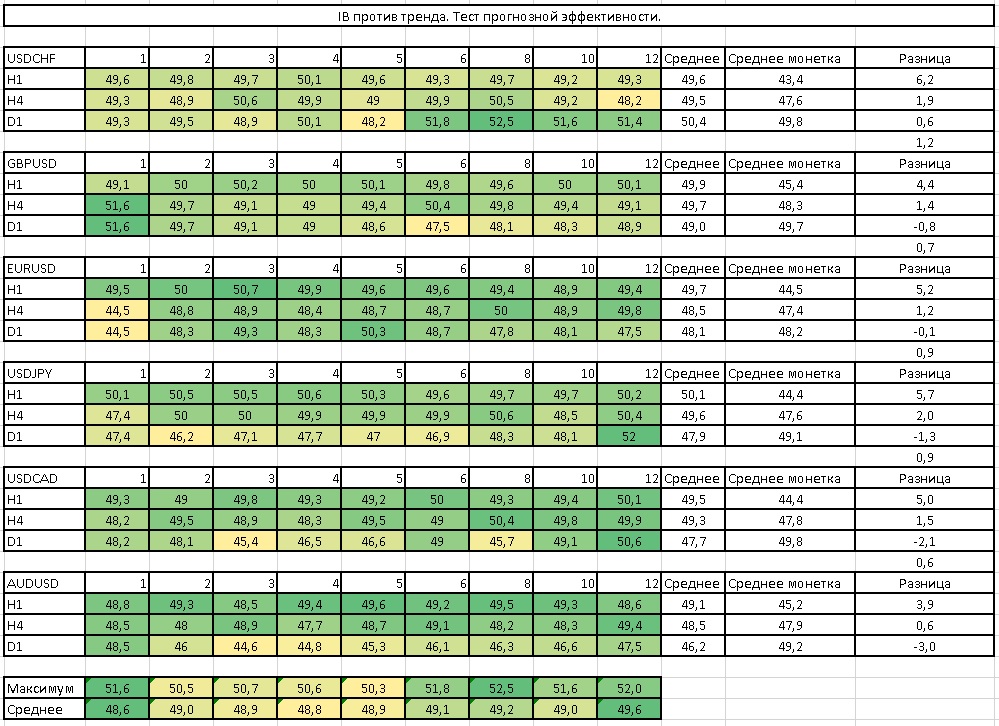 Even hourly timeframes for this pattern show results that are fairly better than a coin toss.
Risk/Reward test
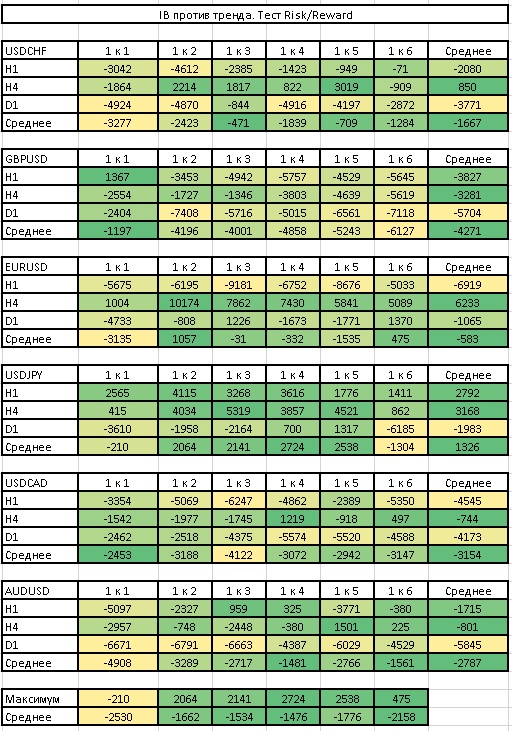 Everything is as usual here. Only the GBPUSD pair was surprising, showing the best results with a profit-to-risk ratio of 1 to 1.
Round levels test
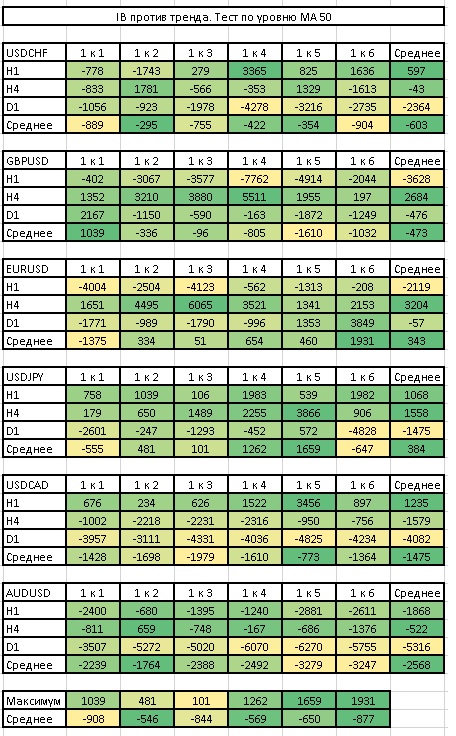
 MA 50 level test
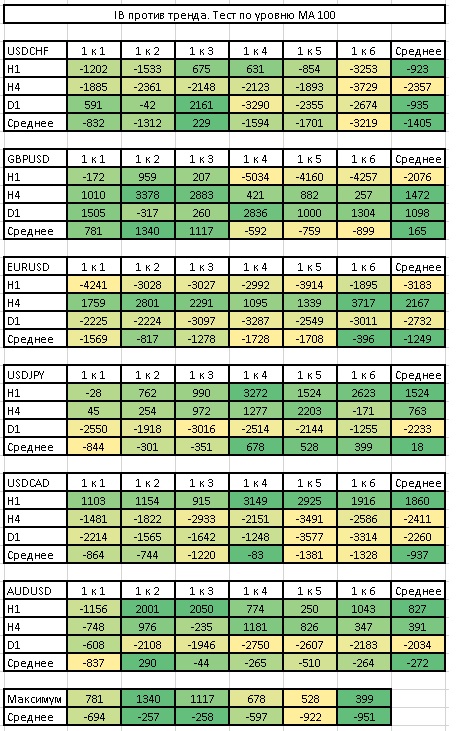
 MA 100 level test
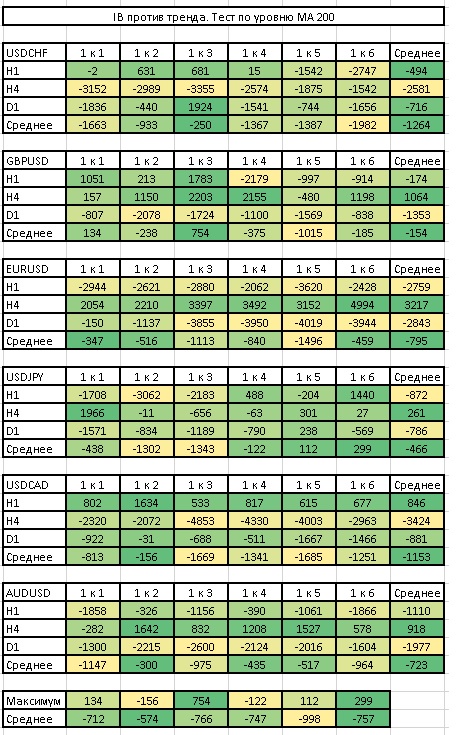
 MA 200 level test
 Level tests - summary table
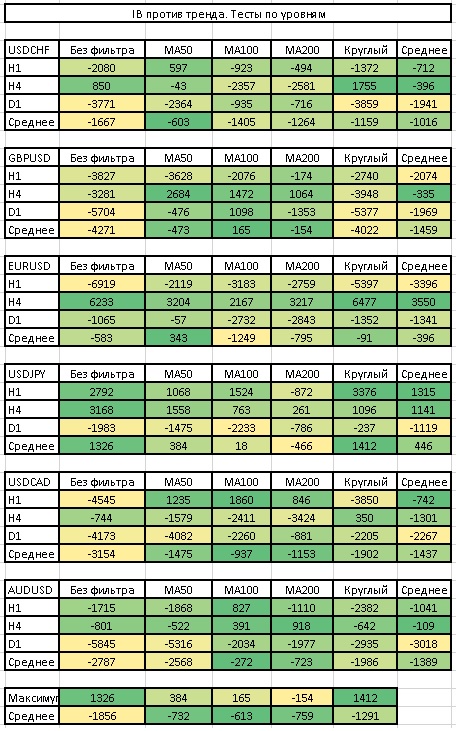 Not all pairs respect levels, but in general the best ones are MA100 and MA200. Traditionally, the yen and the Canadian dollar ignore levels.
MA50 trend test
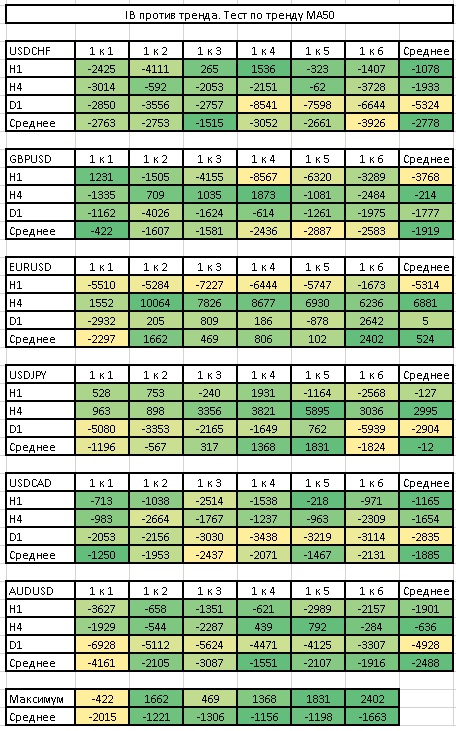 MA50 trend test (reverse)
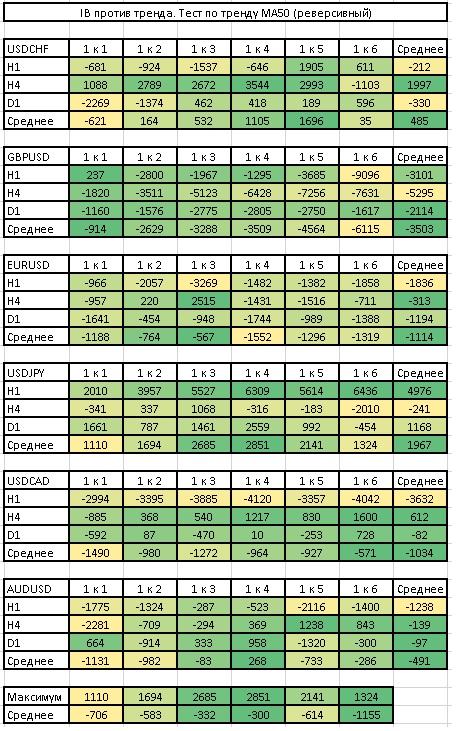 MA100 trend test
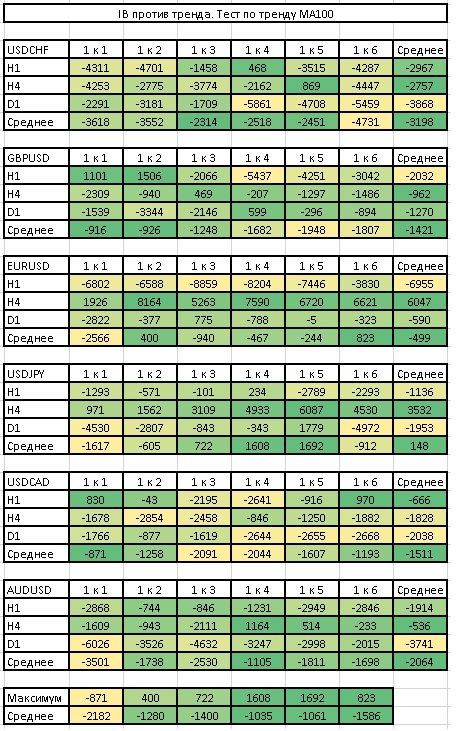 MA100 trend test (reverse)
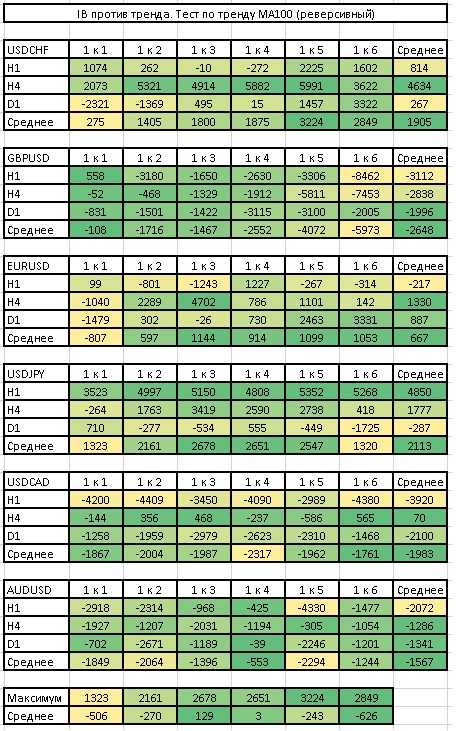 Trend Test MA200
 Trend Test MA200 (reversal)
 Trend Test No. 2
 Trend Tests - summary table
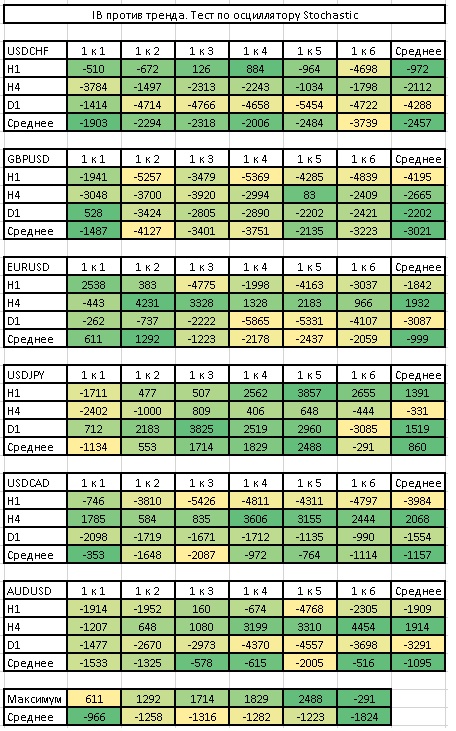
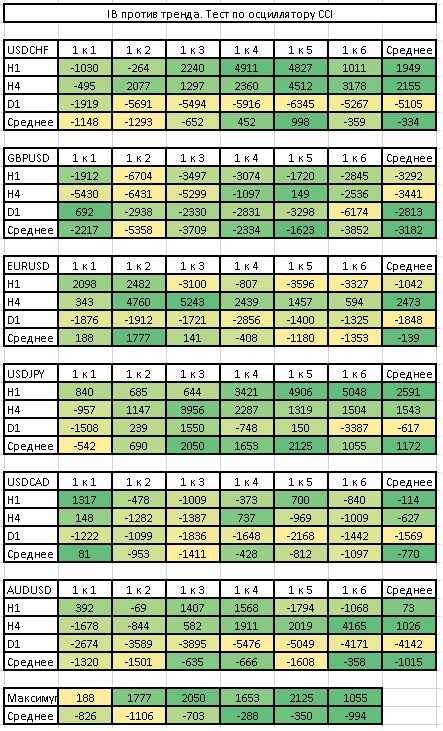
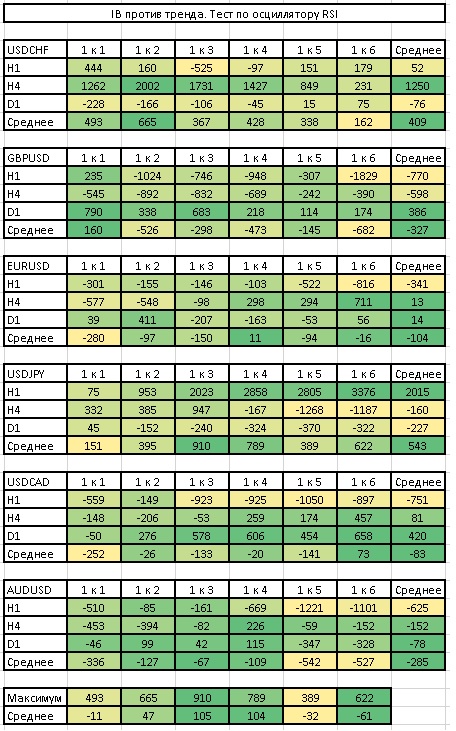
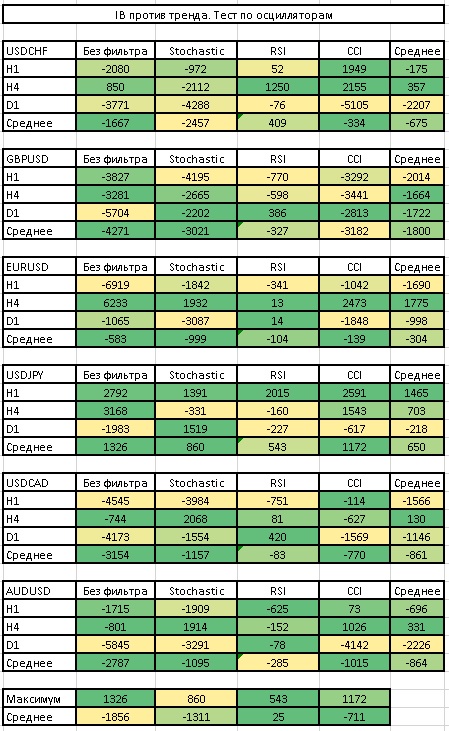
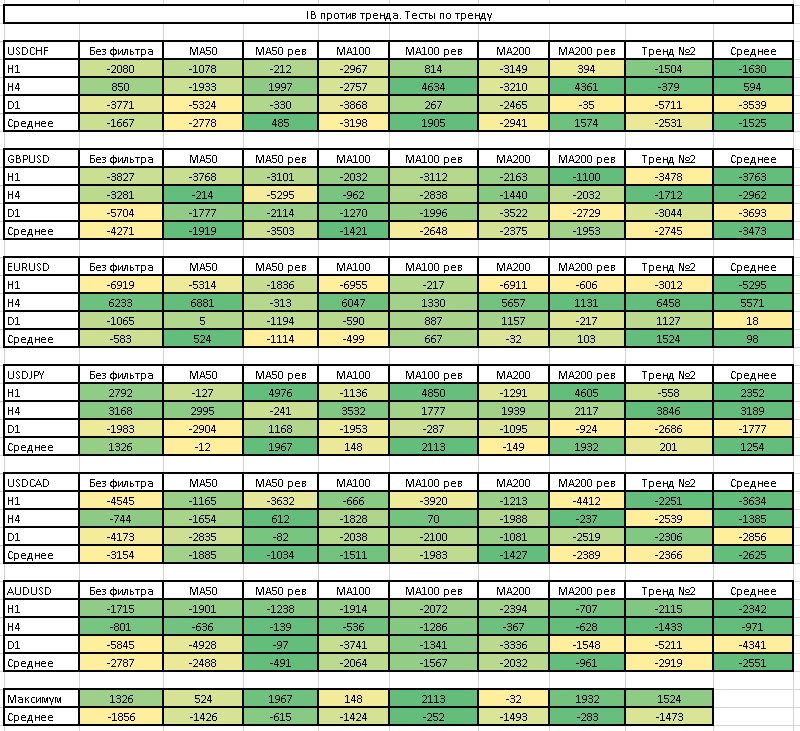 This table once again proves to us that any level is better than no level at all.
Stochastic oscillator test
 CCI oscillator test
 RSI oscillator test
 Oscillator tests - summary table
 Pattern test

This is what trading the pattern on the H1 period looks like on the currency pairs we are considering:
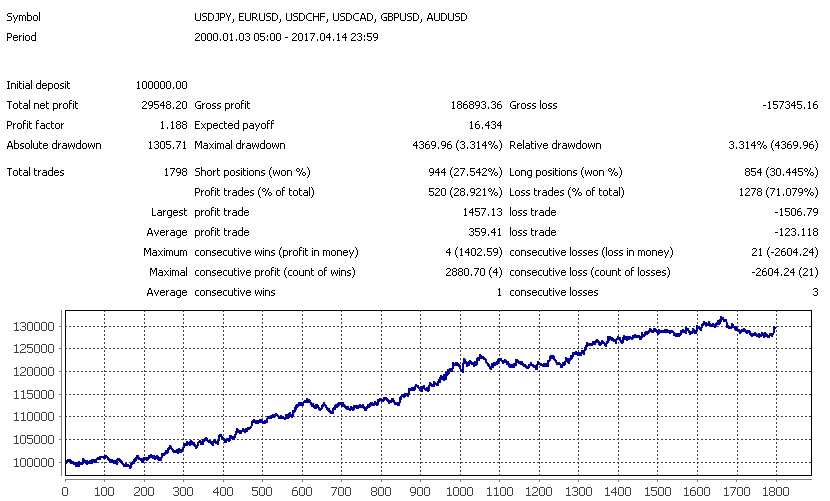 If you replace the standard stop by the candle shadow with a stop based on the ATR indicator, you get the following result:
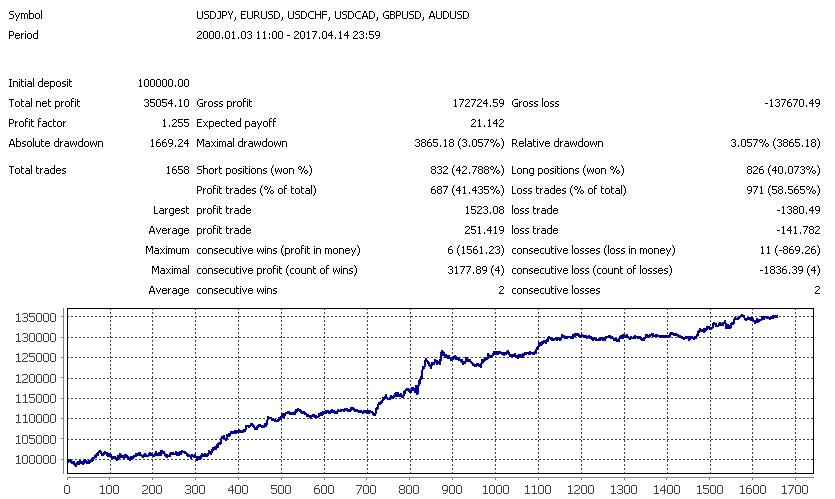 You can also add a trailing stop based on candle shadows to the trading system - we will pull our initial stop loss along behind the price using the candle shadows:
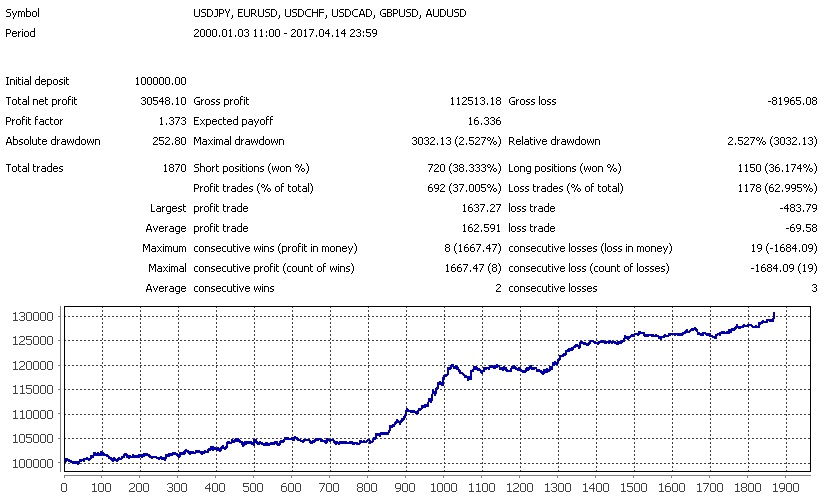 And here is what happens if you use the opposite signal to exit the position:
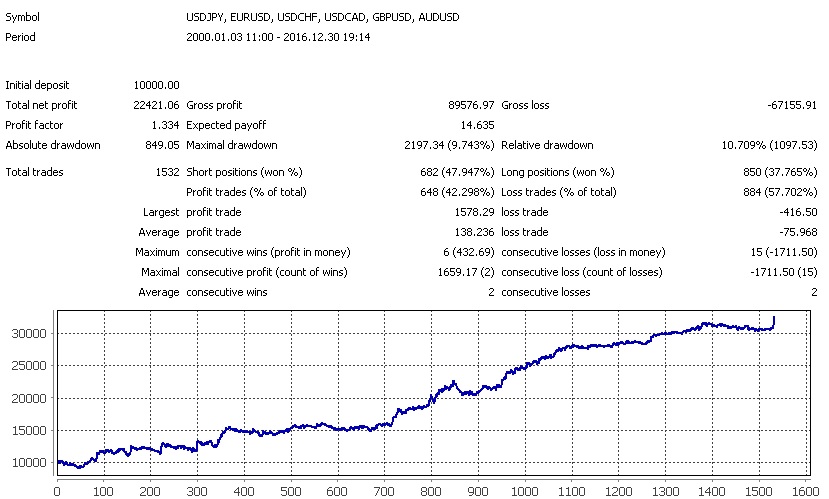 This time, the use of an ATR stop, trailing stop, and exit improved the quality of trading.
Now let's look at trading on the H4 period:
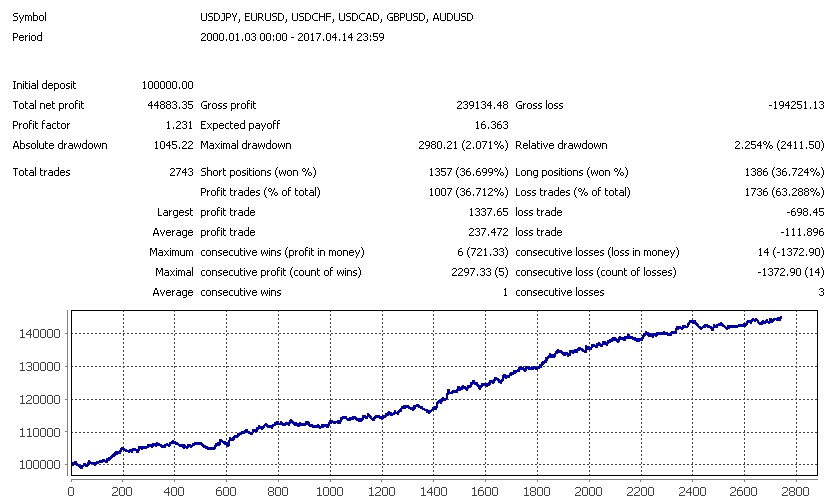 Let's apply stops of 2-4 ATR:
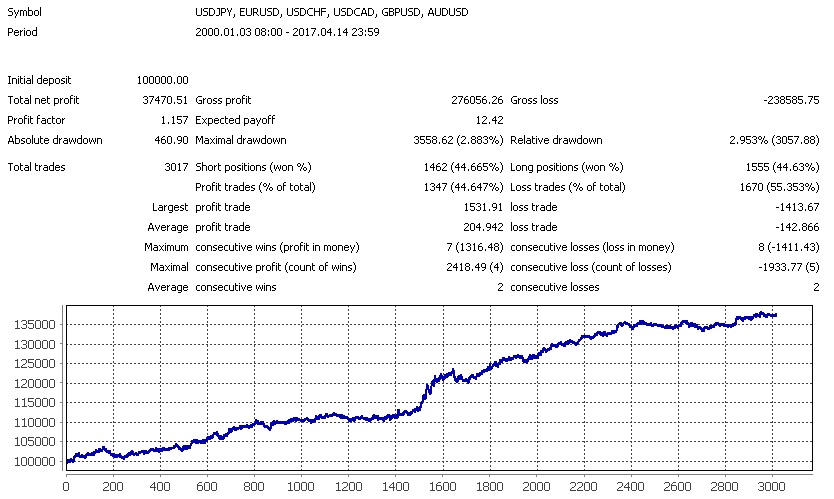 Let's add a trailing stop:
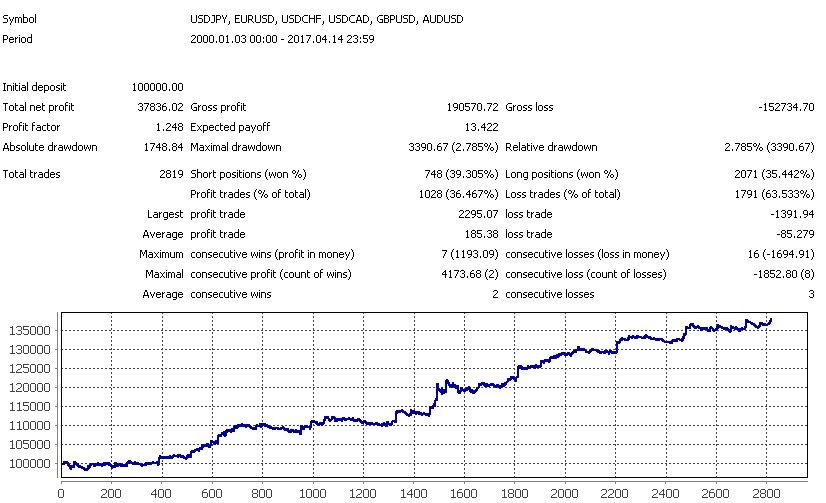 Now let's add an exit condition on the reverse signal:
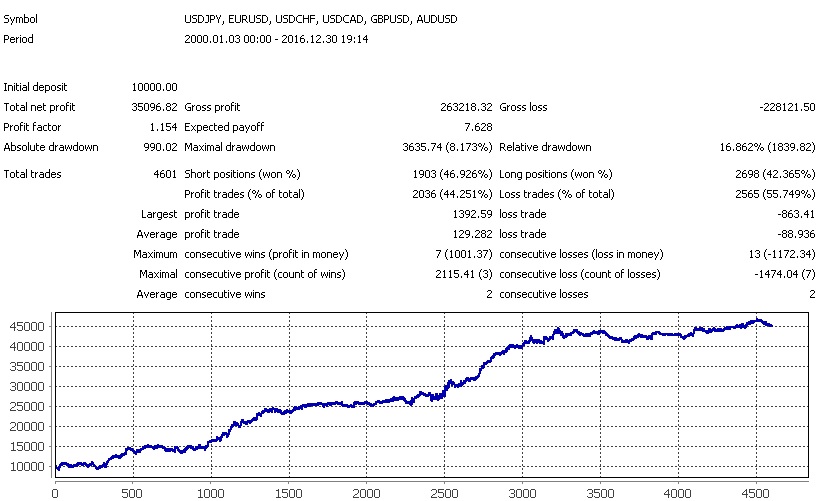 This time, the best results came from applying the standard approach. Both the ATR stop, the trailing stop, and the exit on the reverse signal only worsened the result.
Conclusions

Once again, we have become convinced of the steadfastness of the main recommendations when trading candlestick patterns. Overall, the inside bar pattern gives quite good results.
Price Action Outside Bar Pattern
Frequency of occurrence of the OB pattern
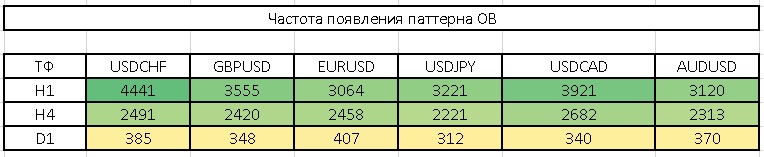 The OB pattern is a fairly common occurrence on any timeframe.
Predictive effectiveness test
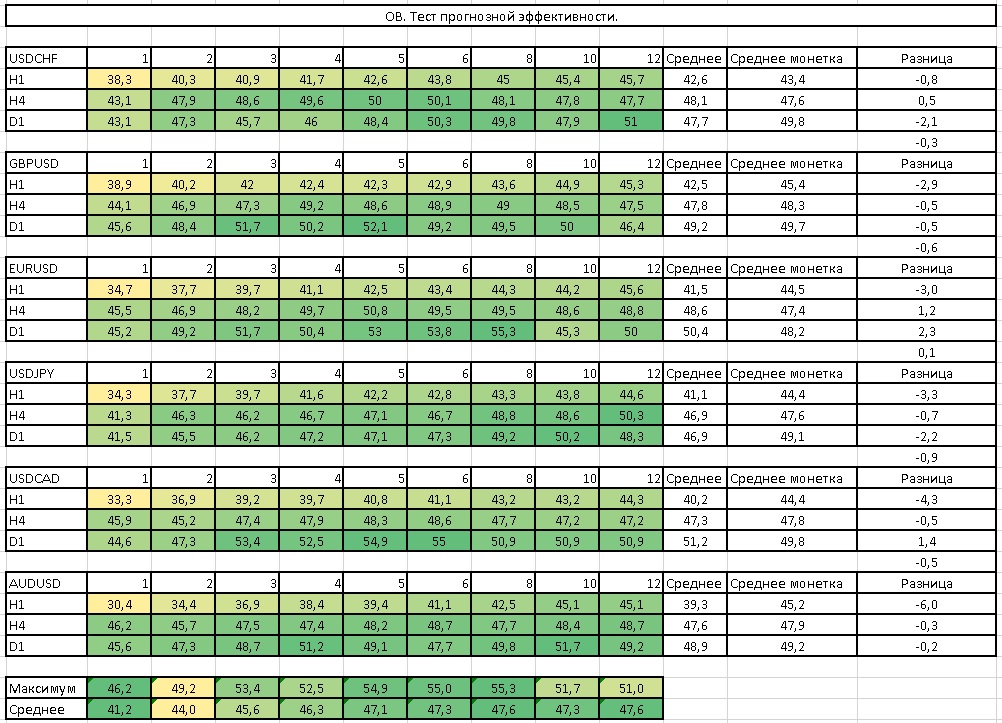 The pattern's effectiveness at predicting the future price direction is slightly worse than a coin toss.
Risk/Reward test
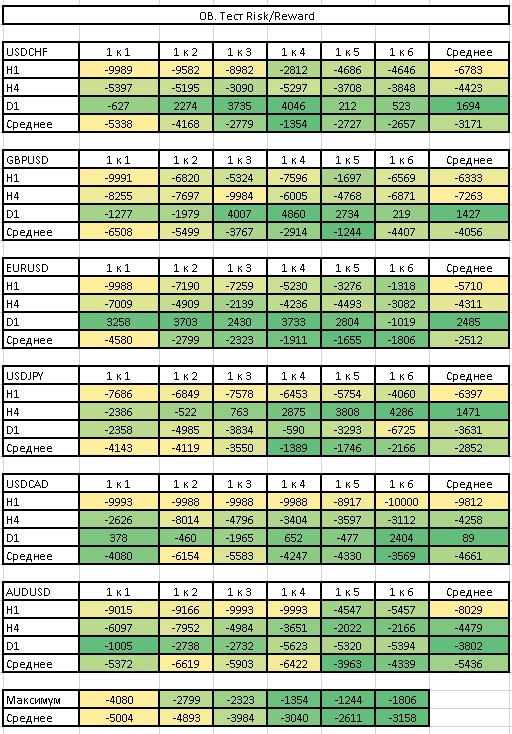 It is best to use a profit-to-loss ratio of at least 1 to 3 for the OB pattern.
Round levels test
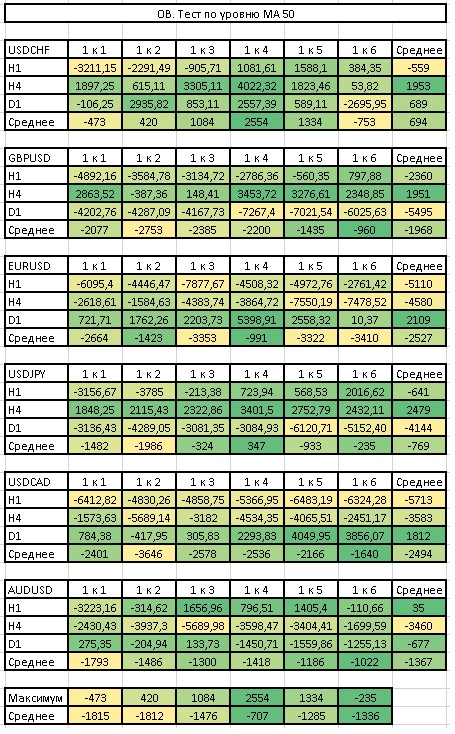
 Test at the MA 50 level
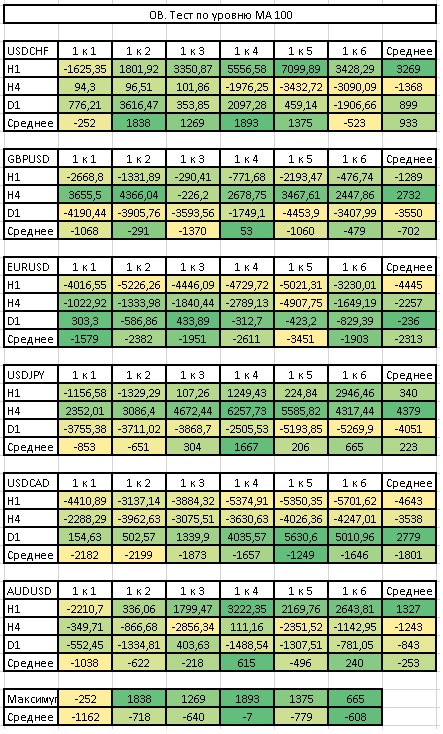
 Test at the MA 100 level
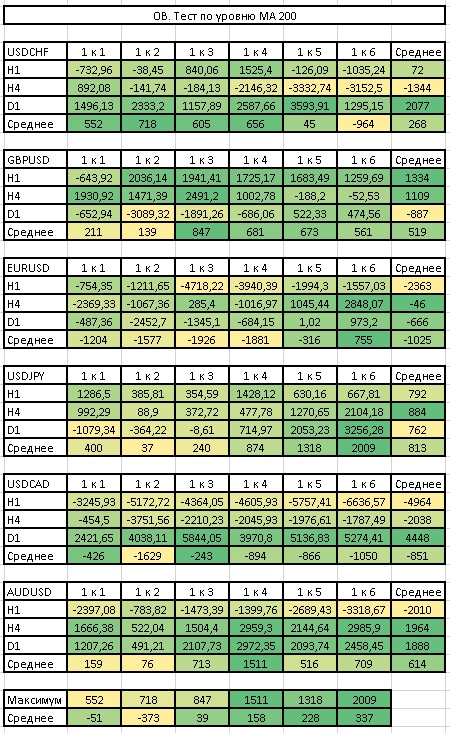
 Test at the MA 200 level
 Level tests - summary table
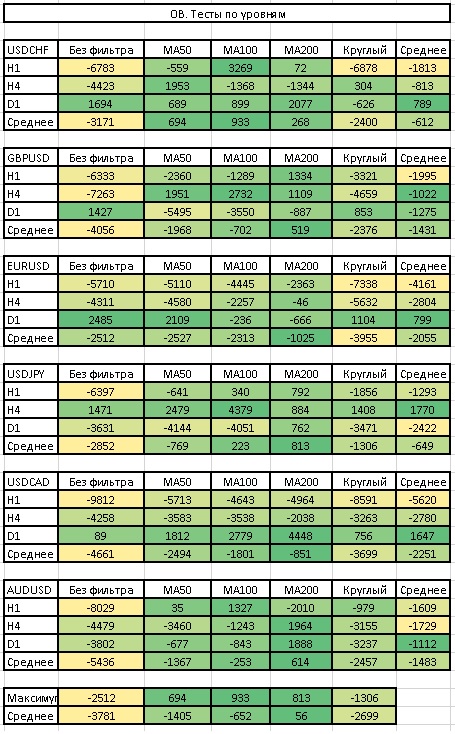 Any type of level for this pattern turned out to be a fairly effective filter.
MA50 trend test
 MA50 trend test (reversal)
 MA100 trend test
 MA100 trend test (reversal)
 MA200 trend test
 MA200 trend test (reversal)
 Trend test No. 2
 Trend tests - summary table
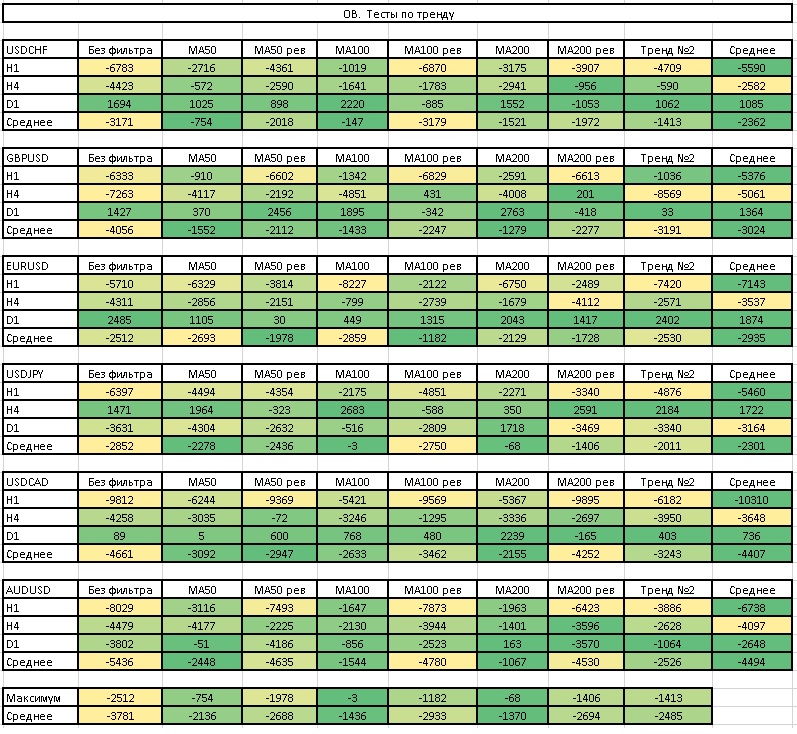 The OB pattern should definitely be taken in the direction of the main trend.
Pattern test

This is what trading the pattern looks like on the H1 period on the currency pairs we are considering:
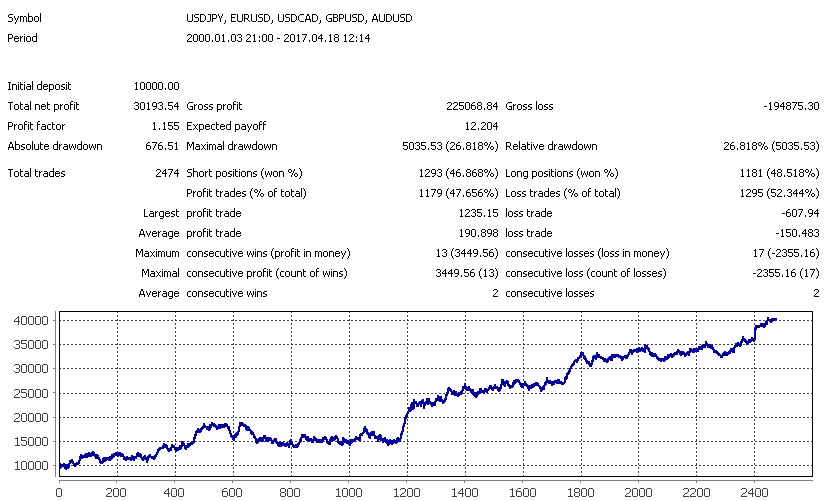 If we replace the standard stop at the candle shadow with an ATR-based stop, we get the following result:
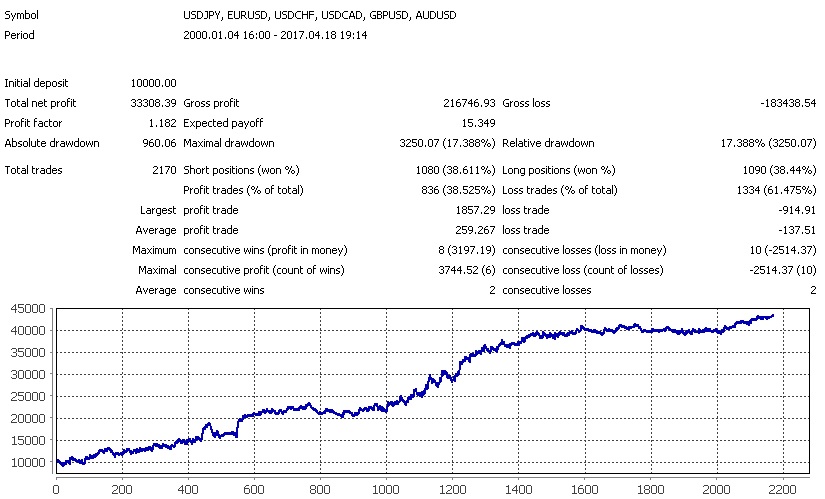 You can also add a trailing stop by candle shadows to the trading system - we will pull our initial stop-loss after the price by the candle wicks:
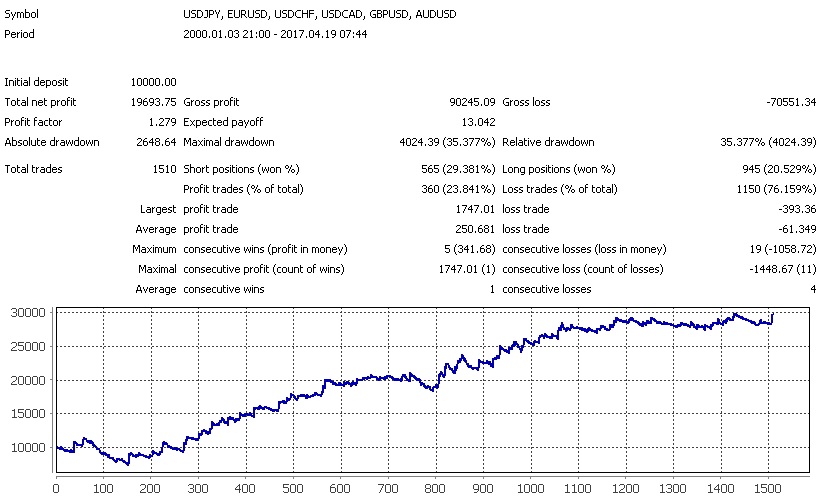 And here is what happens if you use the opposite signal to exit the position:
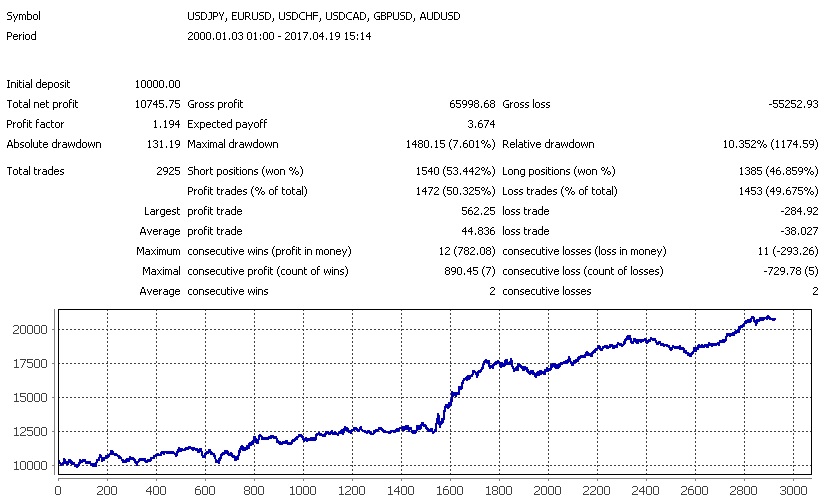 On hourly charts, the OB pattern works best with a trailing stop and a stop-loss set according to ATR readings.
Now let's look at trading on the H4 period:
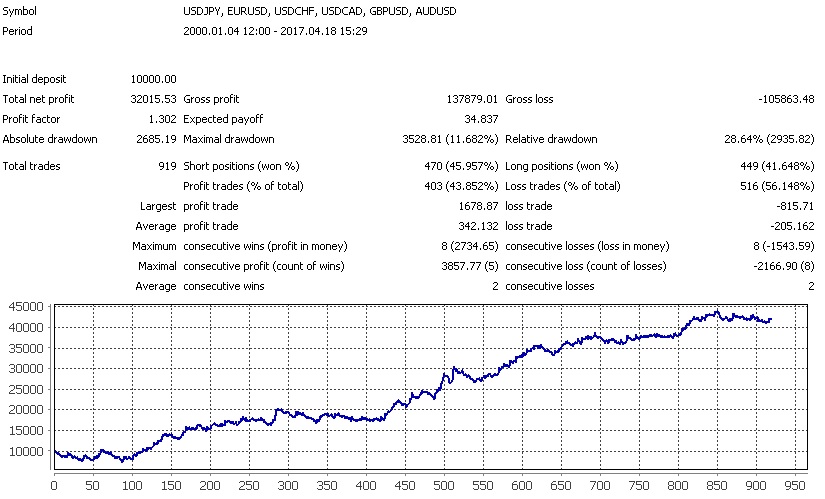 Let's apply stops of 2-4 ATR:
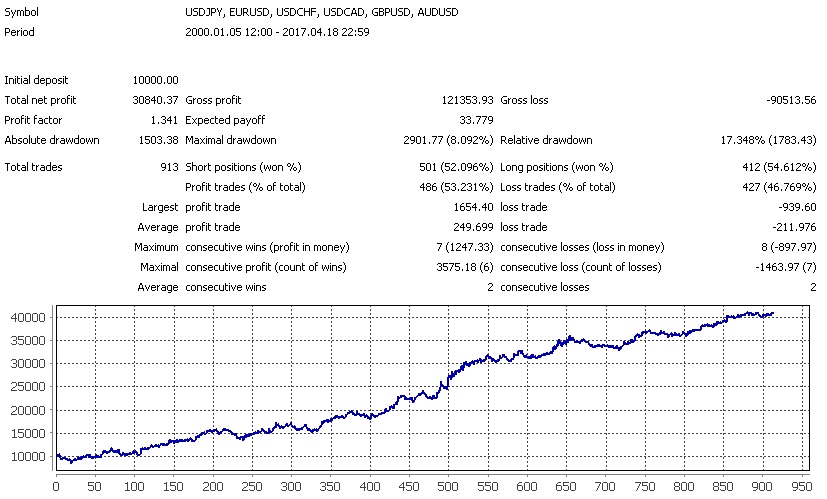 Let's add a trailing stop:
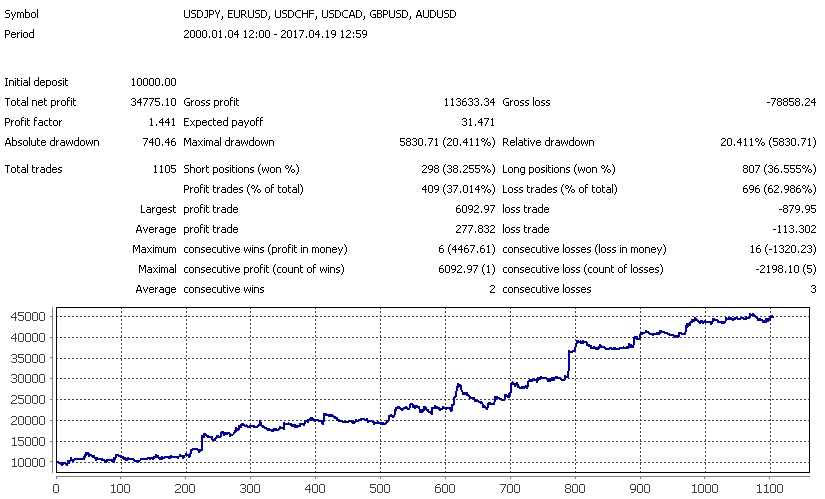 Now let's add an exit condition on an opposite signal:
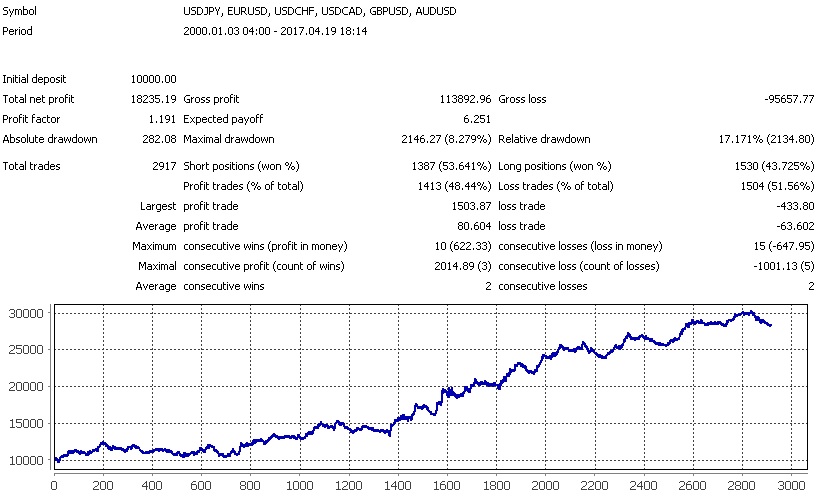 The same applies to the H4 period - the best result comes from using a trailing stop and an ATR stop.
Conclusions
The Outside Bar pattern performs quite well on any period, especially if, when trading it, active management of the open position is applied.

Price Action Pin Bar Pattern
Frequency of the Pinbar pattern appearance
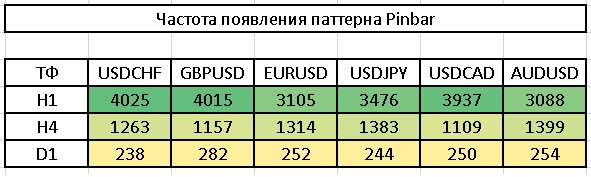 A good pinbar appears on the chart a little less often than OB, and yet it is one of the most frequently occurring PA patterns.
Predictive effectiveness test
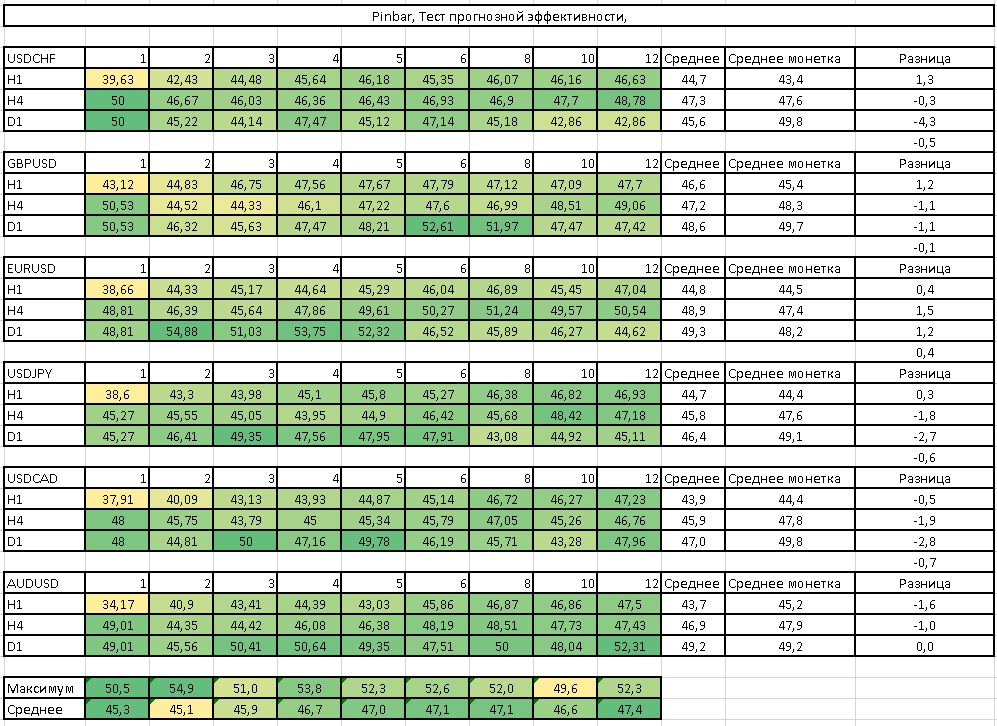 On average, the predictive effectiveness of the pinbar pattern is no better than a simple coin toss.
Risk/Reward test
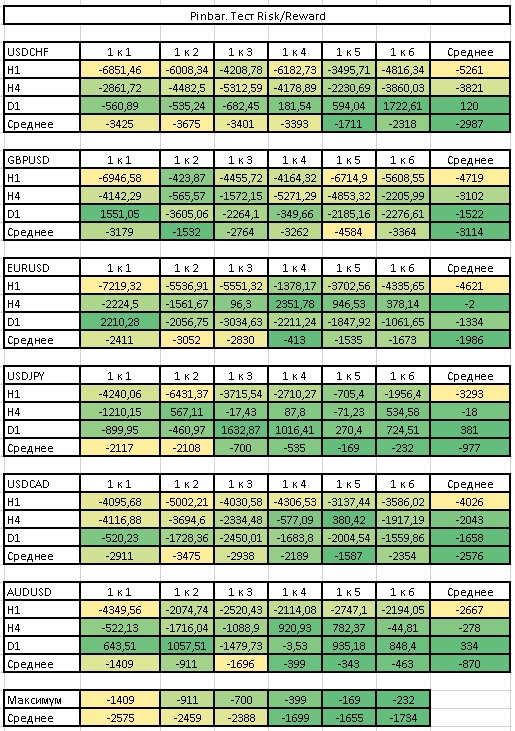 Based on the information in the table, once again an effective Risk/Reward should be no less than 3 to 1.
Round levels test
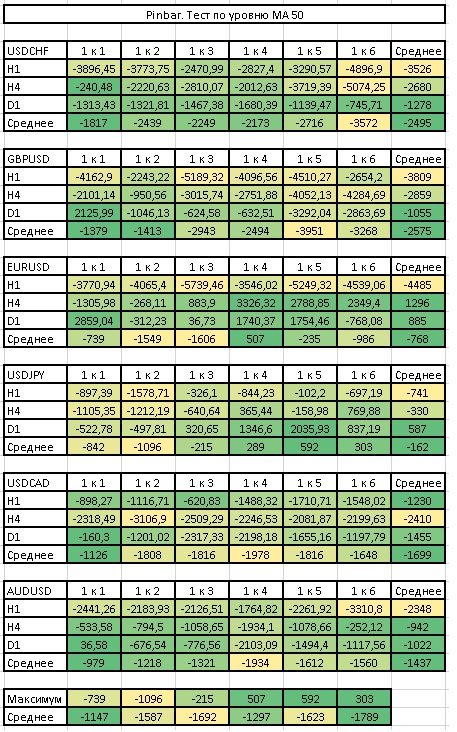
 MA 50 level test
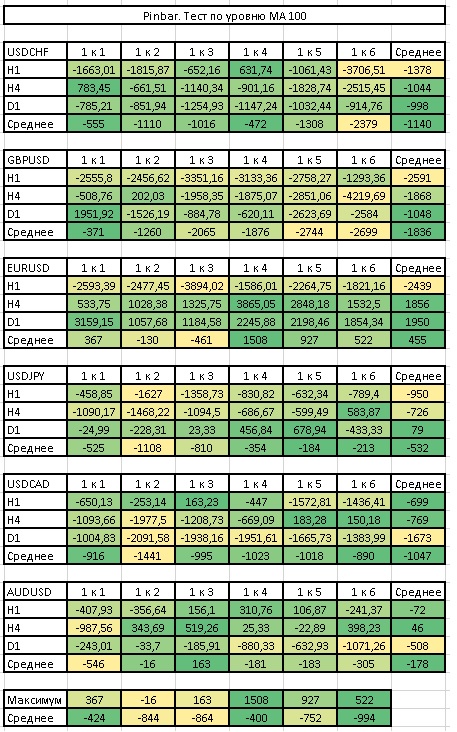
 MA 100 level test
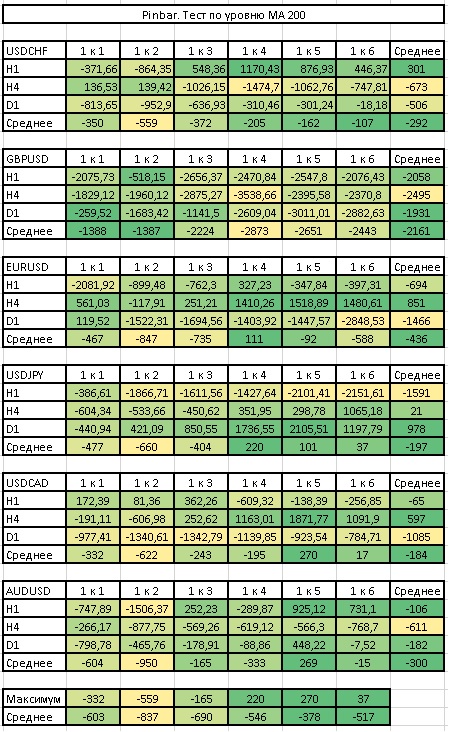
 MA 200 level test
 Level tests - summary table
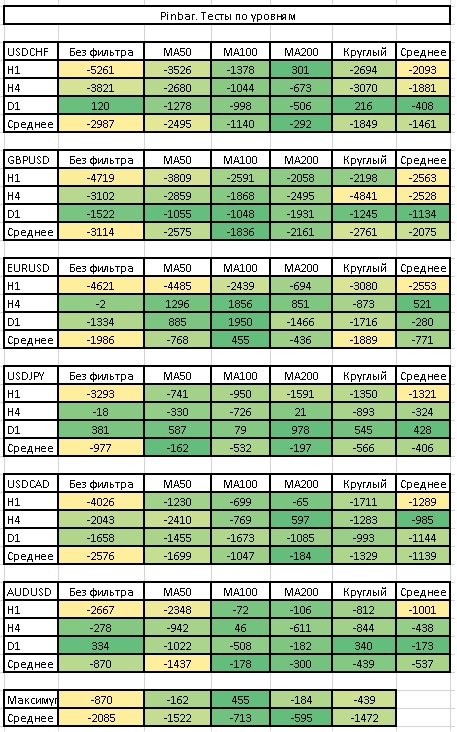 The pinbar pattern is perfectly complemented by dynamic levels in the form of MA100 and MA200. And round levels are not so bad either.
MA50 trend test
 MA50 trend test (reversal)
 MA100 trend test
 MA100 trend test (reversal)
 MA200 trend test
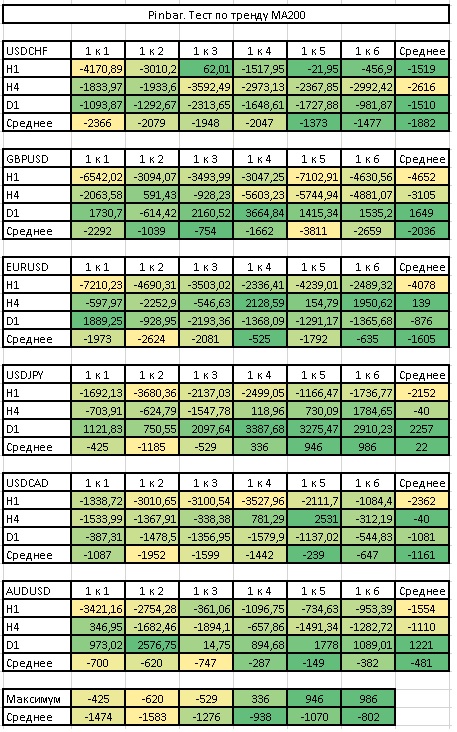 MA200 trend test (reversal)
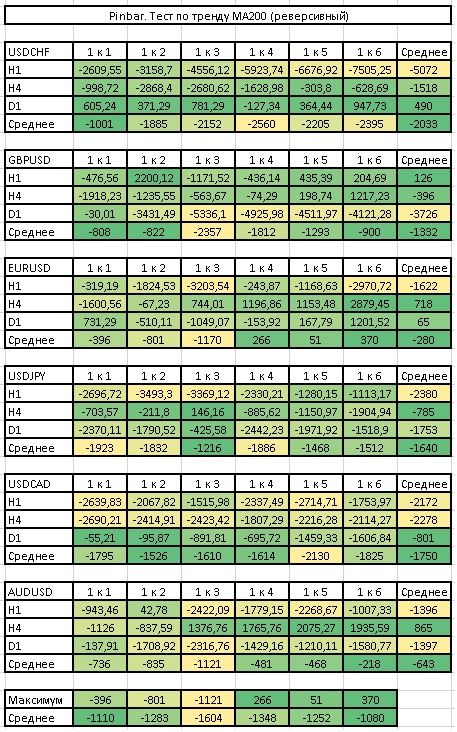 Trend test No. 2
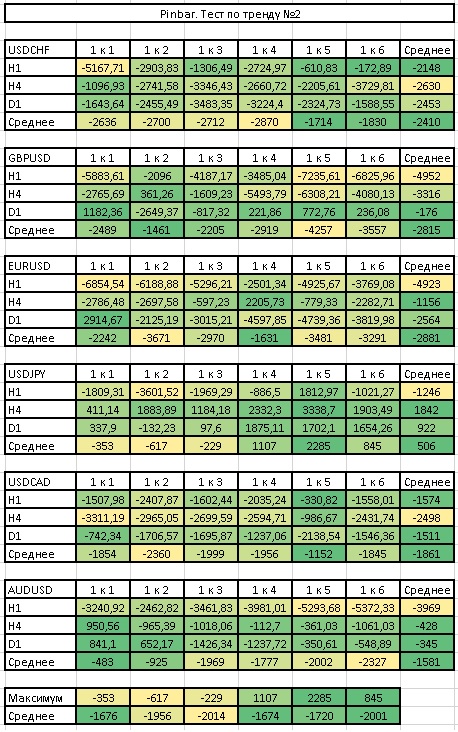 Trend tests summary table
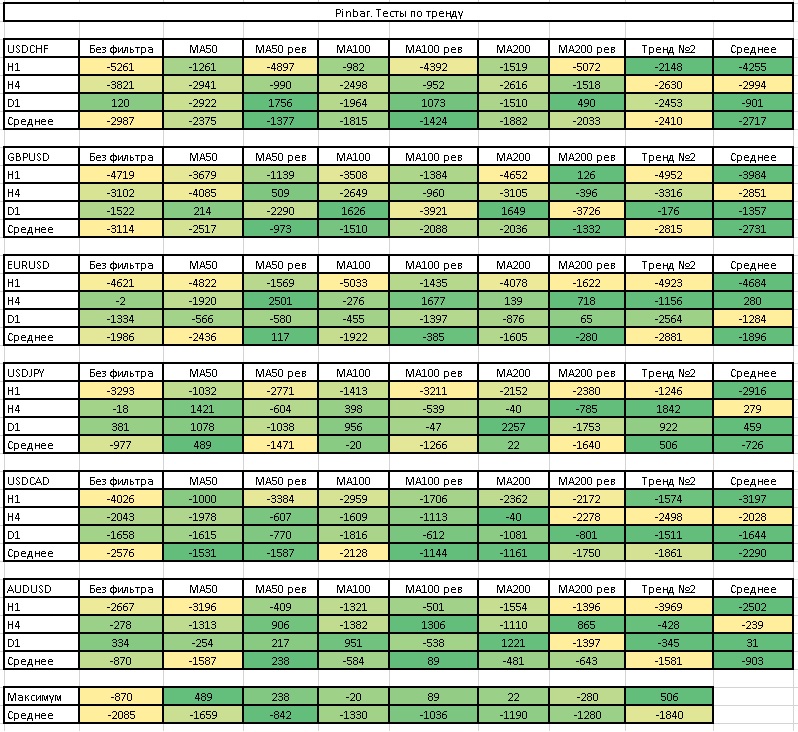 Whichever moving average you choose to determine the trend, it will still be better than not paying attention to the direction of price at all.
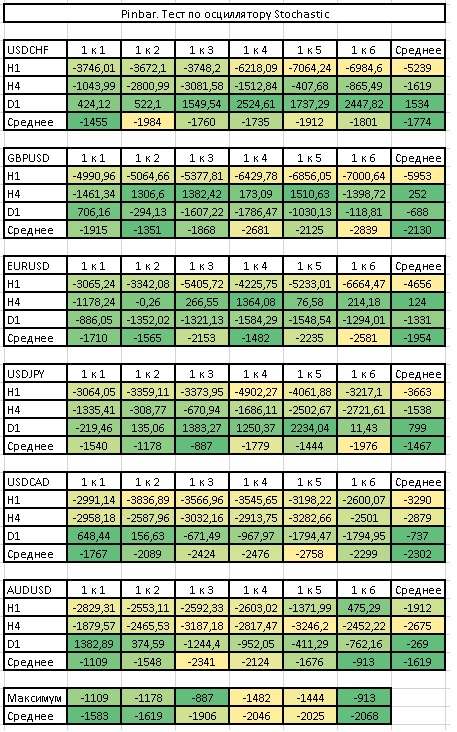
Stochastic oscillator test
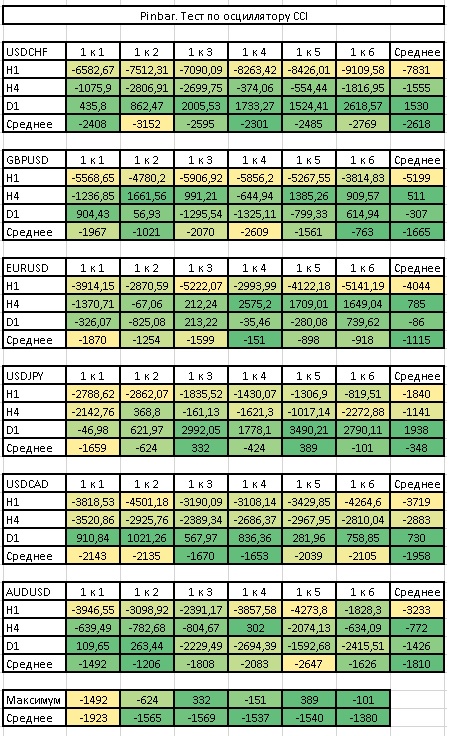
 CCI oscillator test
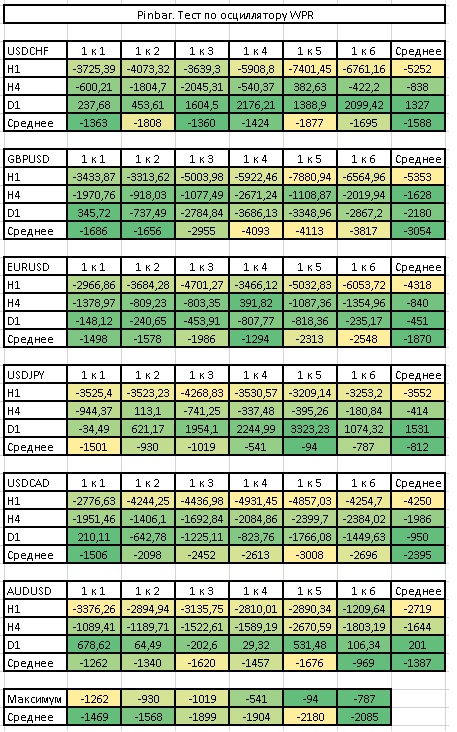
 WPR oscillator test
 Oscillator tests summary table
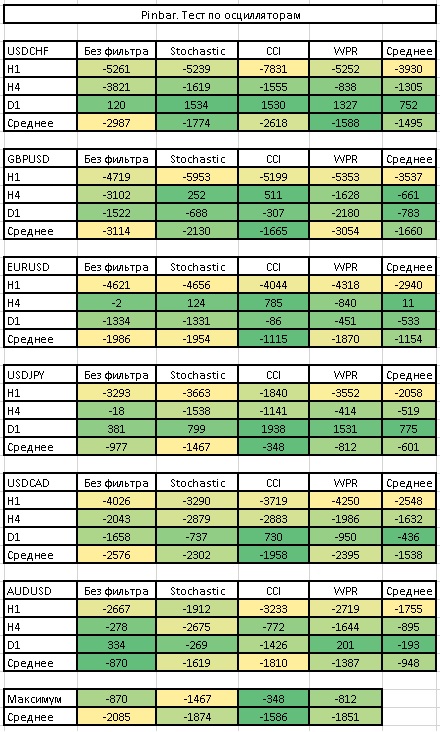 Any of the oscillators can in some cases worsen the final result, but more often it still helps. The only condition is the individual selection of settings for each currency and period.
Pattern test

This is what pattern trading looks like on the H1 period for the currency pairs we are considering:
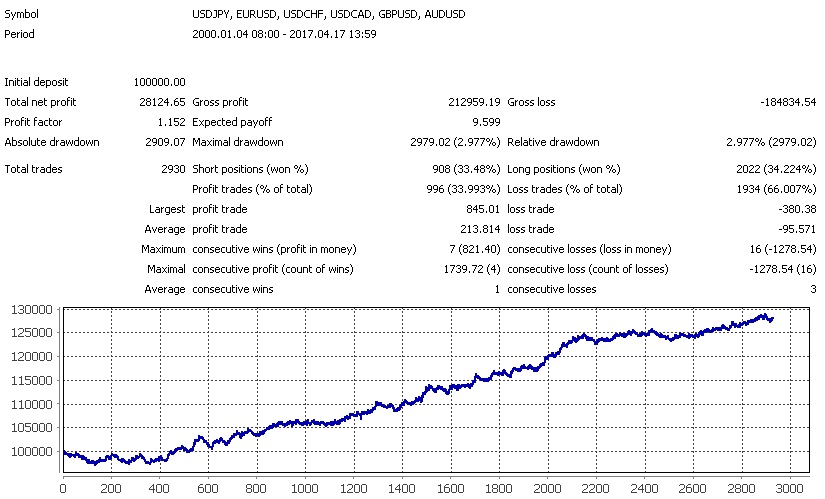 If we replace the standard stop at the candle shadow with an ATR-based stop, we get the following result:
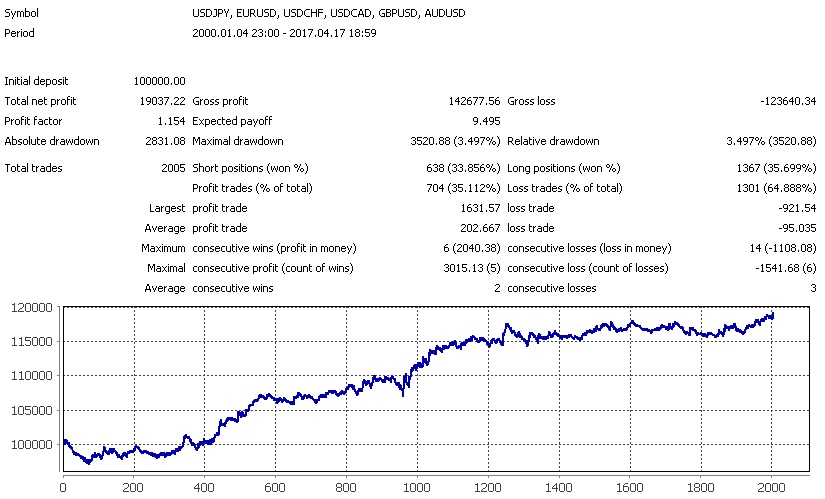 We can also add a trailing stop by candle shadows to the trading system; we will move our initial stop loss after the price along the candle shadows:
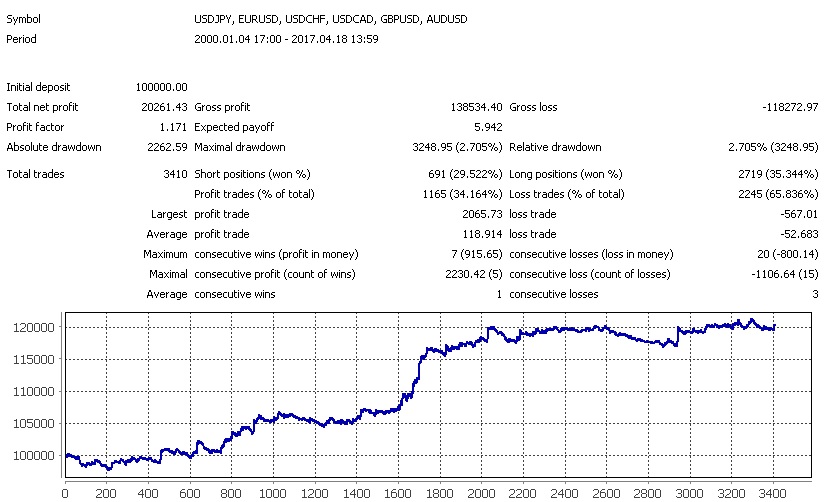 And here is what will happen if we use the opposite signal to exit the position:
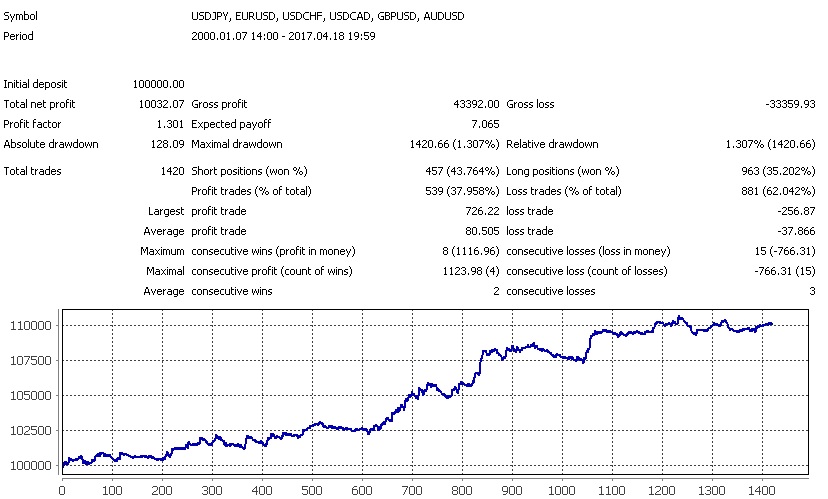 When trading the pinbar on the H1 period, none of our improvements proved effective.
Now let us look at trading on the H4 period:
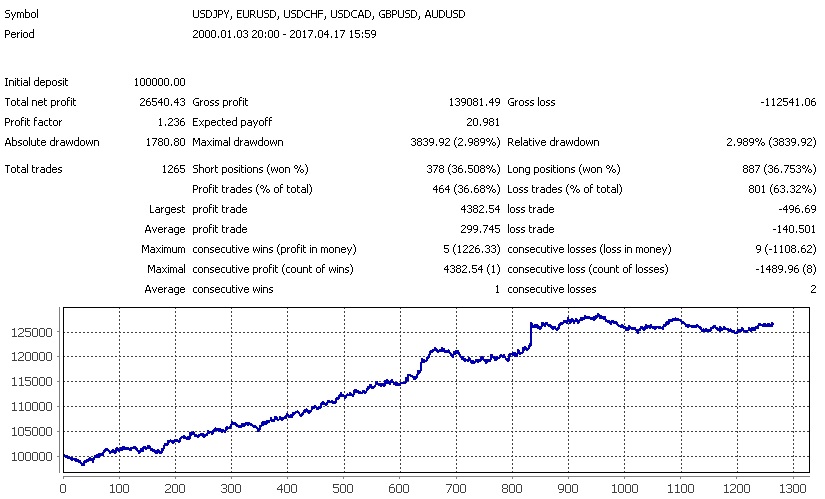 Let us apply 2-4 ATR stops:
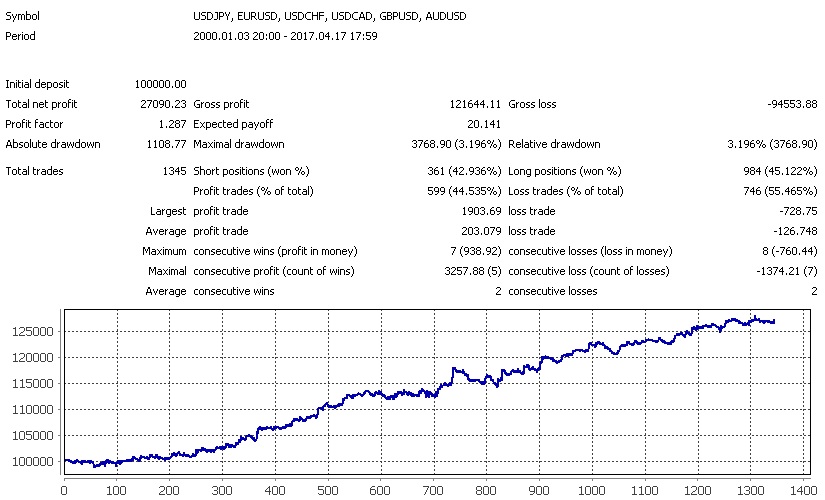 Let us add a trailing stop:
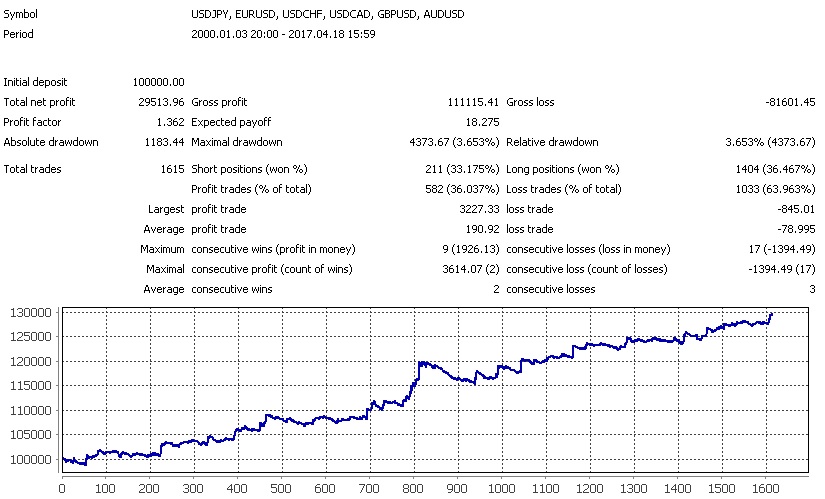 Now let us add an exit condition based on the opposite signal:
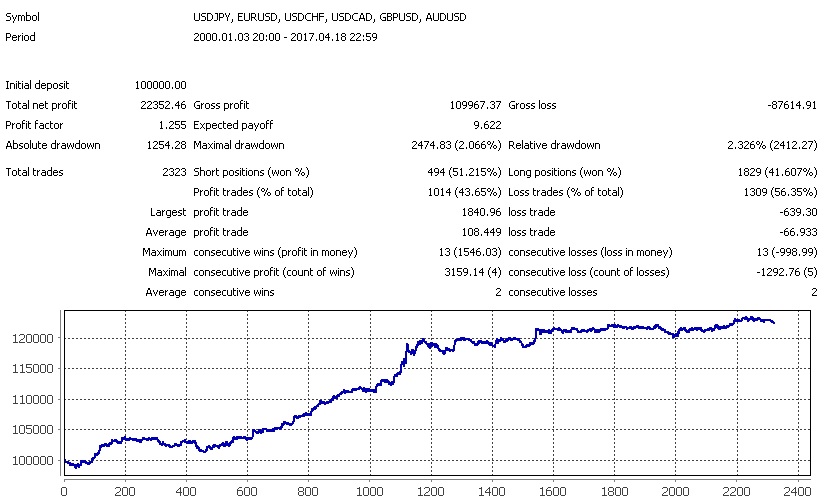 Unlike the H1 period, here any of our improvements leads to a more interesting result.
Conclusions

The pinbar pattern, despite its prevalence and broadest fame, does not lose its relevance and profitability. Which is surprising, because a huge number of traders trade pinbars. But as we can see, this does not make things worse for anyone.
Testing all patterns together
This is what trading patterns on the H1 period looks like for the currency pairs we are considering:
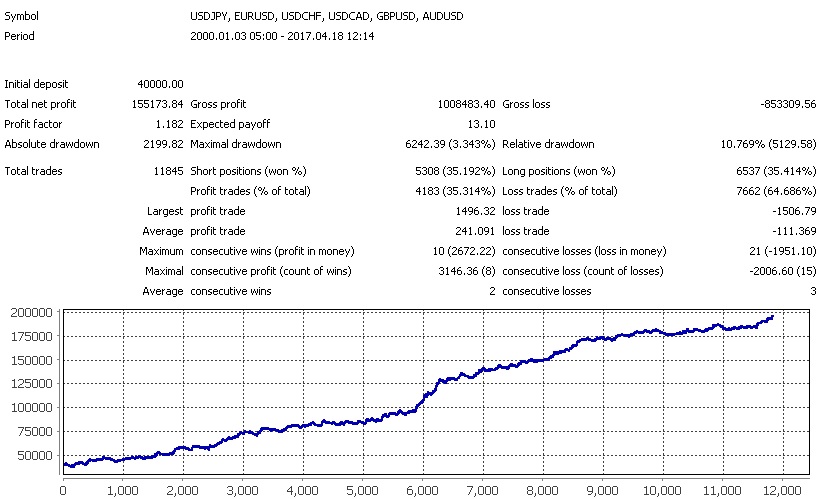 If we replace the standard stop at the candle shadow with an ATR-based stop, we get the following result:
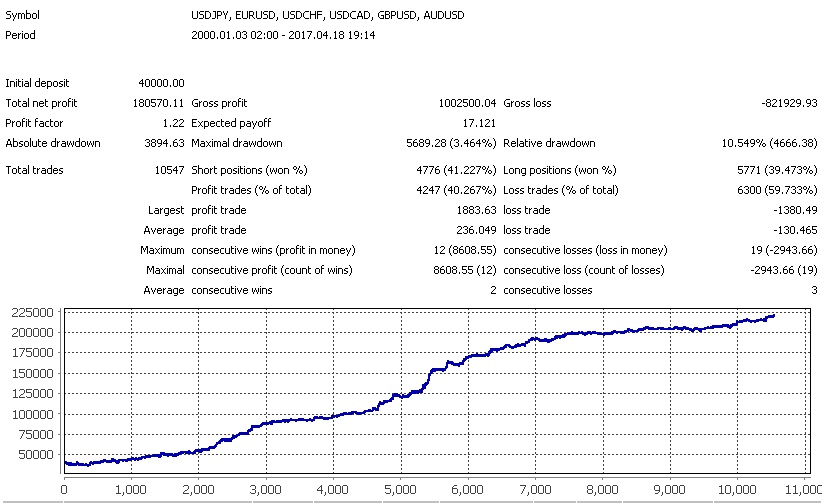 You can also add a trailing stop based on candle shadows to the trading system - we will pull our initial stop loss along behind the price using the candle shadows:
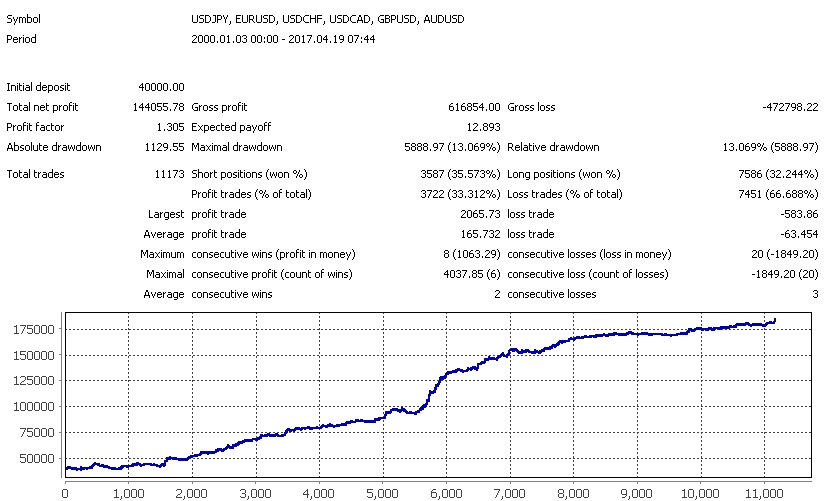 And here is what will happen if you use the opposite signal to exit the position:
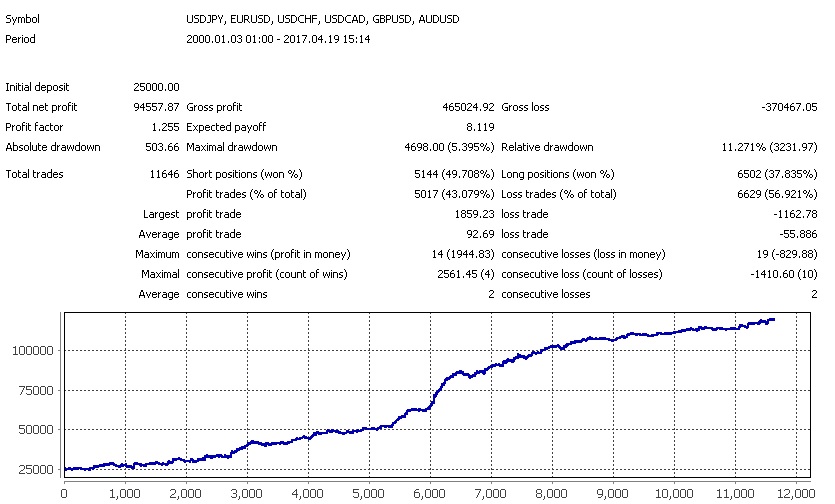 On the H1 timeframe, trading all the PA patterns discussed in the article produced a fairly pleasant-looking equity curve. At the same time, more than 10000 trades over 17 years tell us that you will not have to be bored with this kind of trading - at least 2 trades a day should be possible.
Now let's look at trading on the H4 timeframe:
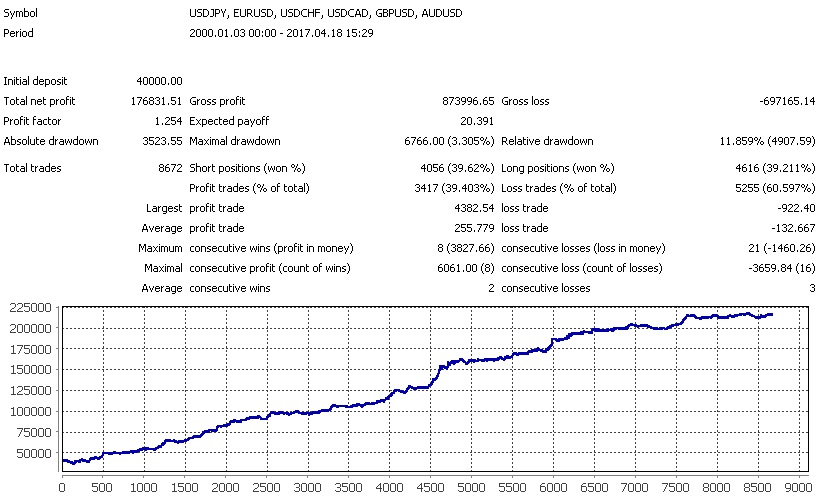 Let's apply stops of 2-4 ATR:
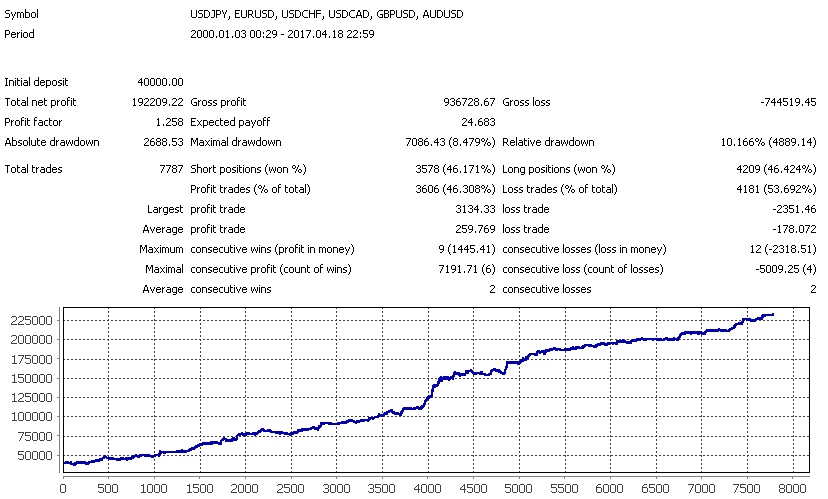 Let's add a trailing stop:
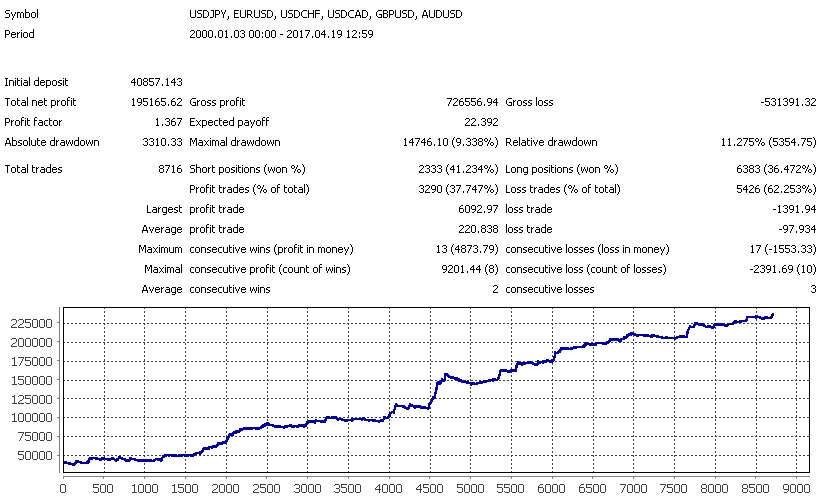 Now let's add an exit condition based on the opposite signal:
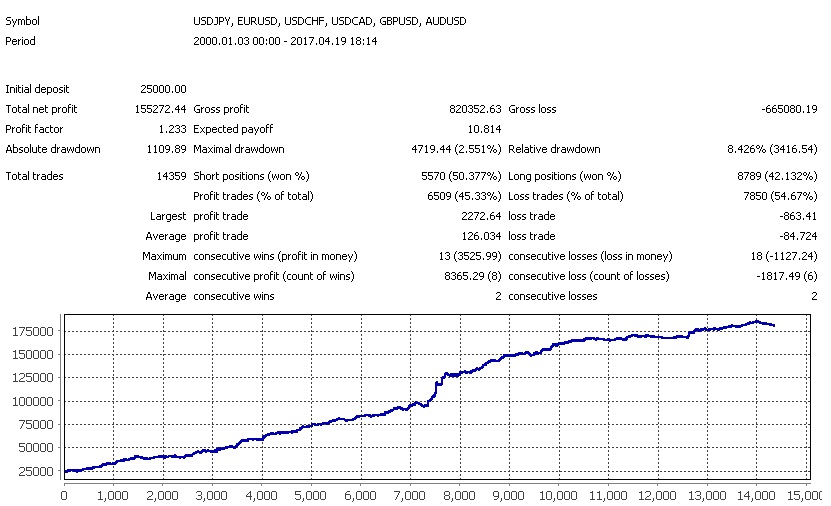 The best option when trading on H4 is to use ATR-based stops together with active position management. The number of trades is not much lower than when trading on H1. But the strain on your nerves is far lower.
Conclusion

In this article, we examined the application of the main and most common PA patterns and once again confirmed the following things in practice:
- Candlestick patterns should be traded from levels;
- It is highly desirable to take trades in the direction of the main trend;
- The reward-to-risk ratio should be at least 1 to 3.
In addition, we now know that:
- Every rule has its exceptions, and for the most effective trading you need to know the instrument you trade well - there are pairs that ignore levels, and there are those on which a given pattern simply does not work;
- 30-40% winning trades is normal, and if you do everything correctly and follow money management, your account will grow;
- Trading drawdowns are an inevitable part of trading, especially candlestick-pattern trading.
It is believed that when trading Price Action you need to use your head. Today we made sure that even mechanical adherence to mechanical trading rules leads to a quite good result. Of course, this does not mean that you should not use your head. It means that if it joins your trading as well, the results will be much more interesting.
Price Action Thread on the Forum
Respectfully, Dmitry aka Silentspec TradeLikeaPro.ru
