
Chart patterns in cryptocurrency trading: how to find formations and use them for trading

The cryptocurrency market attracts traders with its high volatility, round-the-clock operation, and the opportunity to trade both rising and falling prices. However, these features create additional challenges for technical analysis. Cryptocurrencies frequently experience sharp price impulses, false breakouts, heightened volatility in individual tokens, and movements associated with the mass closing of positions in the futures market.
Under these conditions, chart patterns help analyze price behavior systematically and identify likely scenarios for further movement. But a formation that looks convincing on the chart will not necessarily lead to the expected result. This is especially true of small altcoins with low liquidity.
Let's look at which technical analysis patterns cryptocurrency traders use, how to find them on a chart, how much they can be trusted, and how to open trades with controlled risk.
What are patterns in cryptocurrency trading
A pattern is a recurring combination of price movements that reflects a particular balance of supply and demand. Traders use these formations to assess the likelihood of the current trend continuing, reversing, or the market moving sideways.
Patterns do not indicate that the price will necessarily move in a particular direction. They help formulate a trading hypothesis: for example, after prolonged consolidation, buyers may try to continue the upward move or, conversely, sellers may seize the initiative.
Technical analysis generally distinguishes two main groups of chart patterns.
Trend continuation patterns form during a temporary pause or slowdown in price movement. They include flags, pennants, triangles, and rectangular ranges. They help identify potential entry points after a correction or consolidation.
Trend reversal patterns signal a possible change in the direction of movement. The best-known examples are the double top, double bottom, head and shoulders, and inverse head and shoulders.
Candlestick patterns are considered separately: engulfing, hammer, hanging man, harami, and other Japanese candlestick combinations. They differ from chart formations in scale: they usually describe price behavior over several candles, while classic chart patterns can form over dozens or hundreds of candles.
Both groups can be used to trade cryptocurrencies. Large chart formations help assess market structure, while candlestick combinations help refine the timing of opening a position.
Characteristics of Patterns in the Cryptocurrency Market
Classic technical analysis formations apply to stocks and currency pairs as well as digital assets. However, they form under different conditions in the cryptocurrency market than on traditional financial exchanges.
1. Round-the-Clock Trading
Cryptocurrency exchanges (such as Bybit) operate 24 hours a day, seven days a week. The market has no regular trading session close of the kind seen on stock exchanges.
This changes how patterns form. For example, in the stock market, an overnight break can lead to trading opening with a price gap. In cryptocurrencies, the price usually continues to form candles even at night and on weekends.
However, round-the-clock operation does not mean that participants are equally active at all times. Trading volumes and liquidity vary throughout the day. Studies of cryptocurrency exchanges show that activity, volatility, and liquidity follow distinct intraday patterns.
Therefore, identical patterns can behave differently depending on when they form. For example, a breakout through a level during a period of low activity may prove less sustainable than a move accompanied by an increase in trading volume.
At the same time, sharp moves in one direction on weekends often mark the start of a long-term impulse.
2. High volatility and sharp price movements
Cryptocurrencies can quickly change in value in response to news, shifts in participants' sentiment, large trades, and capital flows between digital assets.
This is especially noticeable with altcoins. Some of them can rise or fall by tens of percent in a short time.
High volatility creates several problems when working with patterns:
Price fluctuations can temporarily move beyond the pattern's boundaries, creating false breakouts.
Candles with long wicks make it difficult to identify the boundaries of a formation.
A pattern can lose its relevance even before the trader receives confirmation.
A stop-loss placed too close can be triggered by normal market noise.
Therefore, when analyzing cryptocurrencies, it is important to consider both the geometry of the pattern and the instrument's current volatility.

3. Differences in Cryptocurrency Liquidity
There are many digital assets on the market, but liquidity is unevenly distributed among them.
Bitcoin and Ethereum generally have deeper markets and higher trading turnover than smaller altcoins. Lesser-known tokens may have a low volume of orders in the order book, even when the chart shows significant price movements.
This affects the reliability of chart formations.
For example, a trader sees an ascending triangle forming and expects a breakout above its upper boundary. But a few relatively large orders can cause a sharp price spike that is unrelated to a sustained change in the balance of supply and demand.
In addition, cryptocurrency trading is spread across various centralized and decentralized platforms. Prices, volume, and even local highs and lows can differ between exchanges.
In a 2024 study, the European Securities and Markets Authority (ESMA) noted that trading volumes and liquidity were highly concentrated in a limited number of cryptocurrencies and trading platforms. For a trader, this means that chart analysis requires attention not only to the asset itself, but also to the specific exchange and trading pair.
4. The impact of futures, leverage and liquidations
A significant share of activity in the cryptocurrency market takes place in perpetual futures (Perpetual Futures).
Unlike spot trading, futures allow positions to be opened using leverage. This increases not only potential profit but also the risk of forced trade closure.
When the price moves rapidly against a large number of leveraged positions, exchanges may liquidate them in succession. Forced closures are accompanied by market orders that amplify the price movement.
This produces sharp price moves capable of breaking through the boundaries of triangles, flags and other chart patterns. Sometimes, after the liquidations end, the price returns to its previous range.
Therefore, when analyzing cryptocurrency patterns, you should consider not only the spot chart but also conditions in the derivatives market. Open interest, funding rates and liquidation volume can provide additional insight into participants' positioning.
However, these indicators do not replace chart analysis and do not independently confirm a signal.
Reliability of Chart and Candlestick Patterns in Cryptocurrencies
Patterns have no universal reliability percentage. You cannot claim that a flag works in 70% of cases and a double top in 60% without specifying the particular asset, timeframe, observation period, and entry rules.
At the same time, scientific research shows that technical formations can indeed contain information about likely movements in cryptocurrency prices.
For example, a 2026 study published in International Review of Economics & Finance examined 55 candlestick patterns using hourly data for nearly 400 cryptocurrencies listed on 36 exchanges. The authors found statistically significant predictive power in certain combinations. In particular, some bullish formations, such as Bullish Harami and Hikkake, were associated with subsequent price increases, while Bearish Harami and Hanging Man were associated with price declines.
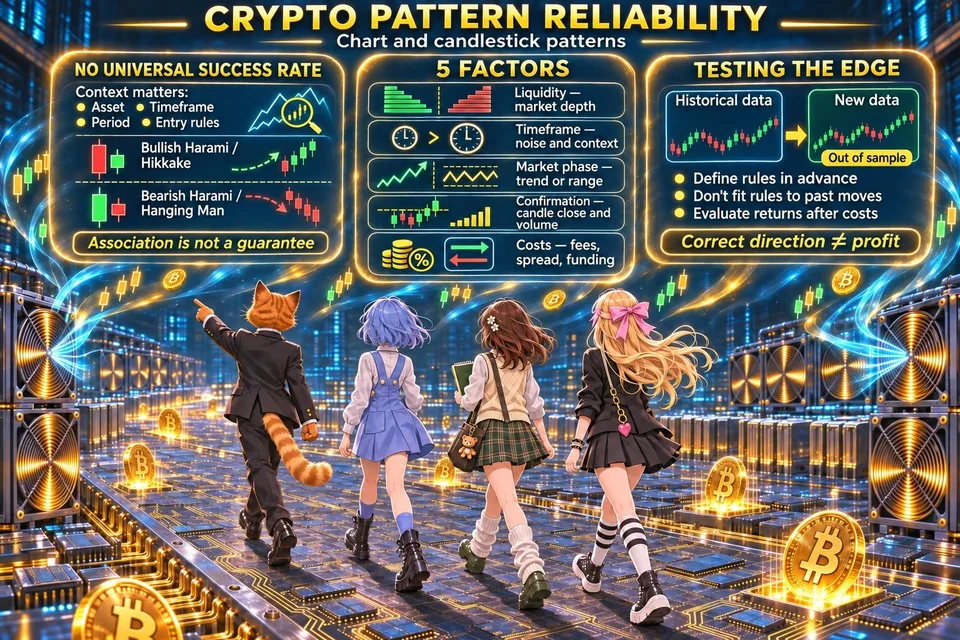
However, the study's data covered the period from July 2018 to January 2022. The results do not mean that these signals are equally effective for all coins and market conditions.
Other scientific studies offer more cautious assessments. A 2023 study that tested thousands of technical rules on 12 cryptocurrencies showed that only a small share of signals maintained robust predictive power and profitability outside the original sample.
Thus, the question is not whether patterns work at all, but under what conditions a particular pattern provides a trading edge.
In practice, the reliability of chart formations depends on several factors:
Instrument liquidity. In major trading pairs, random price spikes usually have less impact on the chart's structure. For tokens with low liquidity, a pattern may form under the influence of several large trades.
Timeframe. More formations appear on lower timeframes, but the number of false breakouts increases. Signals occur less frequently on higher timeframes, but they are easier to assess in the context of the overall market movement.
Market phase. It makes more sense to look for trend continuation patterns during a clear directional move. In a sideways market, breakouts may more often end with the price returning to its previous range.
Signal confirmation. A break of the boundary, a candle close outside the pattern, changes in volume, and alignment with the overall trend can improve the quality of a trading setup.
Trading costs. Even if a pattern correctly identifies the direction of movement, a trade may turn out to be unprofitable after accounting for fees, the spread, slippage, and funding for a futures position.
A separate problem is fitting patterns to historical charts. When a trader looks at a price move that has already occurred, it is easy to pick out an attractive pattern and find the ideal entry point. In real time, the structure is still incomplete, and confirmation may arrive too late.
Visual recognition alone is therefore insufficient. An objective assessment requires backtesting the strategy on historical data and then testing it over a period that was not used to develop the rules.
Which patterns are most commonly used in cryptocurrency trading
Most classic technical analysis patterns can be applied to Bitcoin, Ethereum, and altcoins. But for a beginner trader, it is more sensible to master a few of the most straightforward formations rather than try to trade every existing combination.
Trend continuation patterns
Flag (Flag)
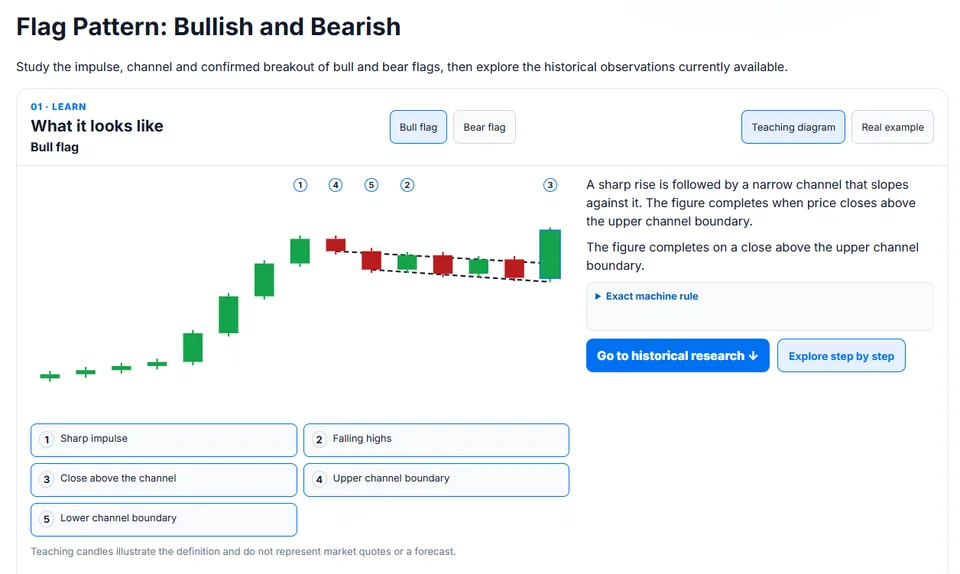
A flag appears after a strong price move, known as the flagpole. The market then enters a relatively short correction, forming a small sloping channel.
If the price was rising before the flag formed, a breakout above its upper boundary may signal a continuation of the uptrend. During a downward move, a similar formation may indicate a continuation of the decline.
In cryptocurrencies, flags often appear after sharp moves caused by news or changes in market participants' activity.
You can learn more about the flag pattern on the TLAP Pattern Lab page.
Pennant (Pennant)
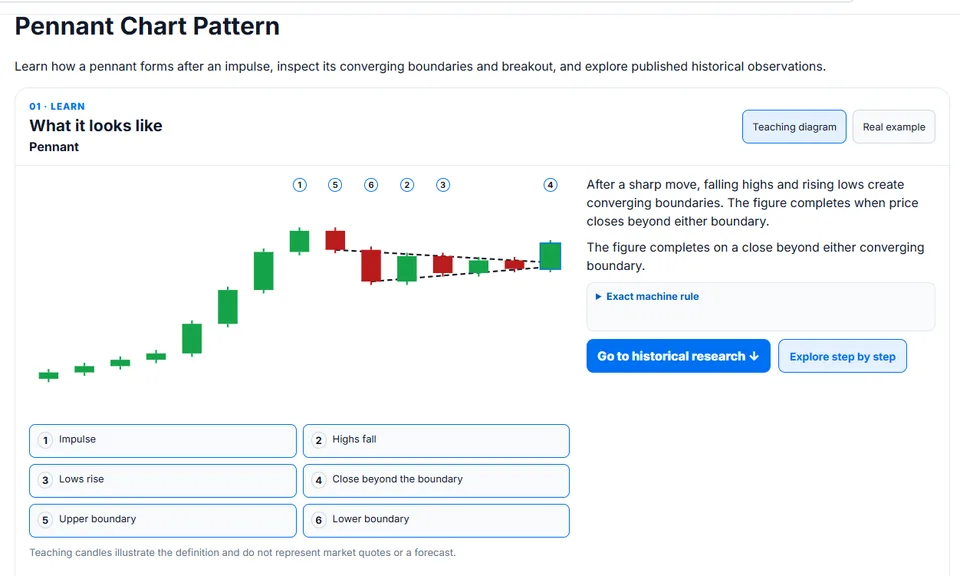
A pennant is similar to a flag, but instead of a sloping channel, a small converging structure of two lines forms.
After a strong move, the trading range gradually narrows. A breakout above the upper boundary or below the lower boundary may provide an entry signal in the direction of the preceding impulse.
You can learn more about the pennant pattern on the TLAP Pattern Lab page.
Triangle (Triangle)
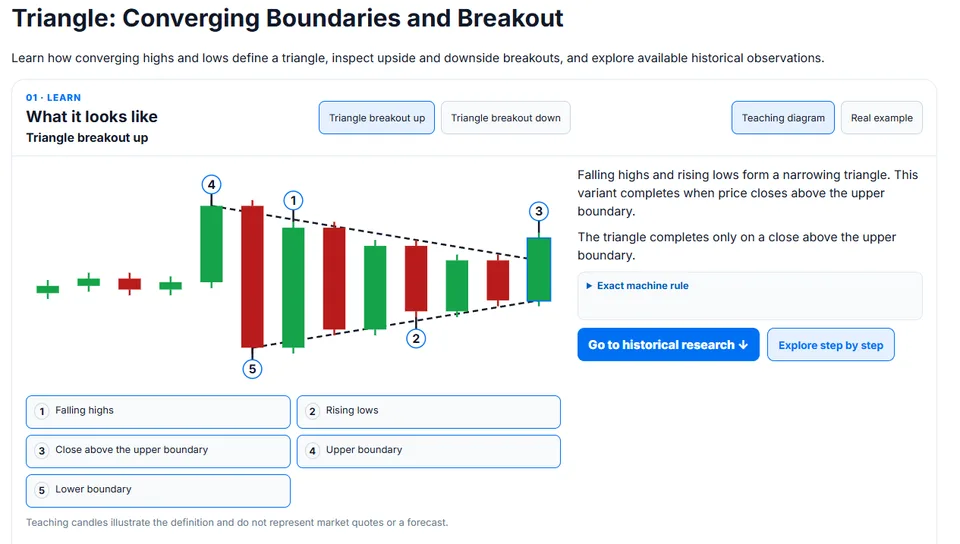
Triangles form when price fluctuations gradually narrow.
There are three main types:
Ascending triangle: the upper boundary stays at approximately the same level, while the lows gradually rise.
Descending triangle: the lower boundary remains relatively horizontal, while the highs decline.
Symmetrical triangle: the highs decline, while the lows rise.
The direction of the breakout from the pattern determines the subsequent trading scenario. An ascending triangle should not automatically be considered bullish or a descending triangle bearish: the actual breakout and overall market conditions matter more.
You can learn more about the triangle pattern on the TLAP Pattern Lab page.
Reversal patterns
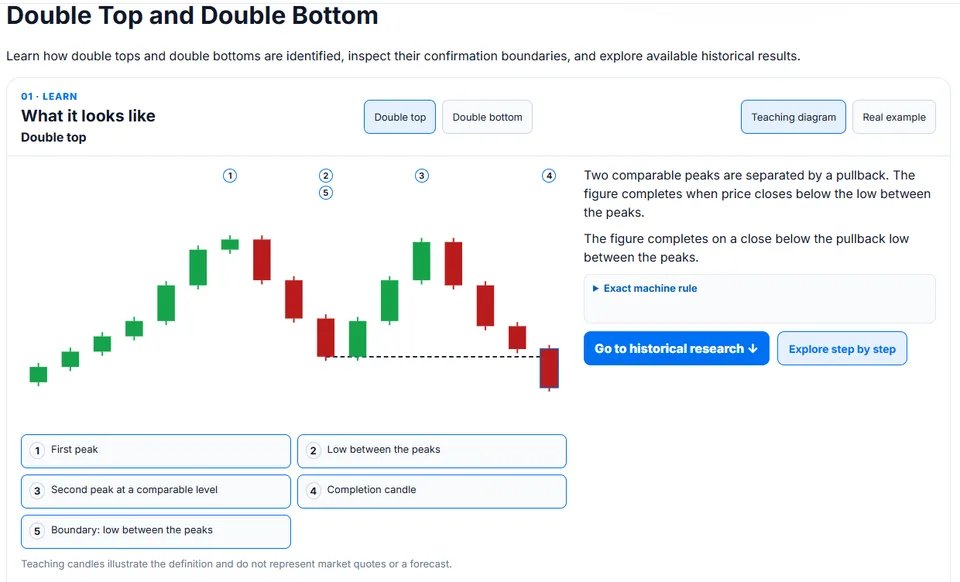
Double Top (Double Top)
The formation consists of two local highs located at approximately the same level. Between them, the price forms an intermediate low.
If, after the second high, the price breaks below this low, the pattern is considered complete and may indicate a reversal of the uptrend.
Double Bottom (Double Bottom)
The reverse situation: the price tests a support area twice but cannot establish itself below it. A local high appears between the two lows.
A breakout above this high confirms the completion of the pattern and increases the likelihood of a reversal of the downward move.
Learn more about the double top and double bottom patterns on the TLAP Pattern Lab page.
Head and Shoulders (Head and Shoulders)
The formation consists of three consecutive peaks: two outer shoulders and a higher central peak — the head.
The line connecting the lows between the peaks is called the neckline. A break below this line after the right shoulder has formed is considered a signal of a possible reversal of the uptrend.
The inverse head and shoulders forms as a mirror image and may indicate a reversal of the downtrend.
One rule is important for all the patterns listed: a pattern is not considered complete until its key boundary is broken. An incomplete formation only suggests a possible course of events.
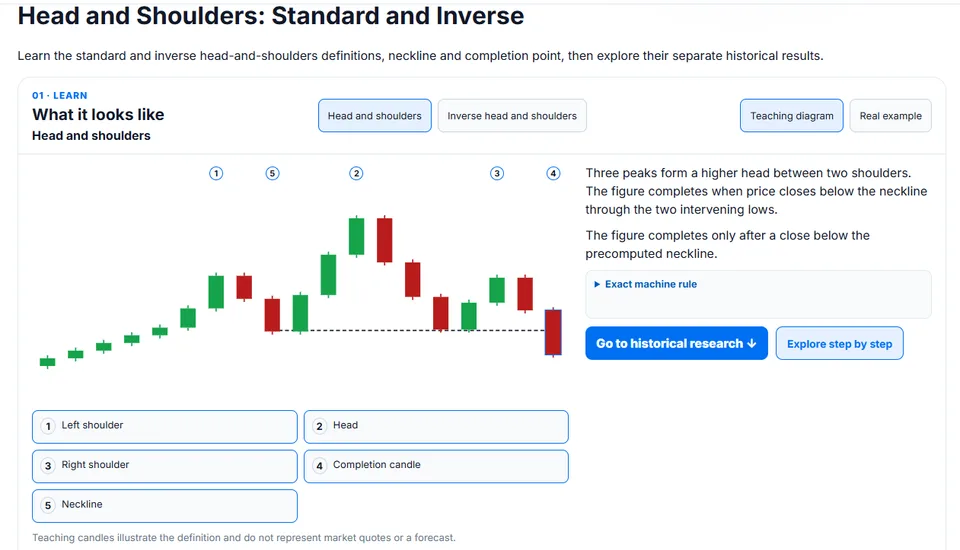
Learn more about the head and shoulders pattern on the TLAP Pattern Lab page.
Specifics of trading cryptocurrencies using patterns
How to Find Patterns on a Cryptocurrency Chart
Finding patterns starts not with identifying a geometric shape, but with selecting an instrument and assessing market conditions.
Step 1. Choose a trading pair and platform
To start, it is better to use liquid instruments, such as BTC/USDT or ETH/USDT on major exchanges (for example, Bybit).
This helps reduce the impact of random price spikes and the spread. When analyzing smaller altcoins, you should also check order book depth and trading volume.
It is especially important to analyze the same market in which you plan to open a position. If a trader intends to trade a perpetual contract, it is advisable to study the chart of the corresponding futures instrument, rather than just the spot price.
Step 2. Choose a timeframe
For beginner traders, it is easier to start analyzing the four-hour (H4) or daily (D1) chart.
On these timeframes, it is usually easier to see the structure of price movements, key support and resistance levels, and chart patterns that have formed.
The hourly chart (H1) can be used to refine the entry point. On timeframes of 5–15 minutes, patterns form more often, but market noise and false signals increase.
A practical approach is to first identify the market's direction and structure on a higher timeframe, then look for an entry point on a lower one.
Step 3. Find local highs and lows
Most chart formations are based on price reversal points — local extremes.
Mark the sequence of highs and lows, paying attention to how the amplitude of price swings changes.
If the highs and lows gradually rise, the market has an upward structure. If they fall, it has a downward structure.
If the extremes lie at roughly the same levels, a range or reversal pattern may be forming.
Do not force the chart to fit a preselected pattern. If you have to move lines arbitrarily or ignore certain extremes to produce a pattern, the quality of that formation is questionable.
Step 4. Draw the pattern boundaries
Connect significant price extremes with trendlines or horizontal levels.
Pattern boundaries are best viewed as zones rather than perfectly precise lines. This is especially important in the cryptocurrency market, where long candlestick wicks can create a false impression of a breakout.
Try to use several confirmation points for each boundary. The more significant touches there are, the clearer the formation's structure becomes. However, a large number of touches alone does not guarantee a successful breakout.
Step 5. Wait for the pattern to complete
Do not open a position just because the pattern looks almost complete.
For example, a double top is not considered confirmed until the price breaks below the intermediate low. A triangle does not provide a clear trade direction until the price moves beyond its boundaries.
To confirm a breakout, it is useful to wait for a candle to close outside the pattern on the chosen timeframe.
An increase in trading volume can provide additional confirmation. But it is important to consider that volumes may differ across exchanges and markets. The volume of small altcoins should be interpreted with particular caution.
Step 6. Check the overall market context
Before entering a trade, you need to assess what is happening with the major cryptocurrencies.
For example, an altcoin is forming a bull flag, but Bitcoin is simultaneously breaking below an important support level. In this situation, the local formation may prove less reliable, as the overall market movement can outweigh demand for an individual token.
For further assessment, you can use volumes, open interest, funding rates, and the price's position relative to important levels.
A pattern is best viewed as one element of the overall trading picture rather than in isolation.

The TLAP Pattern Lab page features a collection of technical analysis chart patterns, including formations such as “Head and Shoulders,” “Double Top and Double Bottom,” “Flag,” “Pennant,” “Triangle,” and “Wedge.” Each pattern comes with an educational example, an explanation of the conditions under which the pattern forms and completes, and an opportunity to analyze its behavior using historical price data.
The service TLAP Pattern Lab allows you to test patterns against historical cryptocurrency prices.
How a beginner trader can use patterns in cryptocurrencies
It is best to make your first trades based on chart formations without leverage or with minimal exposure. The main goal is to learn to distinguish a completed pattern from an incomplete one, recognize false breakouts, and follow risk management rules.
You should not start by looking for patterns across dozens of low-liquidity tokens. A few liquid trading pairs and two or three formations are enough for learning.
It is useful to keep a trading journal. It should record the pattern name, trading pair, timeframe, entry point, stop-loss, target, position size, and final result.
After some time, you can assess not only the share of profitable trades but also the average profit, average loss, maximum drawdown, and the impact of trading costs.
It is especially useful to analyze results separately for different situations: a breakout with confirmation, entry after a retest, trading in the direction of the main trend, and trades against it.
This approach allows you to understand which formations actually provide an edge in a particular trading system and which only look convincing when viewing a historical chart.
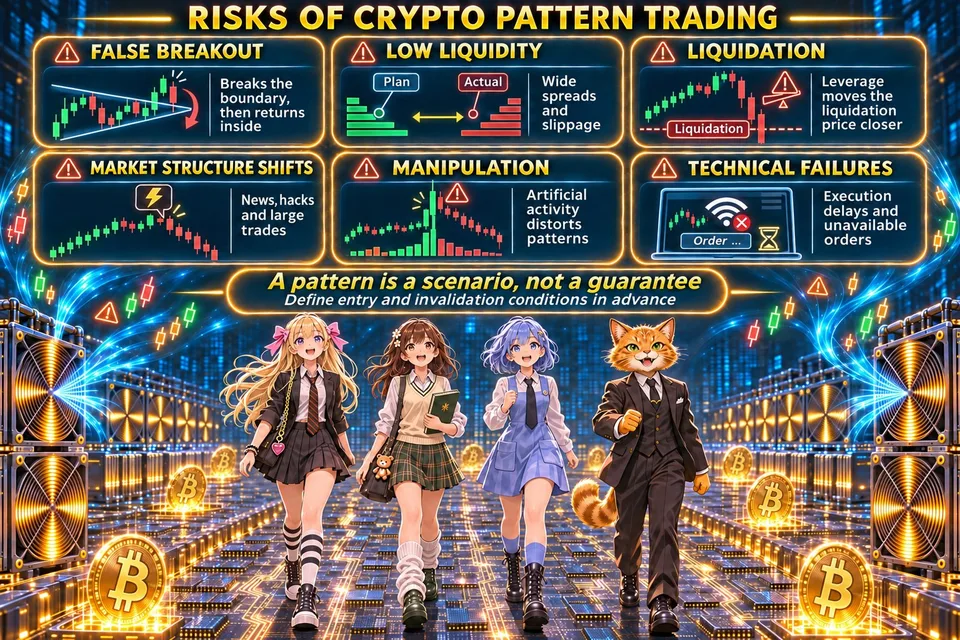
Main Risks of Trading Cryptocurrencies Using Patterns
Even a correctly identified formation does not protect a trader from the specific risks of the cryptocurrency market.
False breakout. The price moves beyond the boundary of the pattern, triggers pending orders, but then moves back inside. Such situations are particularly likely to cause problems when trading small altcoins and during sharp changes in volatility.
Insufficient liquidity. When the spread is wide and the volume of orders is low, the actual execution price may differ noticeably from the expected price. As a result, the trade has a less favorable entry or exit point.
Position liquidation. Using a high level of leverage reduces the distance to the price at which the position is forcibly closed. If the market makes a sharp move, the position may be liquidated before the trader expected to close it with their stop-loss.
Sudden changes in market structure. Regulatory news, actions by major investors, blockchain upgrades, protocol hacks, and other events can change the balance of supply and demand before a technical pattern has time to play out.
Manipulation and price anomalies. In less liquid markets, individual large trades and artificially generated activity can distort chart formations. The U.S. Commodity Futures Trading Commission (CFTC) specifically warns about the potential for manipulation, price crashes, and inadequate protections at certain spot cryptocurrency trading venues.
Technical risks of the exchange. Trading platform outages, connection problems, execution delays, and temporary unavailability of orders can prevent a trade from being closed at the planned price.
Thus, a pattern should be used not as a guarantee of results, but as a way to define the conditions for opening a position and the level at which the trading hypothesis is no longer valid.
Conclusion
Chart patterns can be applied to the cryptocurrency market, but using them requires taking the specific characteristics of digital assets into account. Round-the-clock trading, uneven liquidity, high volatility, and extensive use of futures create conditions in which false breakouts and sharp price changes occur quite frequently.
For a beginner trader, the most sensible approach is to use patterns as a tool for assessing likely price movements, rather than as a standalone signal to open a position.
The quality of a trade depends on more than correctly identifying a pattern. It is necessary to wait for confirmation, determine the level that invalidates the trading scenario, calculate the position size, and set a target in advance.
Even a good pattern can result in a loss. A trader's task is not to predict every market move, but to build a trading system in which profitable trades earn more than is lost on incorrect forecasts.