
Flags, Triangles, Rectangles

How many times have you entered at the end of a correction, only for it to continue and hit your stop loss? Of course, losing trades are unavoidable, but graphic analysis patterns can help identify the point where a corrective move ends, namely: triangles, rectangles, and flags (essentially variations of the same pattern). And in today's video lesson, we will talk about how to correctly use these patterns in forex for the benefit of your deposit, how to find them in real time, and how to set risks and targets.
Triangles, rectangles, flags in forex - secrets of trading graphic analysis patterns
Hello, ladies and gentlemen forex traders.
In this article, we will talk about graphic analysis patterns. About rectangles, triangles, and flags. About how to correctly find them on the chart, how to trade them, how to correctly place take profit and stop loss, and what you should pay attention to when working with them.
Before we move directly to the patterns, we need to understand what they actually are. In many sources, you can find information about patterns without tying them to the trend. In my view, this is absolutely wrong, because it is precisely the connection to the trend that gives us a logical explanation of what the pattern is and logically provides a high statistical chance specifically in profitable trading.
What are patterns?
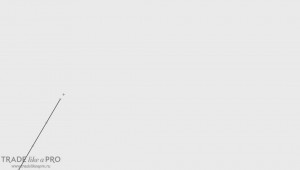
Patterns represent a correction within the main trend. Let us imagine that we have some kind of trend:
Then a correction occurs, and some candles are drawn:
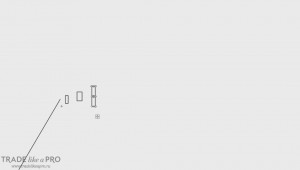
The fact is that the price does not continue the movement that existed earlier, but stands still and thereby draws some kind of pattern for us from these candles.
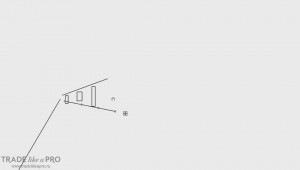
For example, an expanding triangle (or, in another way, a pennant):
The candles can form not only a triangle, but also some more even shape. For example, a rectangle:
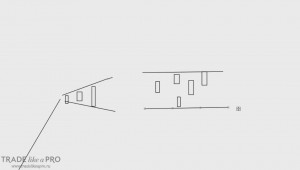
That is, if we outline the boundaries of the correction, we will get a rectangle.
There can also be a regular triangle:
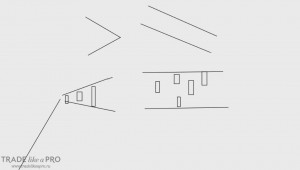
And there can be a correction in the form of an inclined rectangle, which is nothing other than a flag:
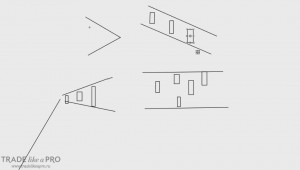
It is directed downward, so it is bearish. A bullish one will look as follows:
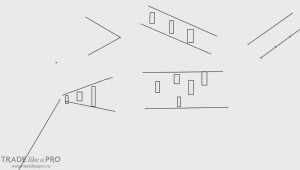
So, above you could examine our patterns. Triangle, expanding triangle, rectangle, and flag. Such patterns arise during a correction.
And after this pattern has finished forming, we expect a breakout in the direction of the trend that existed earlier. And then we enter in accordance with the main trend and take our profit from the market.
We wait for some candle to break out of the pattern:
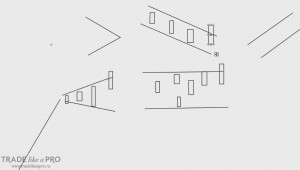
And after that, we enter.
How does the entry happen?
Let us imagine that we have a rectangle pattern and some candle breaks its boundary in the direction of the main trend:
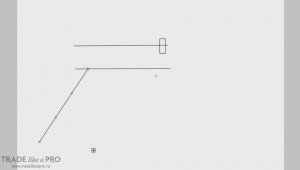
Before that, we had a bullish trend. If a downside breakout suddenly occurs, then we do not enter the market:
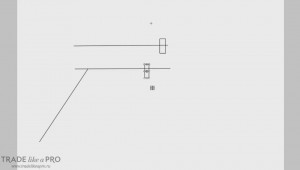
We enter only in the direction of the main trend. So, a breakout occurred in the direction of the main trend. Many sources say that you should enter the trade immediately. I recommend acting more pragmatically.
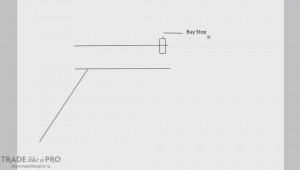
What do we do? We do not enter the trade immediately, but wait for this candle to close and place a buy stop pending order slightly above the high point of this candle. In the case of bullish trades:
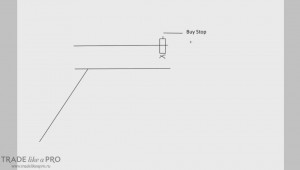
The stop loss will go slightly below the low point of our breakout signal candle:
And as a take profit, we set aside the size of our rectangle, in this case, in the direction of the trade. That is, if the distance between its boundaries was 50 points, then the take profit of our trade will also be 50 points:
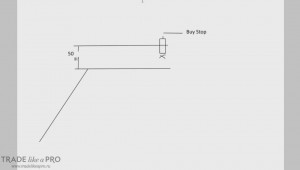
However, I recommend exiting the trade partially. That is, closing one part of the trade at a level equal to the stop loss, and the second part at a take profit equal to the size of the pattern. Let us imagine that our stop loss here was 25 points. Accordingly, we close half of the position at a profit of 25 points, and close the second half at a profit of 50 points.
What is the most important thing to remember when working with patterns?
If the trend was bullish, then we expect an upward breakout. If the trend was bearish, then we expect a downward breakout of the pattern. If a breakout occurs opposite to the main trend, then we do nothing.
Now let us mark several patterns on the chart to clearly understand how to find them in practice. I have the daily EURUSD chart open:
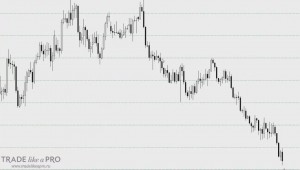
We can judge that there is a bearish trend. The price was moving downward and after some time a correction occurs.
And it is nothing other than a flag:
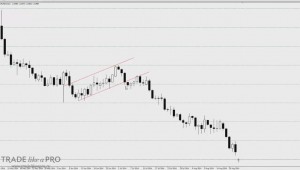
What happened here? There was a breakout in the direction of the main trend:
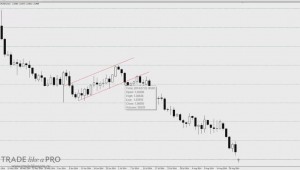
We would not enter the market immediately, but would place an order slightly below the low point of our candle:
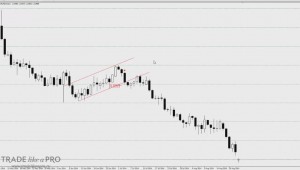
And, accordingly, take profit number one is the distance from the stop loss to the entry:
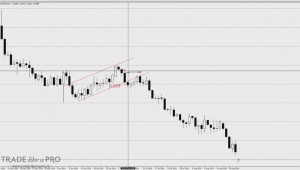
In this case it is 77 points, but do not forget that these are daily charts. Target number two would be the size of our flag, and it would amount to 100 points. It turns out that the first take profit was hit right here:
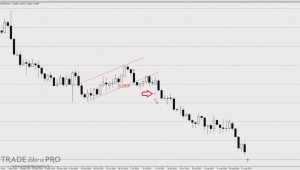
And the second one right here:
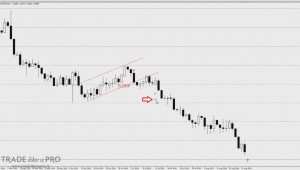
How do we draw the boundaries of our pattern?
We do not draw them exactly by the tails or candle closing points. We try to build the pattern so that there are as many touches as possible. So that these are truly boundaries. If there are not many touches, then the boundary cannot be placed. Most likely this is not a pattern, but something else.
If you cannot find a pattern, then perhaps it is not here. And you should not try to find what is not there. If there is no confidence, then do not draw it. It is better to watch what happens next in the market.
Let us look at one more example. This time we will take a rectangle as the pattern. After the breakout of the top, approximately here:
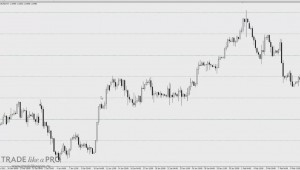
It would be possible to say that a bullish trend had begun. And then the price was drawing nothing other than a rectangle:
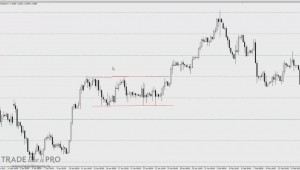
We marked its boundaries in approximately this way. A little later, a breakout of the upper boundary occurred. We place our stop loss slightly below the low point of the breakout candle:
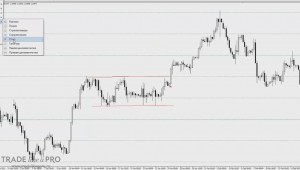
We place a pending order to buy slightly above the high point of the breakout candle, and the order is activated:
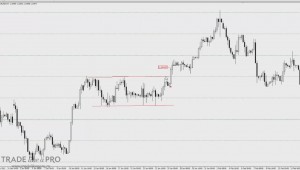
Our first take profit is 90 points, and the second is 128. As can be seen on the chart, they were hit without any problems:
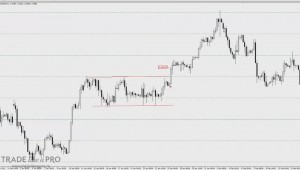
One more example. This time let us look at a triangle pattern:
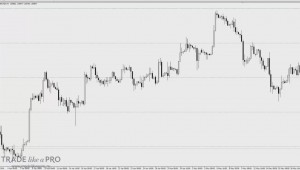
There was a clear bullish movement on the chart. And then the price began to stall along a slope like this:
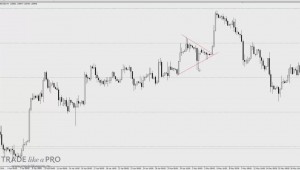
Note that we have the tails of two candles extending beyond the boundaries of our triangle at the bottom, but that is normal. And the closes of the candles are much more important than their tails. Therefore, this triangle may quite well be considered valid.
What happened here? There was a clear bullish trend. Next comes a breakout candle. As usual, we place a buy stop slightly above its high point:
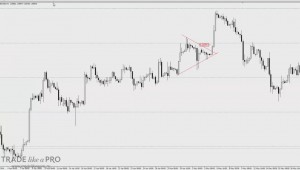
And we place the stop loss slightly below its low:
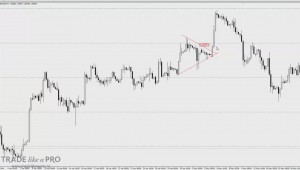
Next, pay attention. Our first take profit equals the size of the stop loss. Approximately 30 points:
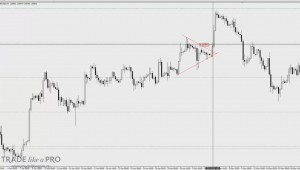
It was reached without any problems. But our second target is measured by the widest distance between the boundaries of the triangle:
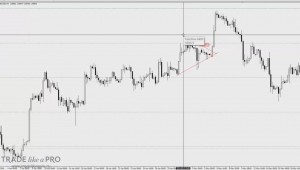
In this case it was 109 points. And it was not reached:
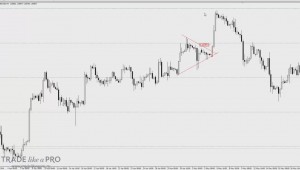
In this situation, a stop loss would have triggered on half of our position. But since the first take profit was reached in the size of the stop loss, we would not have lost anything on this trade.
The most difficult thing in working with chart analysis patterns, namely with the trend continuation patterns we are talking about now, is to find them on the chart in real time, when the chart is moving at the right edge. What should be done in such a case?
Let us consider it using the example of real trading:
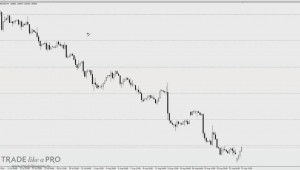
First of all, you need to determine the trend:
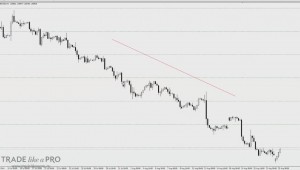
Here we see a downward trend. What do we do next? We mark the boundaries of our correction:
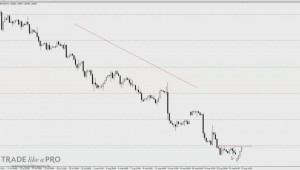
The upper boundary is clearly horizontal. It would have been possible to mark a second horizontal line as well, but the market open that took place on Monday clearly changed our plans:
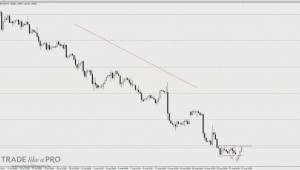
I think no one would open positions at the Monday open, so we change the boundary of our pattern as follows:
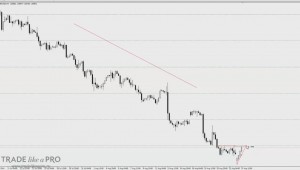
As a result, we get the following triangle. As I wrote earlier, the pattern does not necessarily have to be beautiful and even. It can quite well be like this too. This is a normal situation.
If a breakout upward occurs, then we will not do anything because the trend is moving downward. And if after a couple of candles a breakout downward occurs, then we will enter with a pending order with a stop loss, as described above. The target will be the distance between the boundaries of the triangle:
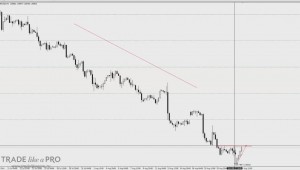
In this case it is 68 points.
Let's repeat once again
First determine the trend, then wait for a correction, that is, when several candles begin to move against the trend or are practically standing in one place. Wait for the correction and outline its boundaries. Wait for a clear pattern to form.
Only when the pattern has formed from the correction boundaries we marked will we be able to take it into account. If the pattern is not visible, then we do not consider such fluctuations on the chart. When drawing the boundaries, try to make as many touches as possible. So that the line is not somewhere in the air, but really limits the price movement.
And one more rule. Sometimes the breakout candle is very large and it turns out that the stop loss of the trade is larger than the potential take profit. In this case we do not enter the market.
How can these patterns help in your trading?
The thing is that patterns can be traded as a separate strategy, or they can be combined with your own trading. That is, when you see that a triangle is being drawn, there is no sense at all in trading a pin bar inside this triangle. Because the price will reach the boundary of the triangle, and your trade will not bring profit.
Or let's say you saw some setup. Some moment for a potential entry, and it is located inside a rectangle:
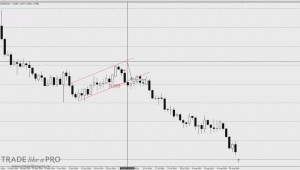
And so what? You can enter a trade again, but the boundaries of the rectangle will not give you much profit. Therefore, it is always worth paying attention to what is happening in the market right now. To the trend and the correction. Thus, with the help of patterns you can not only enter trades, but also filter the necessary entry signals.
That is all. I hope this material will help you work better and identify trend continuation patterns on the chart.
Respectfully, Pavel