
The Swings Were Flying: High Volatility as a Signal of Preparation for a Strong Impulse

The Holy Grail does not exist. What should you do?
Look for signals of an upcoming move. There are quite a few of them. High volatility within the timeframe, "swings," is often a reliable harbinger of an impulse in the second half or on the next timeframe.
Below are the definition of volatile swings, an understanding of the structure of swings, and the search for an entry point in the right direction.
What Volatility Is
Volatility is a measure of the variability of the price of a financial asset (futures, stock, currency, crypto) over time. In this sense, volatility is a statistical range of price movement.
On the other hand, volatility is also often understood to mean the speed of price change. In this sense, high volatility is rapid, multidirectional, and uneven price change.
Ways to Measure Volatility as a Probabilistic Range
The most common way simple traders measure volatility is by calculating the Average True Range, or ATR. The reason for its popularity lies in the fact that ATR calculation is included in the standard packages of most trading terminals.
Personally, to calculate volatility as a range, I prefer to use a somewhat different statistical method:
- I collect data for a specific period.
- I calculate the parameters: median, quartiles, and deciles.
- I analyze the distribution and look for patterns.
Example of Calculating Volatility (Range)
As an example, I will give a very quick collection of statistics from September 1 to December 3, 2025 for the YM instrument, the futures contract on the DJ30.
Data on the width of the range can be collected using special tools. I use the Cluster Search tool in the VolFix terminal.
Other trading and analytical terminals have their own tools. You can also measure the range manually. An error of a couple of pips in a manual measurement is not critical.
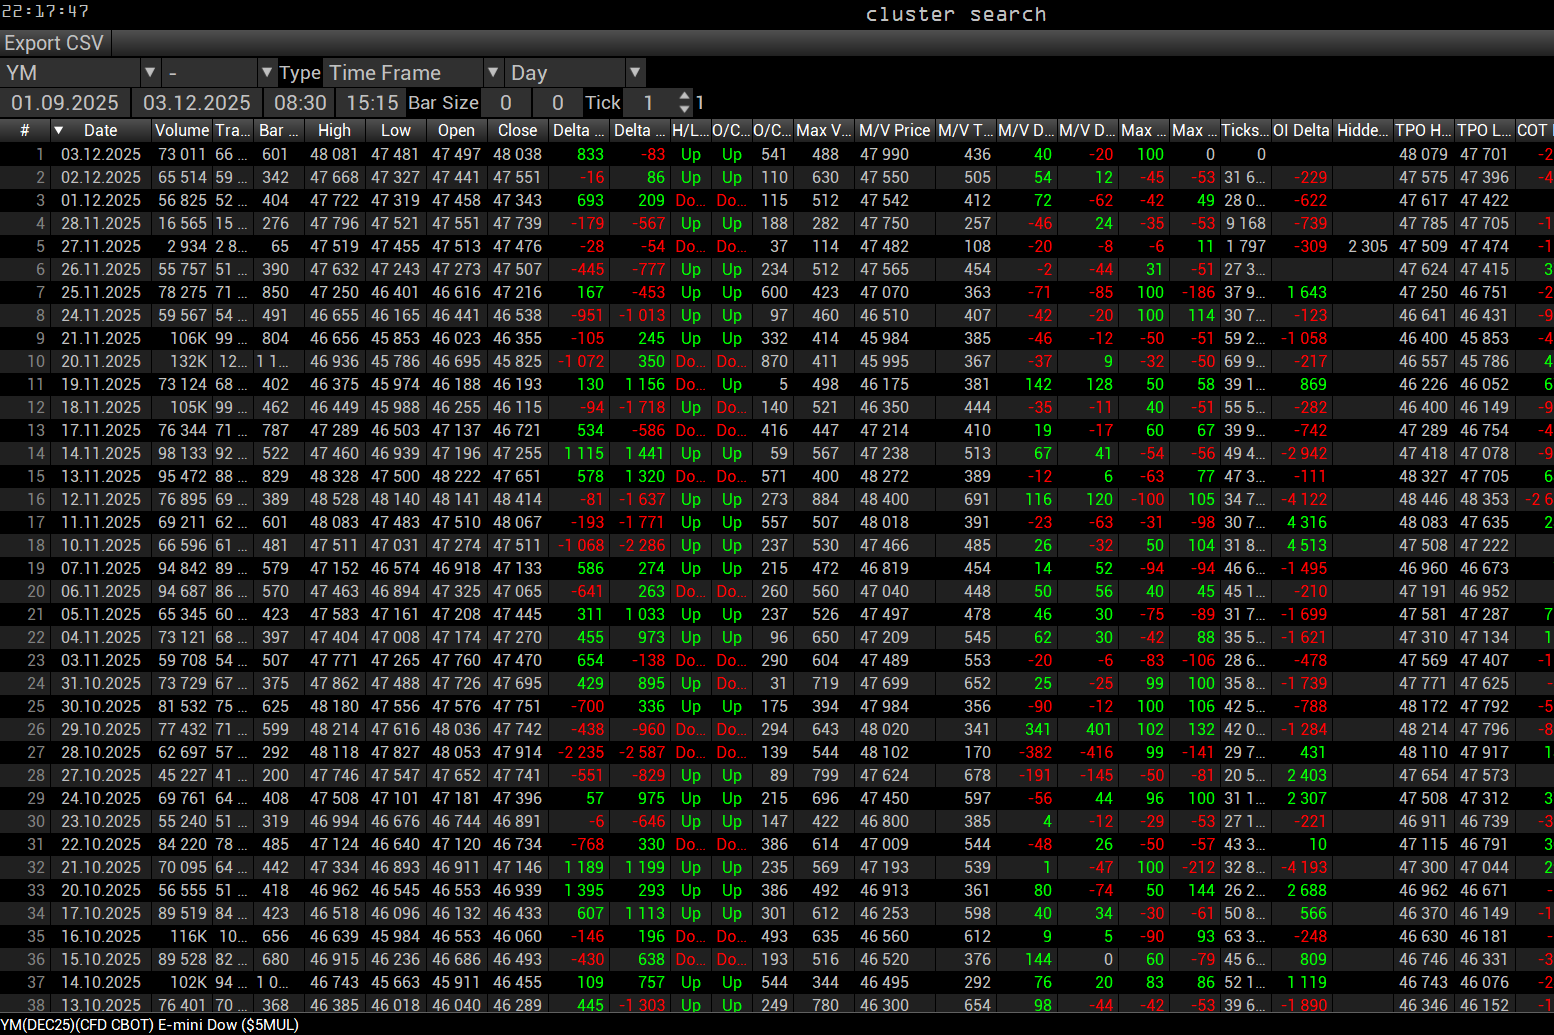
As the daily session, I take only the RTH (Regular Trading Hours) session, from 8:30 to 15:15 CT. This is the American exchange session. At this time, the timings for entering the market are the clearest, and the market itself is clearer.
I calculate volatility parameters in Excel or in other statistical packages, for example, Statistica. Below is an overview of volatility parameters with visualization:
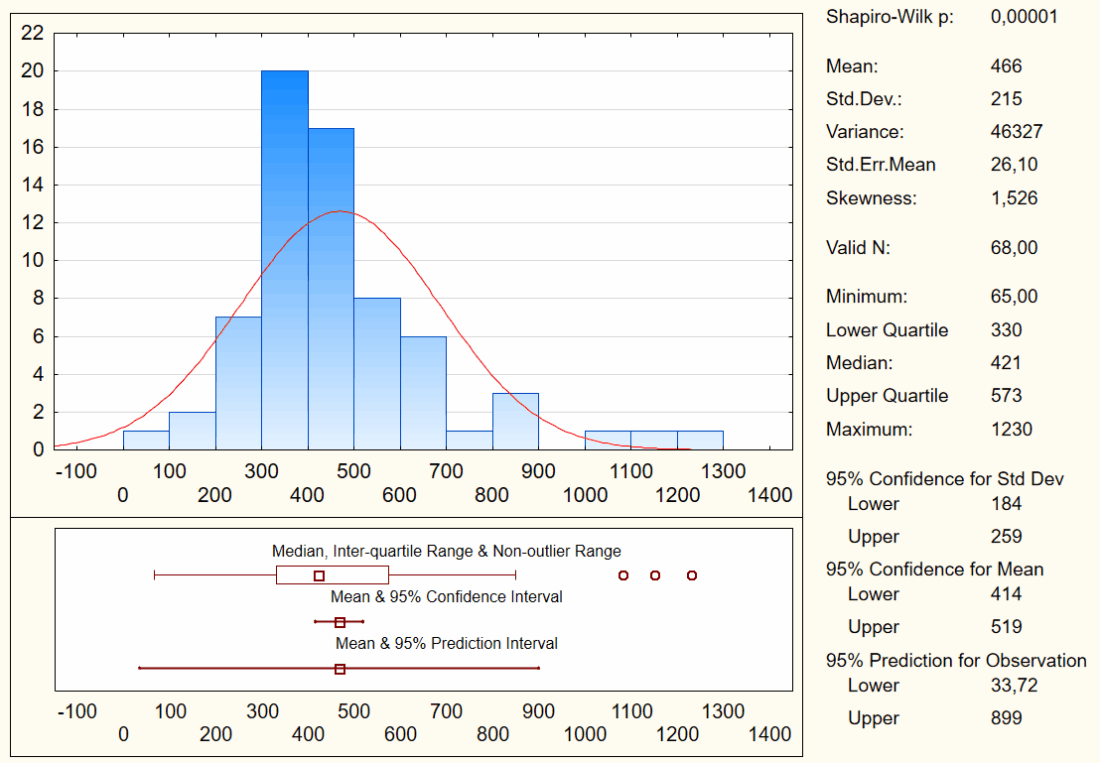

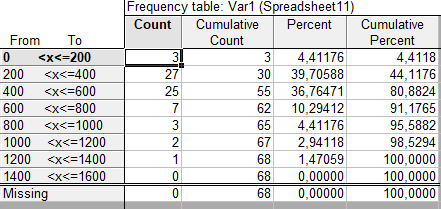
After analyzing 68 sessions, we clearly understand that in half of the cases the movement range is from 330 to 573 ticks, and 90% of sessions trade in the 265-787 tick range. At the same time, if you look a little deeper, 27 sessions were between 200 and 400 ticks, and 25 sessions between 400 and 600. And if you go even deeper, then 20 trading sessions took place in the 300 to 400 tick range, and another 17 in the 400 to 500 range.
Based on these figures, one can already build some assumptions about the potential of an open trade within the trading session, understanding that the quote has already moved 300 points and can reach 421 points in half of the cases.
In fact, everything is somewhat more complicated: you need to know the volatility parameters of the week, the whole day, the initial balance, and so on. This makes it possible to identify certain relationships. For example, having the parameters of the daily move and understanding that Europe has already passed it, one can assume either a reverse move in the American session or a sharp expansion of the range. These assumptions, in turn, should be based on an understanding of the market structure and its phase. I will talk in another article in more detail about how and why to calculate the movement range (volatility).
Volatility as the Speed of Price Change
High volatility is an unexpected sharp change in price in both directions within the standard range for the timeframe under consideration. Inside these moves on lower TFs, it is often very difficult to find a reliable entry point specifically for trading in such a high-volatility structure.
It is precisely in this sense - a sharp multidirectional price change within the standard traversal range - that I will use the term "volatility" in this article. Otherwise, I will use the term "range."
I should note that within a large range, volatility as the amplitude of movement also increases. But everyone has seen that already.
High Volatility: Swings or a Saw
We have already figured out what high volatility is. I want to devote a couple of paragraphs to two concepts from rich trader slang - "swings" and "a saw."
If you dig around on the internet, the concept of "swings" overlaps with the concept of volatility. Most often it is used in swing trading: two or three days of growth, a day or two of decline - bought at the lows, sold at the highs, you cannot hold positions too long. At the same time, in swing trading, swings mean a directional shift of the quote: on a higher TF this is movement along the trend, but with deep pullbacks. At the same time, if you go up one level, it turns out that the entire movement takes place within a very wide corridor.
I also extend the concept of swings to intraday trading. The main thing here is a wide amplitude (volatility) with a sharp change in dynamics. At the same time, the actual price displacement within the period may be minimal. And it is in this sense that I will use this concept below.
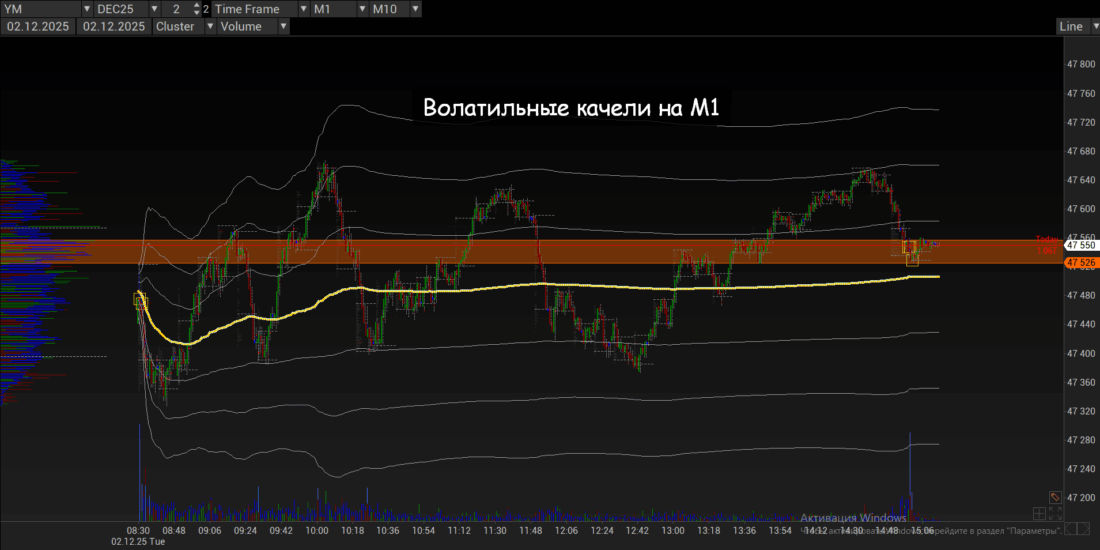
The figure clearly shows that the YM quote on the M1 chart repeatedly changed direction during the RTH session on December 2, 2025. On that day, the trading range was only 342 points, and how many moves there were!
Separately, I should note that many traders call swings, in my sense, a saw.
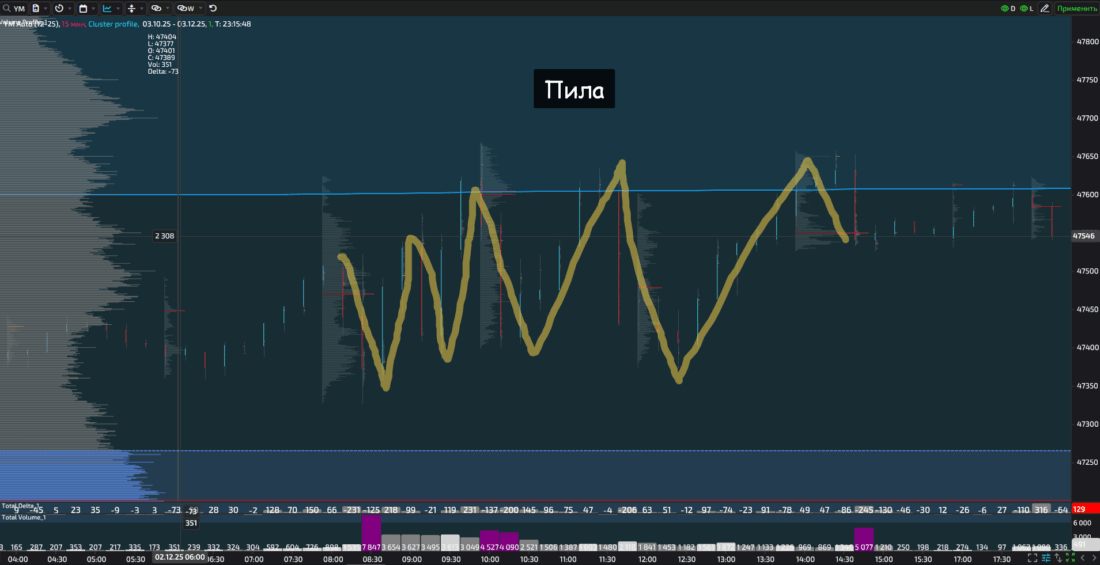
In the figure above, it is the same YM quote on December 2, 2025, but now on the M15 chart. And yes, this is an obvious saw.
I thought for a long time about what the difference between swings and a saw is. Now, personally for me, the difference is quite obvious, and it is not even at the level of sensations, but in statistics.
Swings are high speed and large amplitude, i.e. high volatility. A saw is low speed and small amplitude, i.e. low volatility. Within a day, swings can last 2-3 hours, no more. And a saw can stretch from 4 hours in one direction with a return in the other.
The result is slightly different higher-timeframe profiles. With a comparable range, the swings profile is distributed relatively evenly, each cluster is traded weakly, liquidity is smeared out. But in a saw, each cluster is traded well, there is a clearly expressed liquidity accumulation zone. A "saw" type session is more likely a balance (corridor), only a very narrow one.
And if on a lower TF (for example, a one-minute chart) we see excellent swings, then at the same time on M15 we observe an unpleasant saw.
Swings on a lower TF are always a saw on a slightly higher TF. At the same time, a saw on a higher TF will by no means always be swings on a lower one.
The Main Secret of Swings
The market is work with information. Smart money is smart precisely because it knows not only how to work with information, but also how to obtain it earlier than others. How exactly smart money obtains information earlier than others - let the SEC (U.S. Securities and Exchange Commission) or, for example, the Central Bank of the Russian Federation figure that out.
When smart players receive the information they need, they prepare to load money into the market. You cannot load a lot at once in the required range: the DOM will not let it through.
What should be done? Shake the quote to collect the stops of all extremely nervous or very cautious passengers, as well as lure algotraders into the volatility and open your medium-term positions against their ultra-short-term liquidity.
How does this happen technically? I do not have an answer, but as a result liquidity is gathered in a wide range, rather than in a narrow one, as usually happens. In any case, after the swings are rocked, either a rocket launches into space or the first knife falls: it all depends on which way the quote was loaded.
I think the main secret of swings is already clear to you.
If not, then I will explain: swings - high volatility - are a harbinger of a strong one-sided impulse.
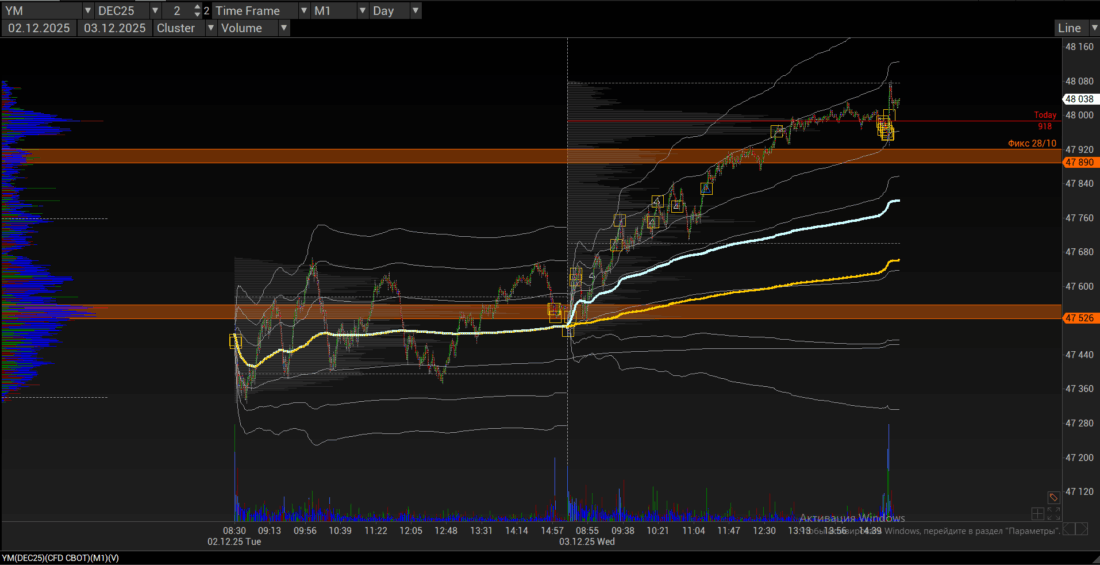
The same YM instrument, but now the December 3 chart has been added. If within the standard session on December 2 we observed high volatility, then the next day the session range was 641 points. The movement had a clearly pronounced impulsive character, and there is a non-zero probability of the movement continuing.
How to look for an entry point into an impulse after high volatility ends
High volatility is often the completion of volume accumulation in a flat and a harbinger of movement.
Good arguments for expecting an impulse:
- Timing. A volatile session is the second or third session in the corridor (balance). That is why smart money has someone to shake out of the market.
- Established corridor boundaries. There are clear boundaries that the quote pierces.
- The place of the balance (corridor). It is good if liquidity accumulation is going in the direction of the trend, for example, within a flat or downward correction of a rising impulse on the higher TF.
- An expected news trigger. Volatility precedes news or events.
Let us examine the same example.
Volumes were accumulated on December 1 and 2, 2025. Let me remind you about the timing: the beginning of the month, and also Monday-Tuesday. An ideal combination.
On Monday, December 1, the boundaries were marked: support below in the 47326-37630 range, resistance above in the 47690-47710 and 47586-47622 ranges, and Monday's main trading took place in the 47490-47560 range. If there is almost no money above, then a decent amount was accumulated below at the close of the trading session, the specialist's working time.
On Tuesday, December 2, volatile swings began, when unnecessary passengers were thrown out of the market. The day closed in the 47530-47560 range.
Assumptions
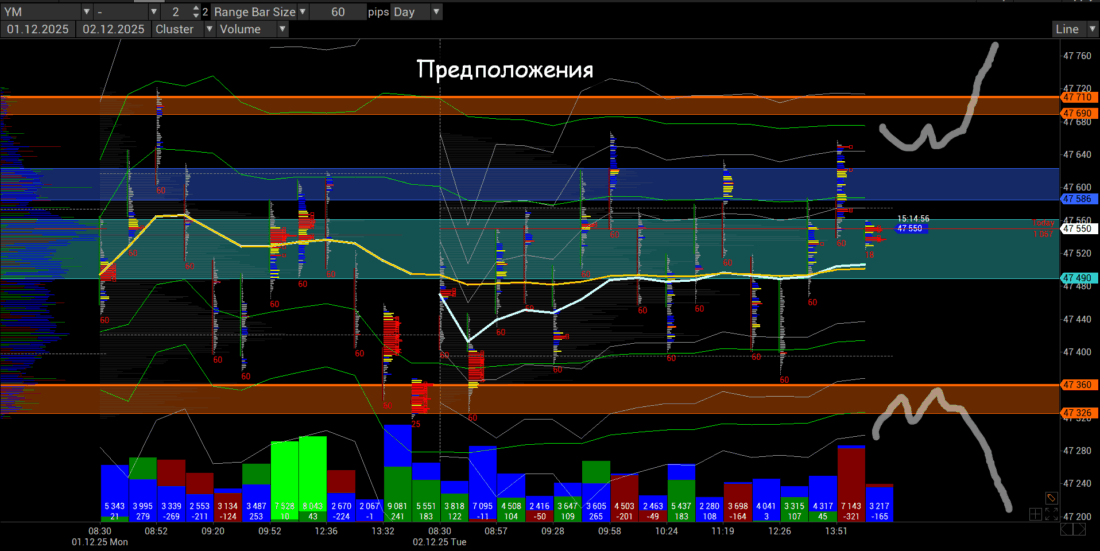
- If America opens below 47300 and under no circumstances goes above 47350 by 9:00 CT, that is a very strong argument for sales.
- If America opens above 47550-47600 with a sharp move upward, then we need to look for where to join in.
- If America opens inside the range, then we wait half an hour, until 9:00 CT, and join those who control the quote.
Result
America opened within 47490-47520. And at 9:00 CT the quote is confidently moving above 47600. By 9:30 CT, work is underway near the money that was marked as very weak resistance, the 47690-47710 range.
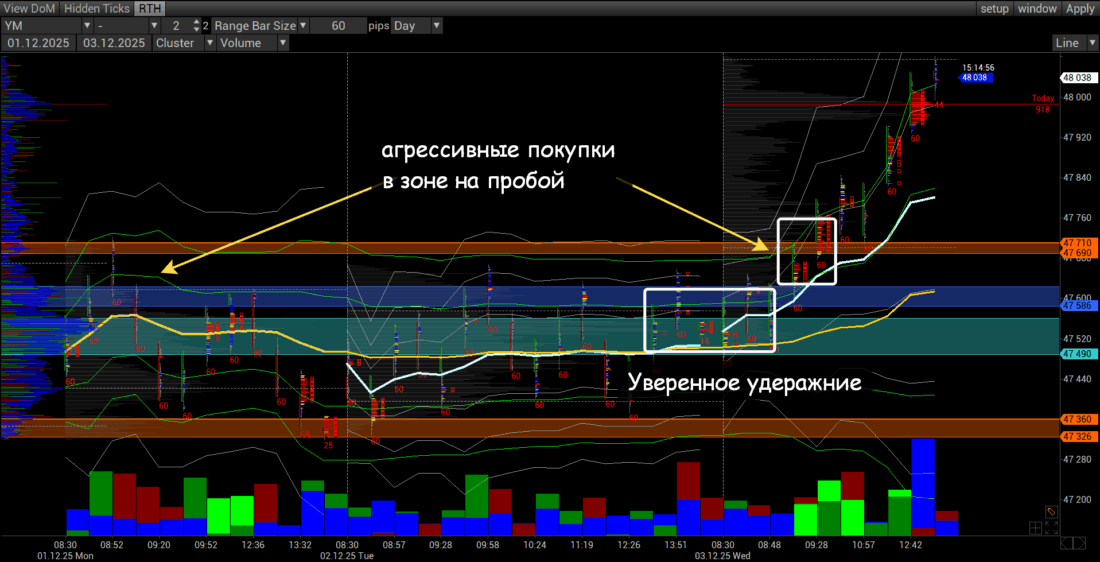
If there was no entry at 9:00 CT or 9:30 CT, then around 10:50 CT there was the last point of no return.
Several important questions
Can you look for an entry point before volatility is finished?
Everything depends on the context. If volatility is happening on Wednesday-Thursday after two days of work in a flat, then from 10-12 CT the start of the dynamic may begin. Here you need to watch the market.
In our case, it was possible to open a position with a carry through clearing after 12:00 CT on December 2 above 47700 once it had secured there.
Can you open a trade during the European session?
If the high volatility of the previous American session ended with the start of an impulse, then Europe will most likely trade in a flat, and you can look for an entry point.
If, however, as a result of the previous American session the quote remained in balance, then it is worth waiting for distribution specifically during the American session, because Europe may give false moves or America will take out stops at the RTH open, as in the example under consideration.
How long should the trade be held?
Usually the impulse continues for 1-2 days. Everyone decides for themselves. But by the end of the first impulse session, it is worth closing part of the profit in order to reduce risks.
What type of session should be expected after a volatile one?
One should expect an impulsive session.
What is the expected movement range of an impulsive session after a volatile one?
2-3 times longer and in a clear direction.
How should risk be managed?
If there is an understanding that the upcoming session will be impulsive, then the risk per trade can be increased, while not forgetting the general rules of capital management.
What exceptions are there?
High volatility often happens at the end of a move. In that case, it is a signal of completion (profit-taking after a climax), not the beginning of a move. Here there are slightly more development options: gradual fading within the range or the start of corrective dynamics, but not a very strong one.
Can you ride the swings?
Children on the playground can. But for traders it can be very dangerous, because the market most often punishes lovers of this kind of trading. Especially if the impulse occurs after 10:30 CT.
First, one should remember overtrading. Such sessions lead to overtrading, and impulsive sessions are no longer "readable."
Second, during such sessions many begin trading without stops, because everything seems clear and fast. At the start of the impulse in the same session, the player either holds the loss to the end, draining all the profit accumulated earlier, or, after getting stopped out, tries to sell a new high, which is not a high at all, but flat loading into a buy.
Respectfully,
Ivan Rusin