
WYCKOFF · A / B / C / D / E
Effort vs result: volume in the Wyckoff method
A tall volume bar does not establish the direction of the next move. Identify what the source measures, which closed candle you are examining and where its price finished relative to the chosen range. One numerical threshold cannot replace those three checks.
Two observations, not one tall bar
Effort versus result compares volume with price movement. Record both measures and the observation period to make that comparison repeatable. High volume is not evidence of a particular buyer: an aggregated candle does not reveal participants' identities.
In TLAP choose the ticker and timeframe, then check the closing time and range boundaries. Compare equal intervals from one source. Moving numbers from 1H to 4H without aligning the period changes their meaning; comparing different instruments also introduces different volume units.
Exchange volume and proxy volume
An active row below explicitly identifies proxy volume when that is how the instrument's source is configured. Such a series supports relative comparisons within its own observations, but must not be called total market volume. Exchange volume also needs its venue and observation scope identified.
Do not combine numbers from different venues without defining the aggregation. If the provider or unit changes, record that boundary in the comparison. Missing observations are not zero trading activity; they mean no verified value is available for that interval.
A practical order in the scanner
Locate active accumulation or distribution first, then the specific event and its closed candle. Compare its price movement with nearby comparable observations. Record the new snapshot date after an update: today's row and yesterday's screenshot may refer to different boundaries or phases.
The live block includes both structures and phases A–E. It locates observations but does not calculate a volume recommendation. A listed row does not establish agreement between effort and result. Open the chart and inspect its actual data rather than drawing a conclusion from the phase label.
What the educational image omits
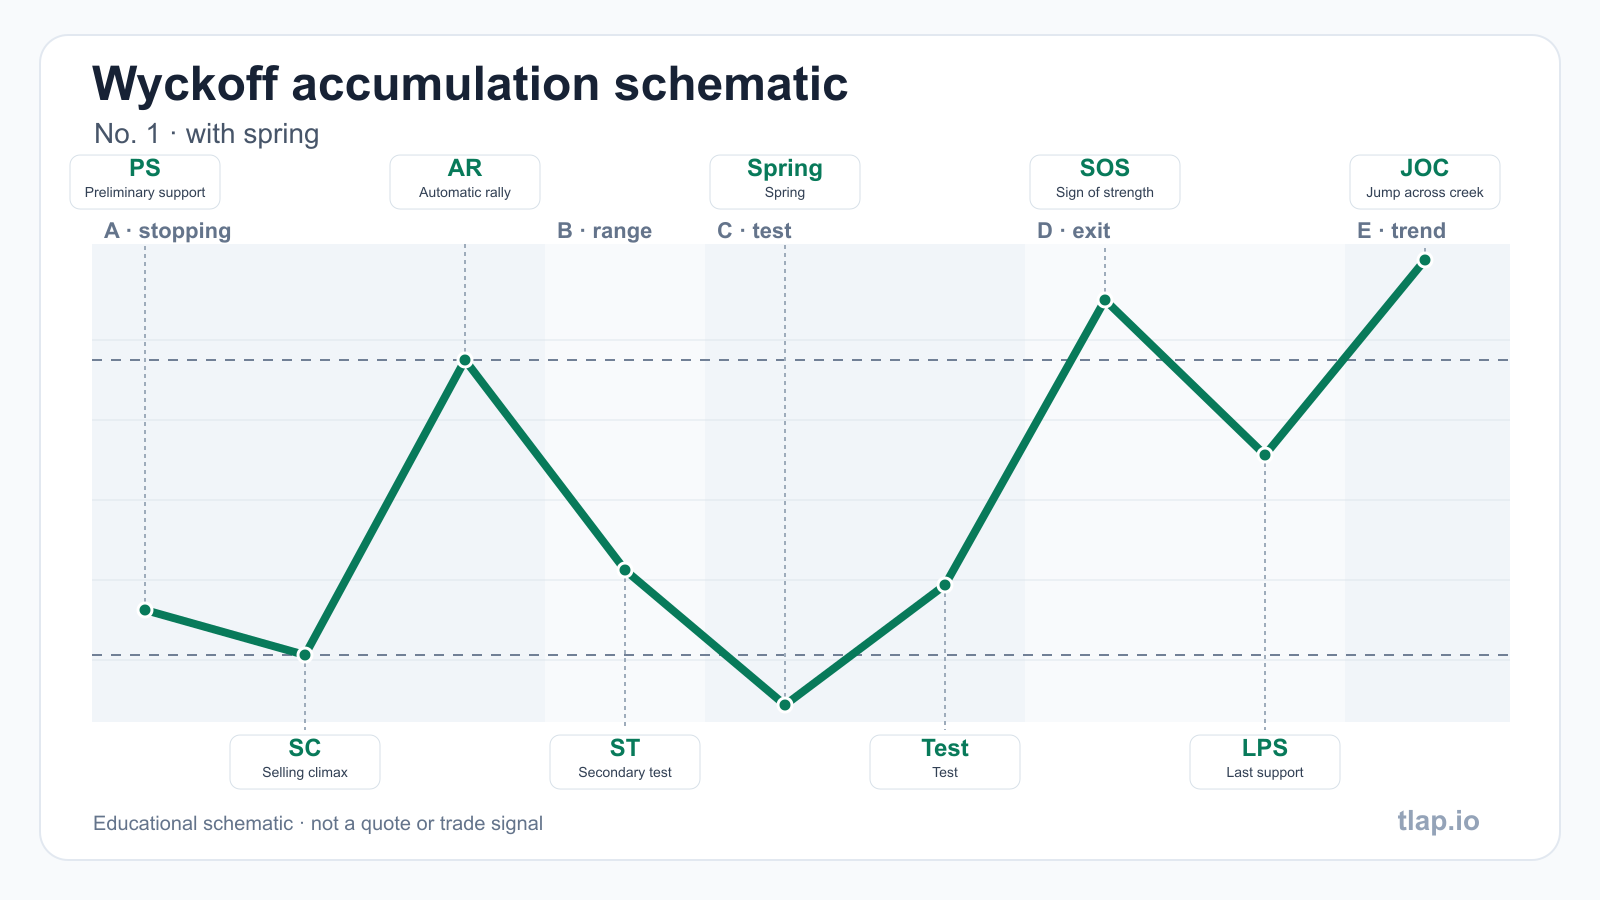
Atlas drawings show event order and price on an illustrative scale. They do not contain current candle volumes. Do not copy the drawn fluctuations into a live series or infer a statistical outcome from them. The event outcome in history is a separate measurement and may remain without a result.
Agreement and divergence between effort and result
Agreement is not merely the presence of two large numbers. Compare the closing direction, candle spread and volume with preceding comparable bars. A wider spread on elevated volume shows that the observed effort accompanied a visible price result. A narrow spread on elevated volume describes something different: the feed recorded substantial activity while price advanced little. This is a relative observation about one series, not a complete explanation of who traded or why.
Divergence is most useful near a boundary identified in advance. High volume and weak continuation near support or resistance may be compatible with absorption, but one candle cannot establish accumulation or distribution. Inspect subsequent closes and the range state. If price crossed a boundary and returned, read the event label and its confirmation separately. If the range has already closed, the earlier divergence remains a historical observation and does not describe the current phase.
How the scanner handles relative volume
An event's relative volume is compared with preceding closed bars for the same instrument and timeframe. The value therefore belongs to that sequence and cannot be transferred directly to another market. A zero average, a missing value or an incomplete series leaves the ratio unknown. The scanner does not turn such a case into zero or use it as confirmation. The displayed ratio is rounded for reading, while threshold checks use the unrounded value.
For instruments labelled proxy volume, price markup remains available, but volume does not confirm an event and is not presented as total market turnover. This distinction matters for forex, metals, oil and indices because the number belongs to the configured feed. Real-volume cryptocurrency observations also retain a source boundary: one venue and trading pair. Compare intervals only when source, unit, timeframe and candle-closing rule are aligned.
Evaluating the outcome without future knowledge
The scanner first records an event on a closed candle and evaluates its outcome later within a defined window. Reaching the target, invalidation and no result are separate completions. Later movement cannot be moved backwards and presented as information that existed when the event appeared. For a repeatable check, save the snapshot time, range boundaries, volume or its unavailable state, and the current status. Compare the next record with the first without deleting cancelled cases.
History recalculated under current rules answers how today's algorithm would mark stored candles. It does not prove that the same label was visible to users in the past. The scanner therefore separates recalculated samples from original observations and reports their sizes. Neither a high share nor a striking example turns the description into trading advice: every outcome belongs to a published rule, a particular source and the stated observation period.
Check the denominator as well. A share without a count of completed cases does not show how stable an observation is, while combining timeframes hides differences in duration. No result within the defined window is not the same as invalidation: price may have remained inside the range. Cancelled events also remain visible so that the sample does not contain only successful examples. If the source is unavailable or delayed, the current result is unknown and cannot be replaced with zero events, zero volume or an undated older snapshot.
FAQ
Can BTC and EURUSD volume use one threshold?
Not without aligning sources, units and intervals. The scanner explicitly identifies proxy volume.
Does the diagram contain current volume?
No. It is an educational price schematic; current candles and their values must be inspected in the instrument.
What does an unavailable summary mean?
The number of active ranges is unknown. Missing source data does not become zero volume or zero structures.