
Global Markets in a Period of Turbulence. Part 2.

Market turbulence is mounting. Although it might seem...
The stock market reacted calmly to the Fed's rate hike: as they say, it was already priced in. The failure of the Clarity Act in the US Senate had no effect on cryptocurrency holders: the major coins are holding firmly at established levels, while ETH even set a new local high.
Yet tension and turbulence continue to mount. Here, for example, is the US 10-year bond yield chart.
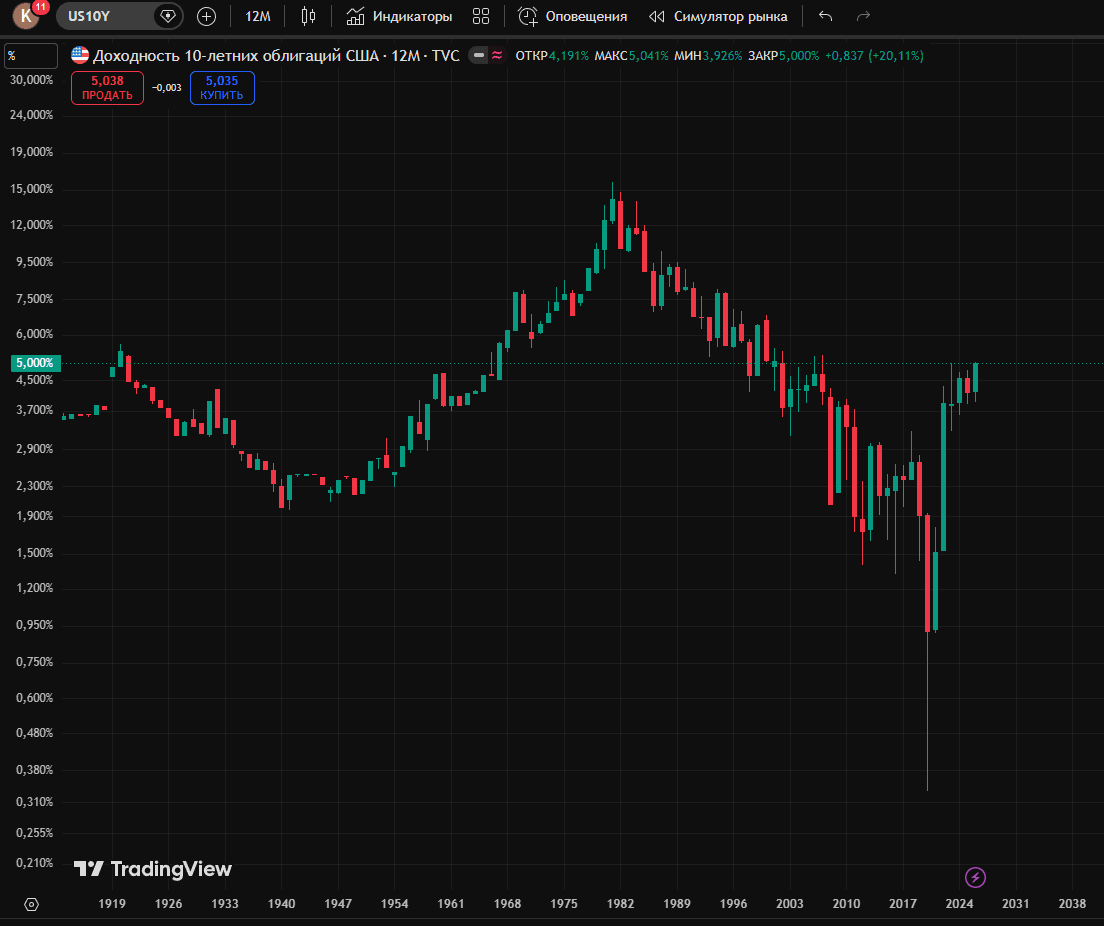
This is a monthly chart. The yield has now returned to the levels seen in late 2007 and early 2008. Except that 5% was low then, while now it is extremely high.
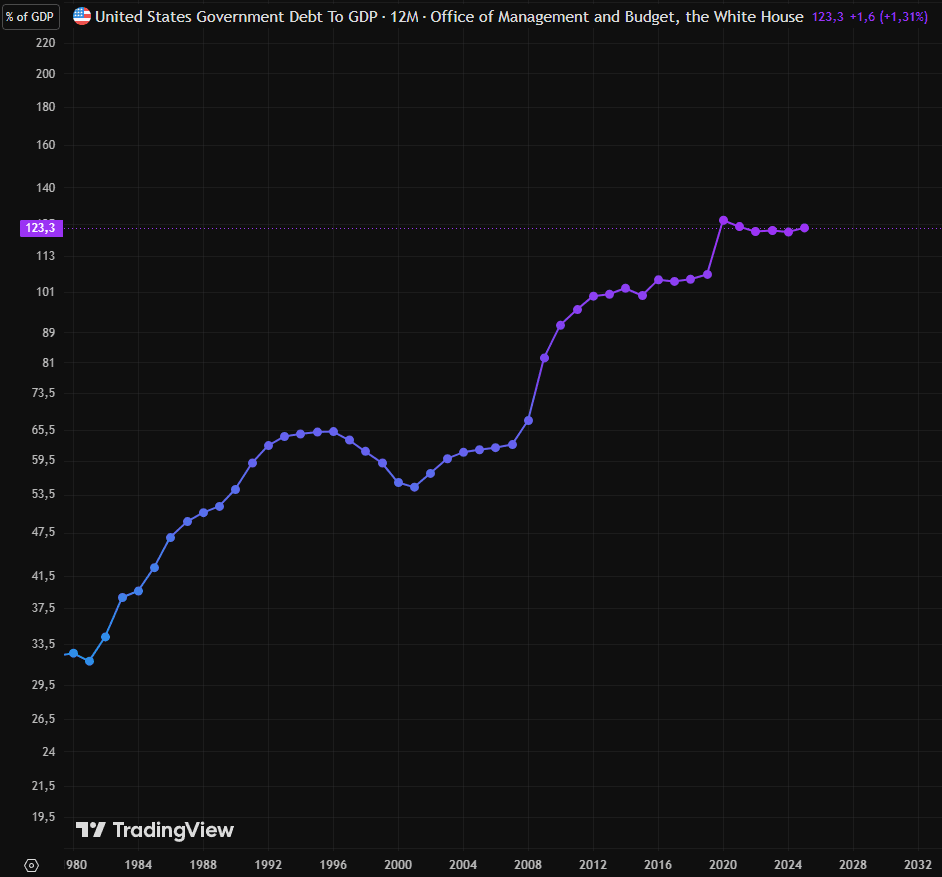
Back then, federal debt stood at around 65% of GDP, whereas it is now above 123%. This means that $5% then and $5% now are completely different in terms of their impact on cash flows.
Let me explain very simply. You earn a salary of 100 rubles. And you owe the bank another 65 rubles (65% of your income). The rate is 5%. If you pay only the interest without repaying the principal (which is how bonds work), then every year for 10 years you pay the bank 3 rubles and 25 kopecks, and after 10 years you repay the debt. Suppose that over 10 years your salary has risen to 200 rubles. But the debt is now 123% (246 rubles). In this case, a 5% rate already means 12.3 rubles annually. And here is the result. Income has doubled, while the monthly interest expense has increased 3.78 times. Now imagine that 10 years ago you lived alone, whereas now you have a family to support, and so on. Overall, the situation is not an easy one. Yet we are talking about the same 5%, which is quite comfortable in one situation and very uncomfortable in another.
Rates are rising everywhere: Japan, Britain, France, and so on. And everywhere it is becoming increasingly painful.
It might seem that central banks could simply lower those rates. But inflation has also moved beyond all reasonable limits.
Lowering the rate would sharply accelerate monetary inflation, which is now thoroughly structural in nature. To simplify greatly: everything is currently becoming more expensive because of fuel, while rate cuts—and especially turning on the printing press—would add an abundance of money to the shortage of resources. Everyone can decide for themselves where that would lead.
The official US Treasury curve shows that the 10-year yield rose approximately as follows:
September 9 — 4.06%
September 15 — 4.76%
September 18 — 4.83%
At the same time, the US government is planning very large borrowings: estimated net marketable borrowing is $739 billion for Q3 2026 and $628 billion for Q4. And where can it get the money? Nowhere, except perhaps at 5%. Later it will be even more expensive. And it cannot simply refrain from borrowing.
So, dear readers, turbulence is mounting. Bitcoin is not showing it yet. But perhaps the Dollar Index will.
Therefore, in today's review we will first look at volume placement models for DX (US Dollar Index futures, traded on ICE), after which we will analyze ZN futures ($10-year US Treasury notes, traded on CBOT).
DX
The Dollar Index has almost gathered enough strength for an imminent breakout upward from balance. That is the 1st idea.
The $2nd idea is that the Dollar Index is near the upper boundaries of the value area and will turn south at some point in the relatively near future.
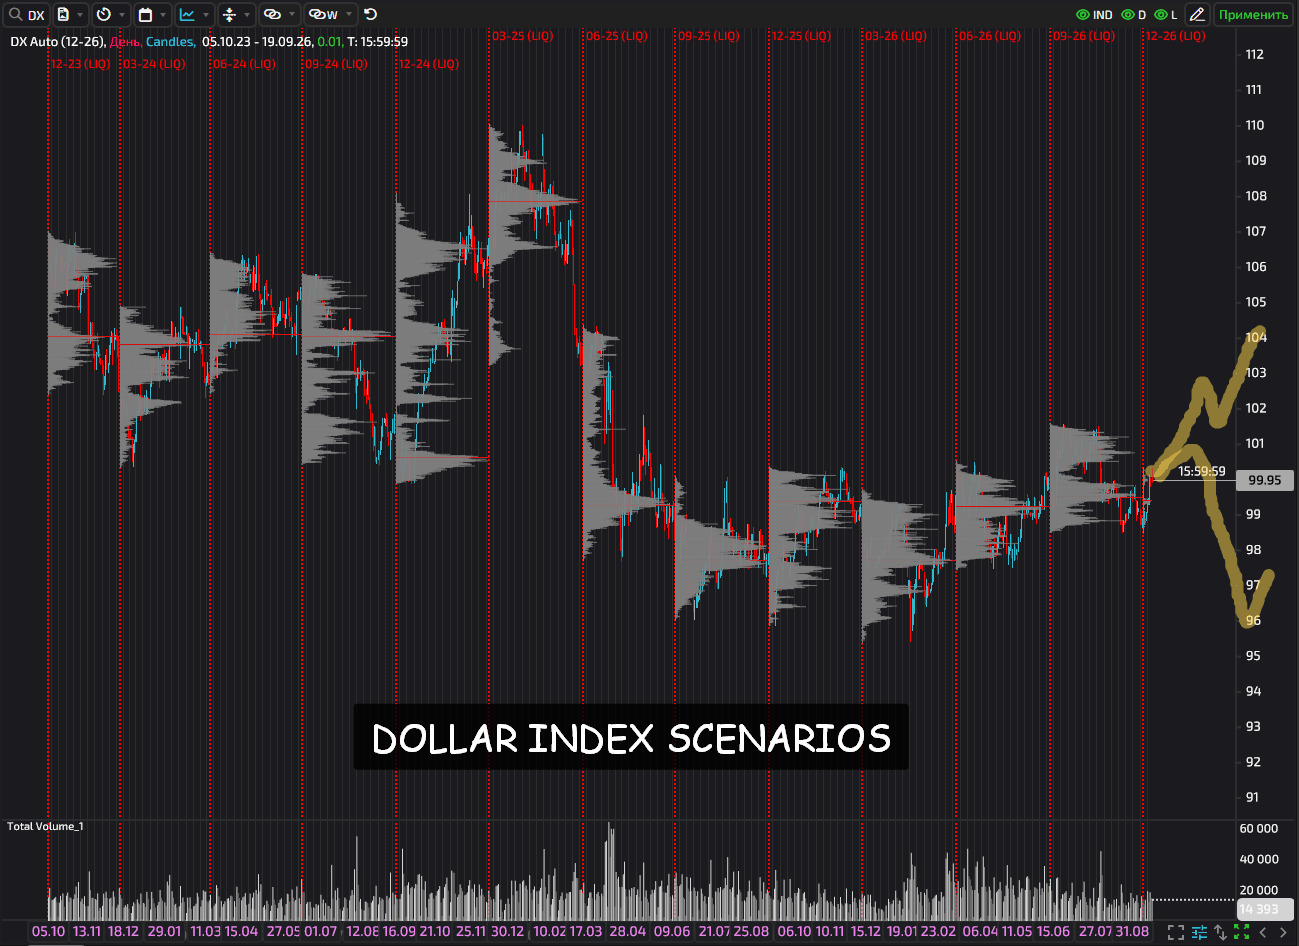
Now let us take a closer look.
The 98.50–99.50 zone is the most important one in the medium term. The index has been returning here constantly for a year: speculators are playing against the dollar to some extent, but the real world requires this kind of dollar value.
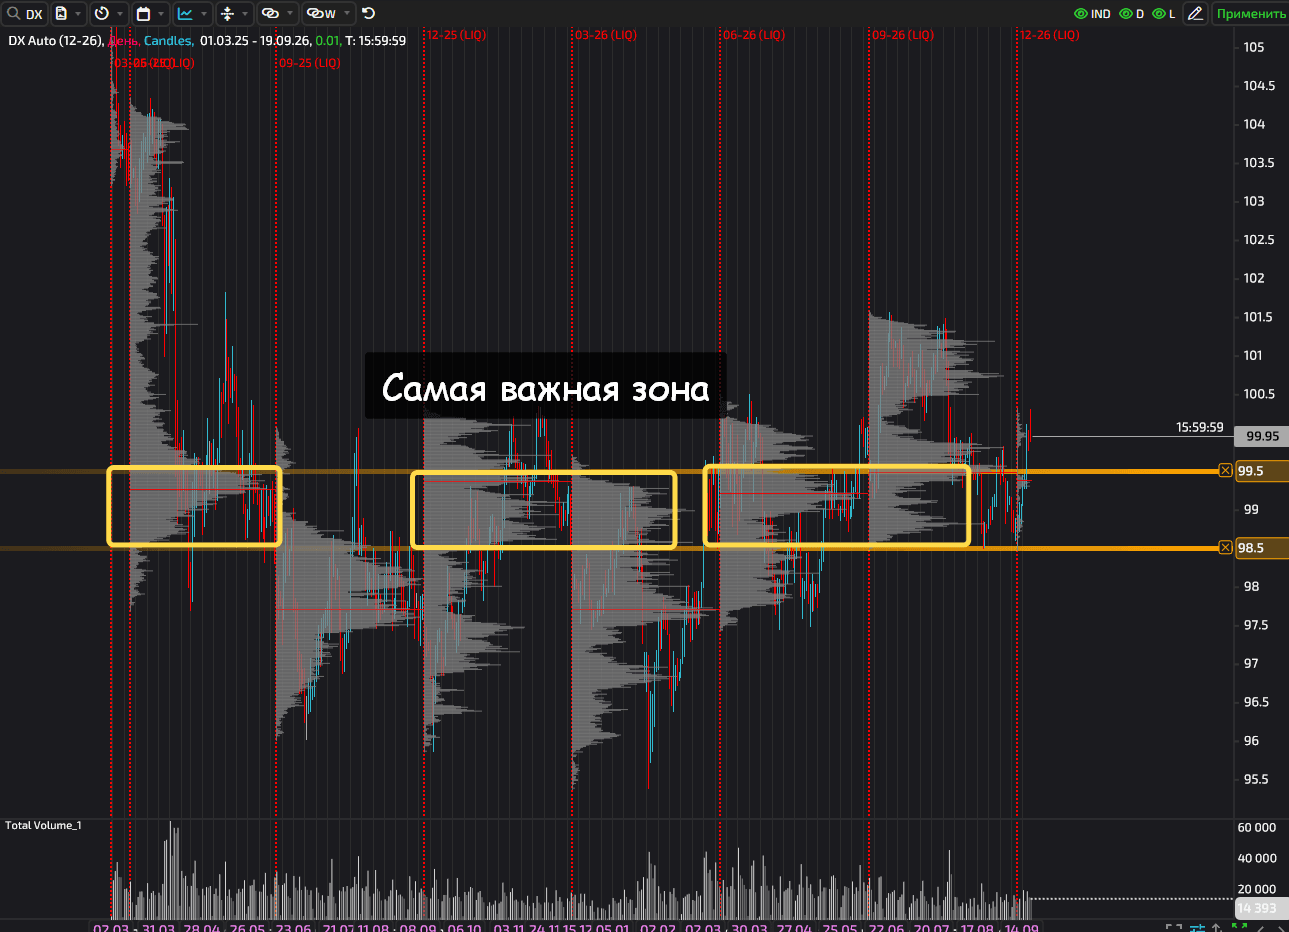
The new contract got off to a lively start. It moved from 98.50 to 100.30 starting 1.5 weeks ago. The volumes are unimpressive, of course, so the move may still raise questions.
In any event, it stalled at a fairly predictable point. The 99.85–$100.25 range has repeatedly acted as resistance, both in terms of price and volume. It also served as support in the previous contract, until the downside breakout on July 30.
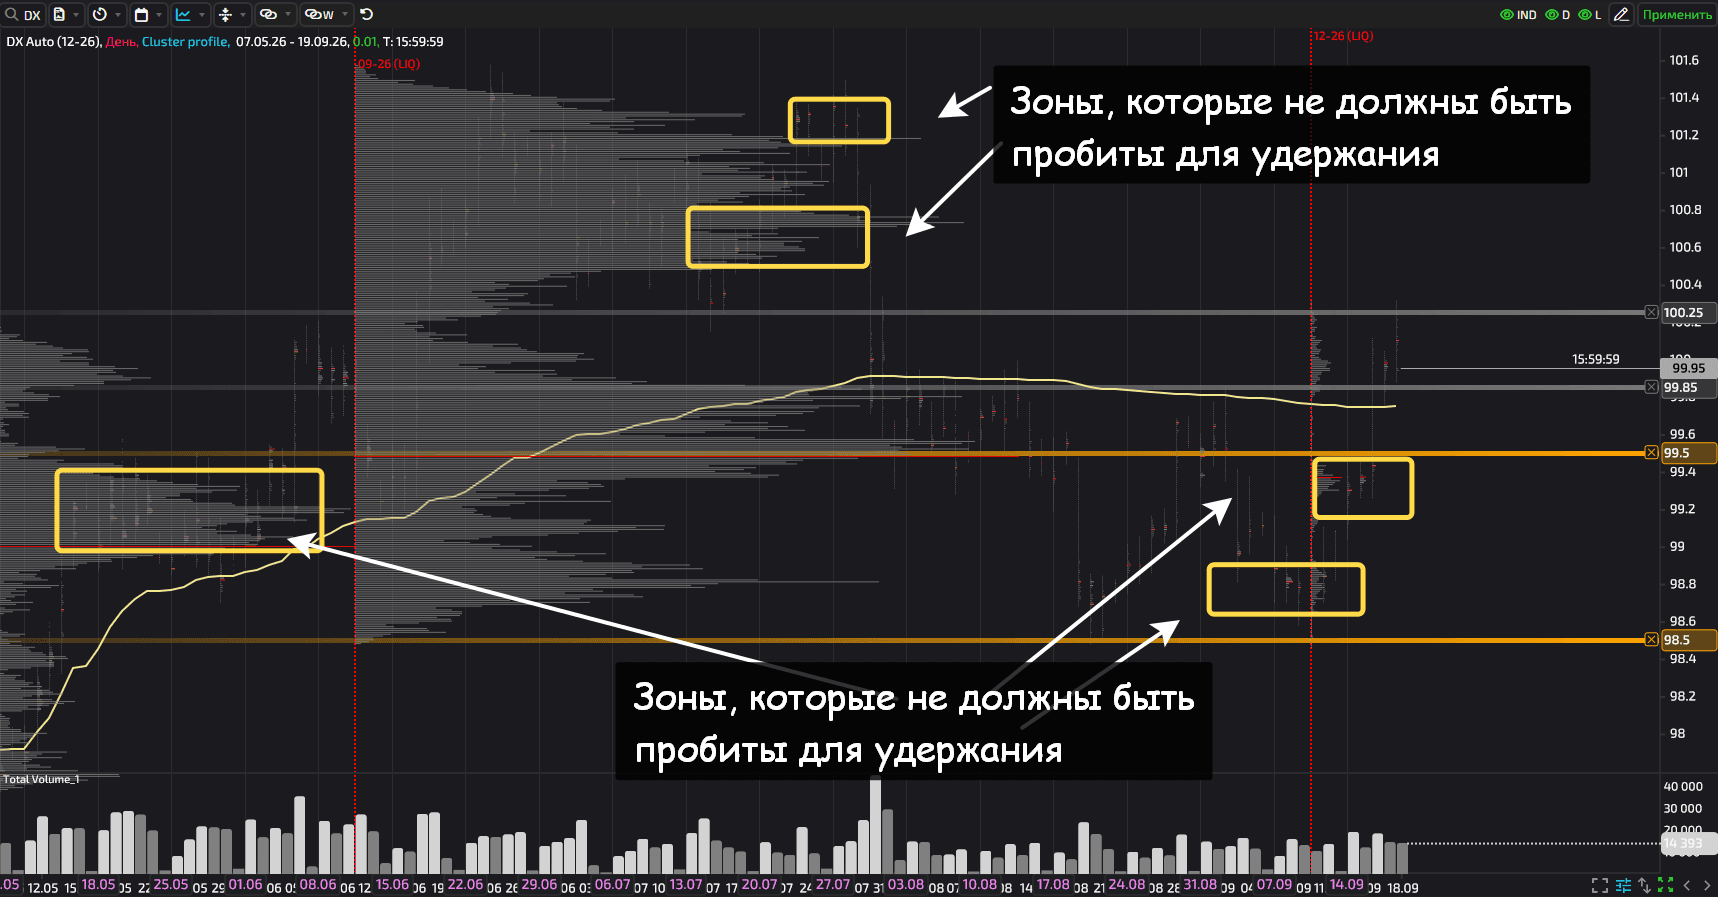
The current position in the auction is rather ambiguous. The July–August FVG has already been traded through. Price could trade around $100.50 without moving much higher. It could move to around 99.50. Neither would fundamentally change anything.
Questions for buyers will arise below 99.00, and even more so below 98.50. Questions for sellers will be appropriate above 100.50–101.00.
Meanwhile, the local action has a distinctly impulsive appearance.
Buyers were active at 98.72–98.88. Then they acted very aggressively at 99.12–99.16. They subsequently bought calmly above 99.30. The boldest bought at 99.38–99.43. Some sort of balance will be found in the 99.83–99.99 range.
In a very aggressive scenario, we expect further growth. Still, I would watch how they trade through the FVG. The key zone is 99.50 ± 0.1. It contains both the start of the latest imbalance and the contract VWAP.
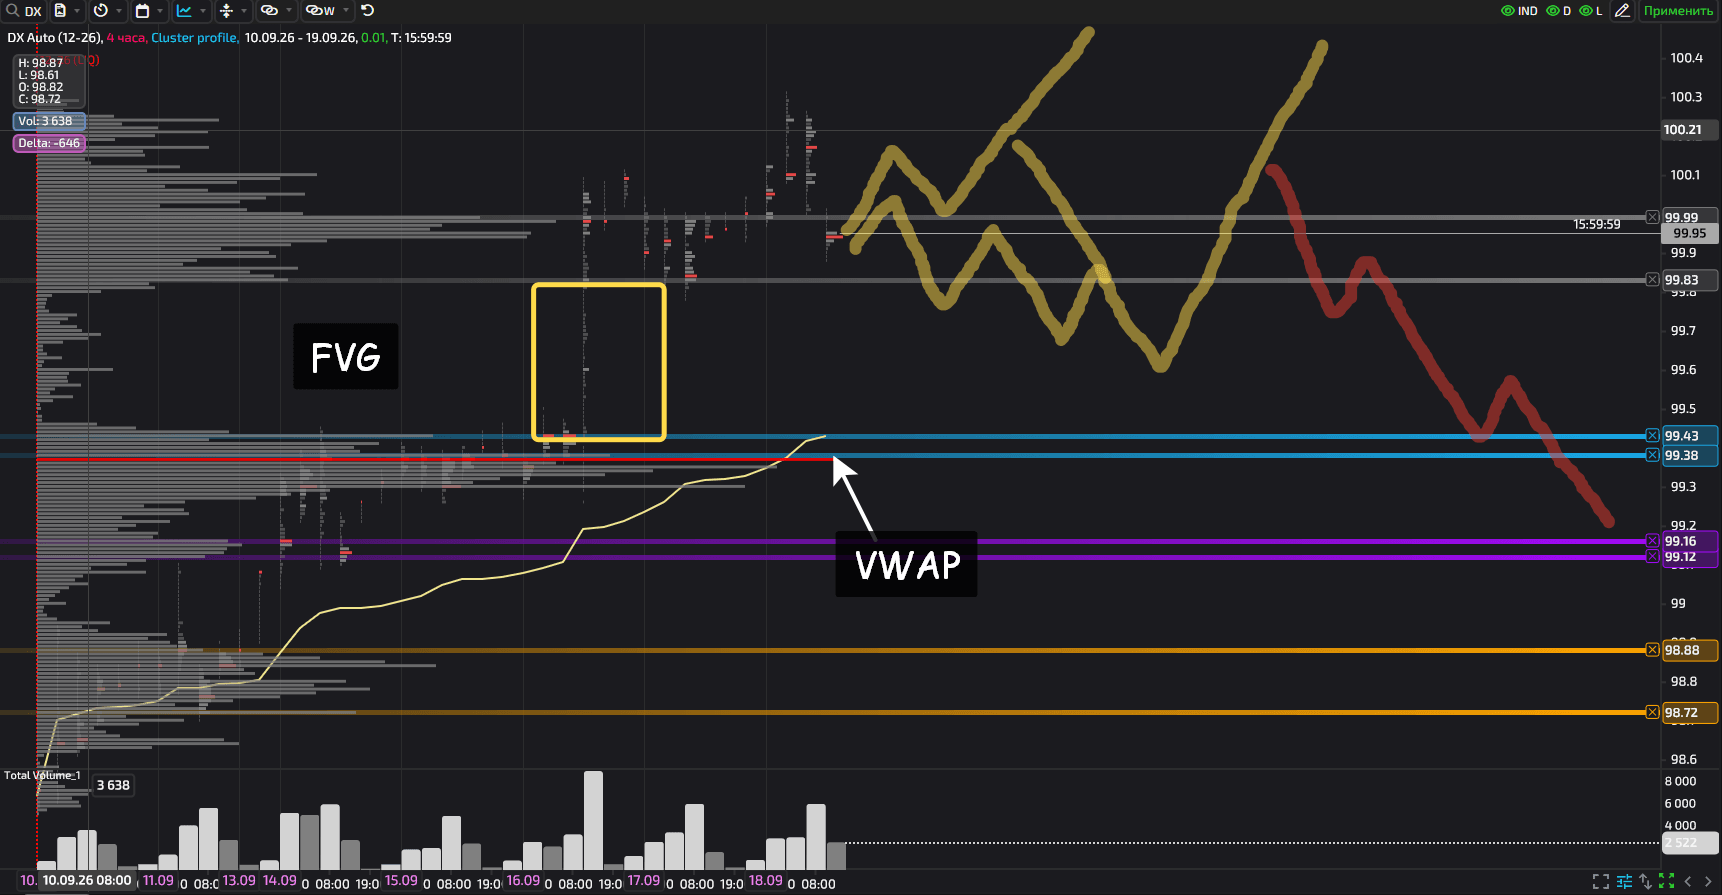
In an aggressive scenario, growth is possible from around the current levels. In a realistic one, it would come after the FVG imbalance is closed—the back-and-forth push and pull typical of currencies. Repositioning short may be possible after some volume accumulates over 2–3 weeks.
ZN
While the terminal loads the quote, here are a couple of general points.
Underlying asset for ZN: 10-year US Treasury notes with a face value of $100,000.
These futures allow traders to gain exposure to long-term US interest rates without having to buy the notes themselves. They are used both for speculation—trading changes in rates—and for hedging. For example, bond funds can open positions in ZN to protect against rising interest rates.
Let me clarify straight away: a bond has a face value ($100,000) and a current market value. The bond issuer will ultimately repay the face value, but while the bond is trading on the market it may be cheaper or more expensive than face value; in other words, it behaves like an ordinary speculative asset.
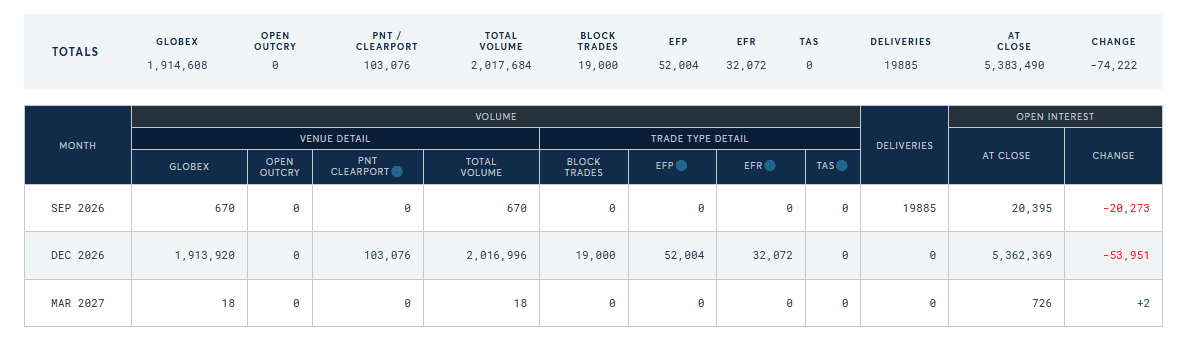
ZN is probably the most liquid futures contract in the world. Total open interest is typically above 5 million contracts.
There are 4,000–5,000 contracts resting in the order book at the nearest prices. That is 20 times more than on ES (S&P 500 futures).
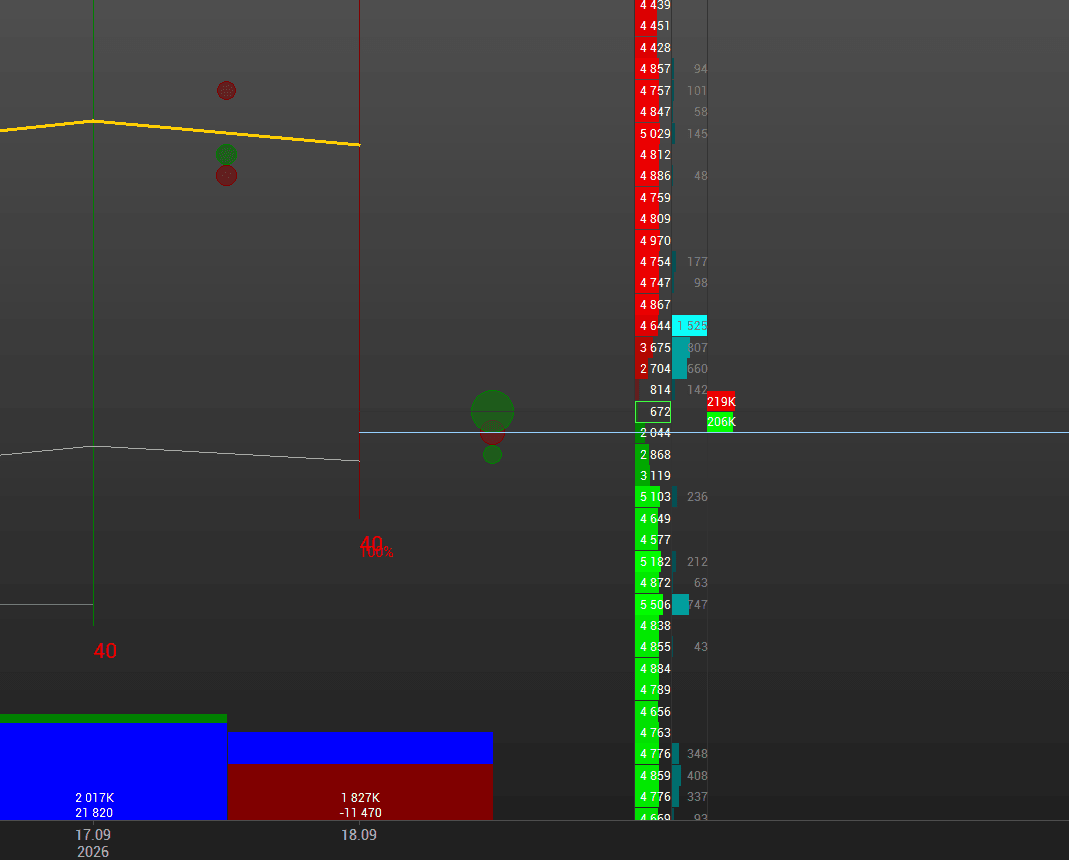
Trading is fairly unusual. Traders will suddenly execute 2,000–5,000-contract trades and then immediately stop trading. Sharp liquidity imbalances occur everywhere, but they are especially characteristic here: thousands at once, followed by single contracts.
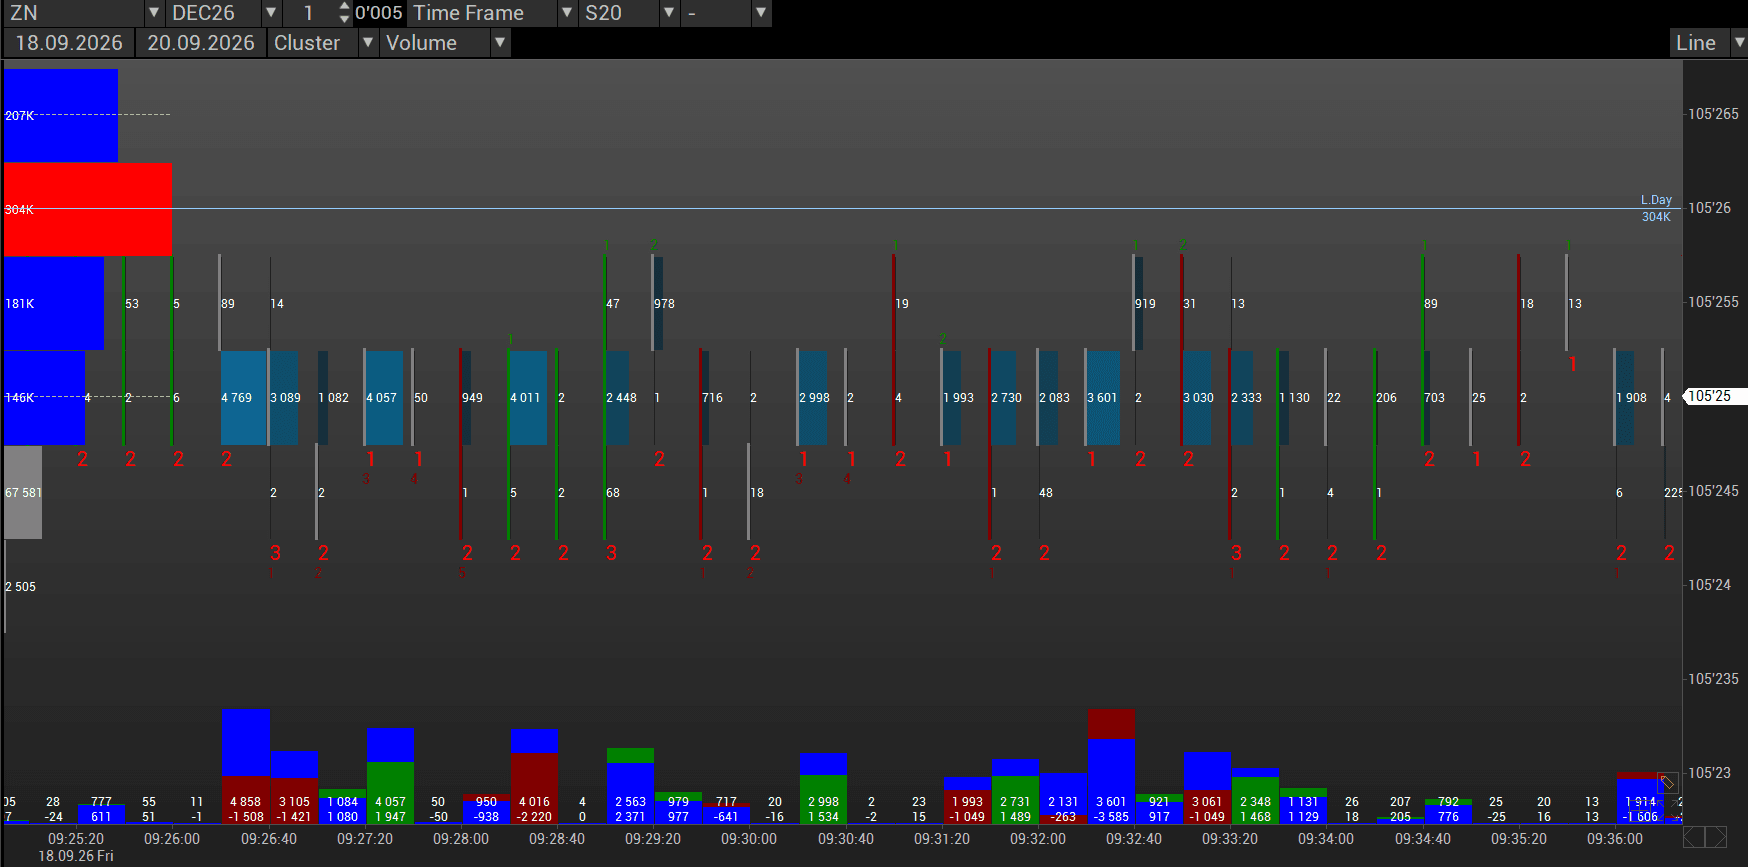
Now the quote has loaded, which means it is time to see what speculators and hedgers are doing in the futures contract.
The instrument is clearly in a short impulse. That makes sense. If investors expect a 5% yield on new securities, older ones must be brought in line with that yield. That means pushing their price down. It is as simple as 2 × 2.
Here is the chart from January 1, 2026. The trend lines work absolutely perfectly. Just like in a textbook.
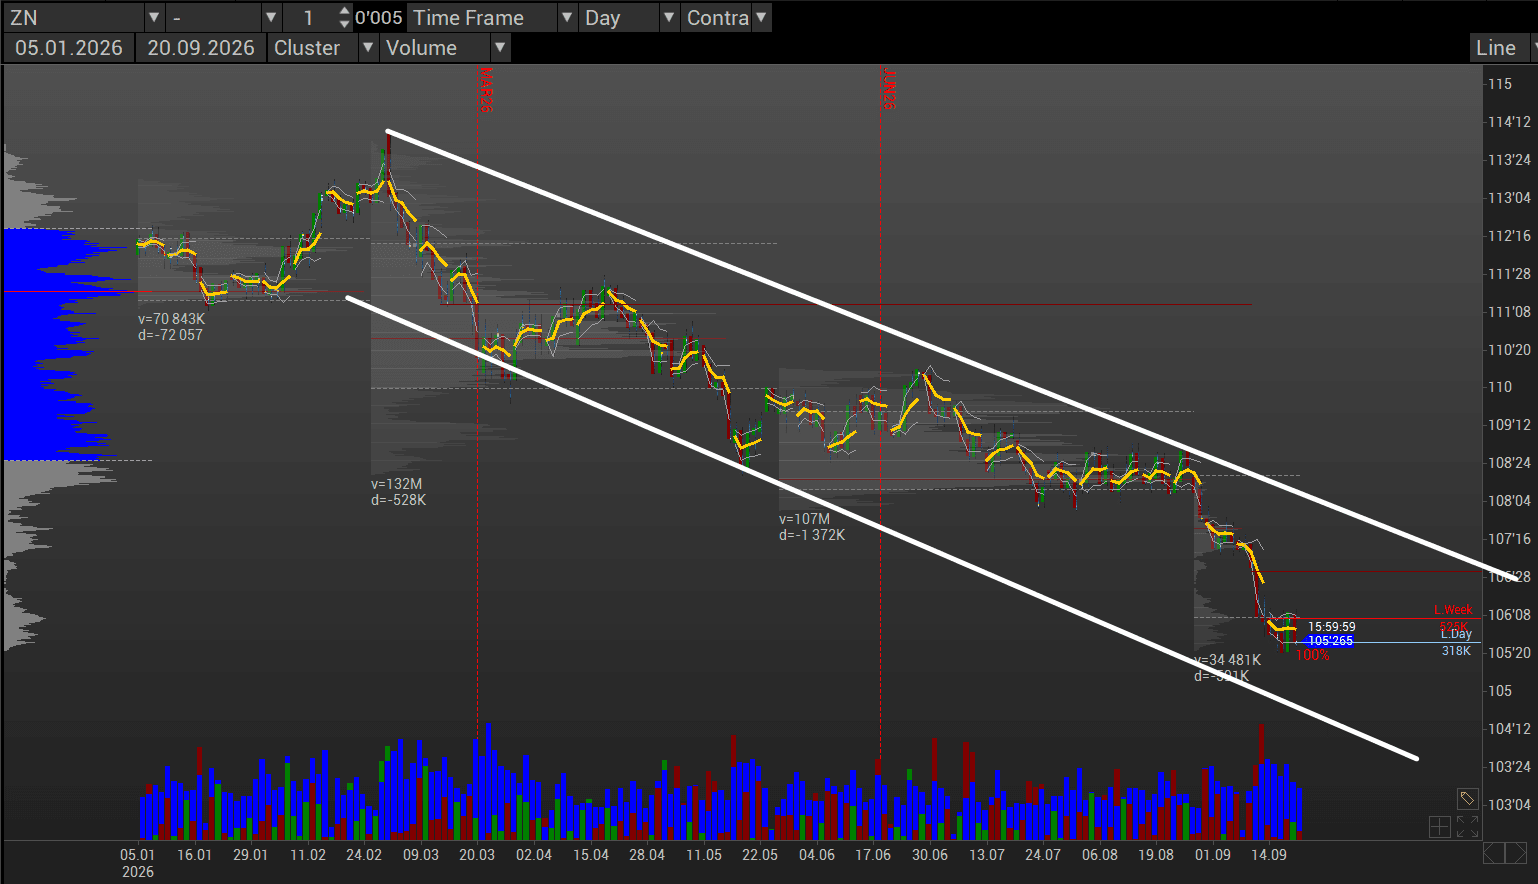
Total daily volumes have now risen to their winter levels. They were higher at the start of the Iranian campaign and lower in the summer.
Looking at the current situation in the new contract, we can see an FVG within a short impulse.
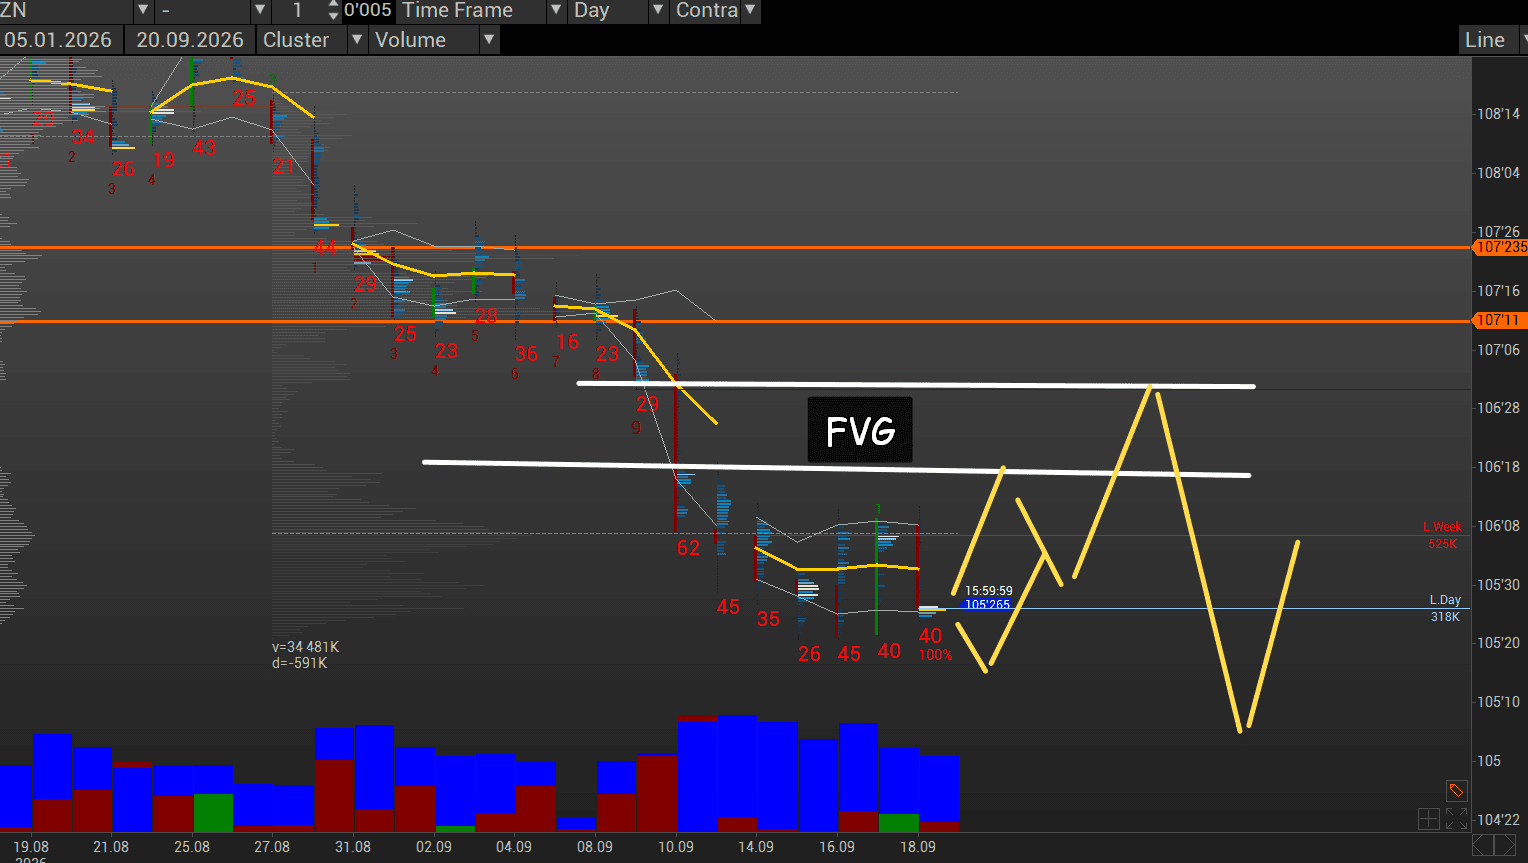
What conclusion should we draw from the volume distribution?
Market participants see no opportunity for the dynamics to change: rates will not fall. Sellers are present at the lows, and the liquidity trading model is a typical continuation of the short impulse (horizontal volume rotations).
Some participants assume that rates have reached an equilibrium level within the current timeframe. Therefore, vertical volumes have increased and the price has slowed down. There is an understanding that this is not the end, but some profit can be taken. Alternatively, liquidity can be freed up to flow into certain speculative assets that may become attractive in the near future.
Conclusion
There is no catastrophe in the US government debt market yet. Meanwhile, the Dollar Index shows that capital is not making any major moves for now, but is generally ready either to rush sharply into the dollar or to continue operating in non-dollar instruments.
So tension is steadily accumulating. The situation can be described as the calm before the storm. That is where we will stop today.