
The Dragon Pattern in Trading: How to Identify a Trend Reversal and Enter a Trade

Price charts often form characteristic combinations of movements that help traders assess the balance of power between buyers and sellers. One such formation is the Dragon pattern (Dragon Pattern). It is used to look for a potential trend reversal and enter a trade at an early stage of a new move.
The formation takes its name from its resemblance to a dragon's silhouette. It has a head, two feet, a hump, and a tail. Behind the unusual name lies a straightforward market situation: the price tests a support or resistance area several times, then attempts to break away from its previous direction of movement.
The pattern is interesting because it allows you to determine the expected entry point, the level that invalidates the trading scenario, and potential targets in advance. However, like other chart patterns, it does not guarantee a reversal. It is important to wait for confirmation before making a trading decision.
What the Dragon Pattern Shows
The Dragon is one of the reversal chart patterns in Price Action. The classic pattern forms after a price decline and signals a possible shift from a downward move to an upward one. There is also a mirrored, or inverted, version that appears after a rise and warns of a possible shift to a decline.
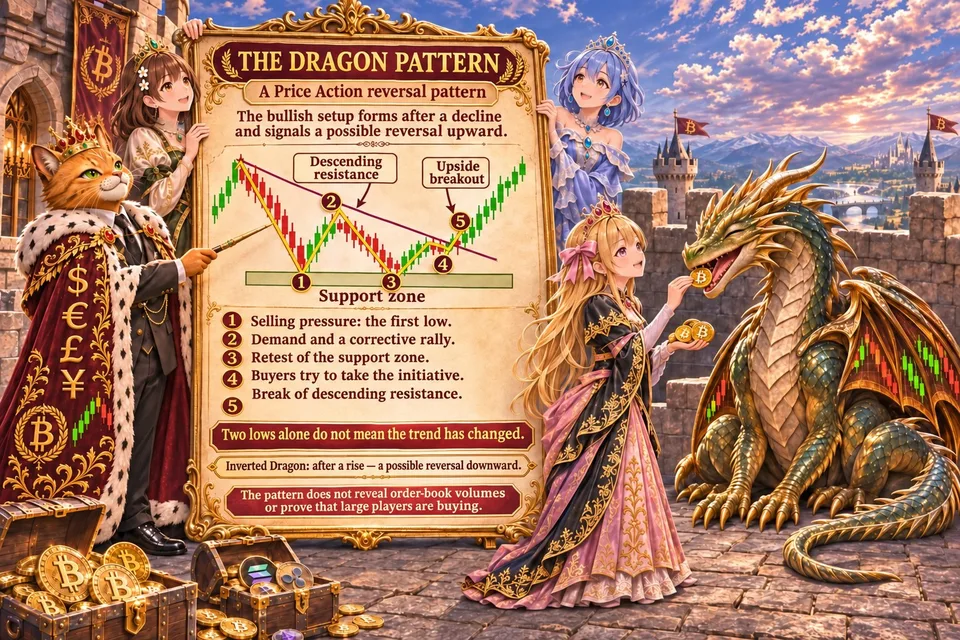
The main idea of the pattern is that the price retests an area of support or resistance.
Let us consider the bullish version.
After a decline, the price reaches a local low, from which a correction begins. Sellers then try to resume the downward move, but encounter buying demand near the previous low. As a result, a second reversal point forms.
The appearance of two lows alone does not yet mean that the trend has changed. The subsequent price movement is of key importance: the price must break above the downward resistance line drawn through the formation's characteristic local highs.
Thus, the Dragon shows several stages of a change in market conditions:
initial selling pressure and the formation of a local low;
the emergence of demand and a corrective rise;
a retest of the area of support;
weakening sellers and an attempt by buyers to take the initiative;
a break above downward resistance, confirming the likelihood of a reversal.
It is important to understand that the pattern does not show the actual order volumes and does not prove that large market participants have started buying. It only allows one to infer a change in the balance of supply and demand on the basis of price behavior.
How Often the Dragon Pattern Appears
The Dragon is not among the most common chart patterns, such as the double top, double bottom, or triangle. At the same time, individual elements of its structure regularly appear in financial markets.
The difficulty is that identifying the formation requires several conditions to be met simultaneously: a head, two legs, a hump, and a subsequent trendline breakout. If only the chart's resemblance to a dragon's silhouette is considered, the number of patterns found will be much higher, but many of them will not meet the classic rules.
There are no universal statistics on how frequently the pattern appears. Its frequency depends on the chosen instrument, timeframe, and the strictness of the recognition criteria.
On minute charts, similar combinations may appear quite often, but a significant proportion of them are simply normal market fluctuations. On hourly and daily charts, formations occur less frequently, but their structure is usually more apparent.
Beginner traders should start observing the H1 and H4 timeframes. This will help reduce the impact of short-term market noise and provide a clearer view of the overall structure of the movement.
Components of the Dragon Pattern
The classic pattern has five main elements: the head, the first leg, the hump, the second leg, and the tail.
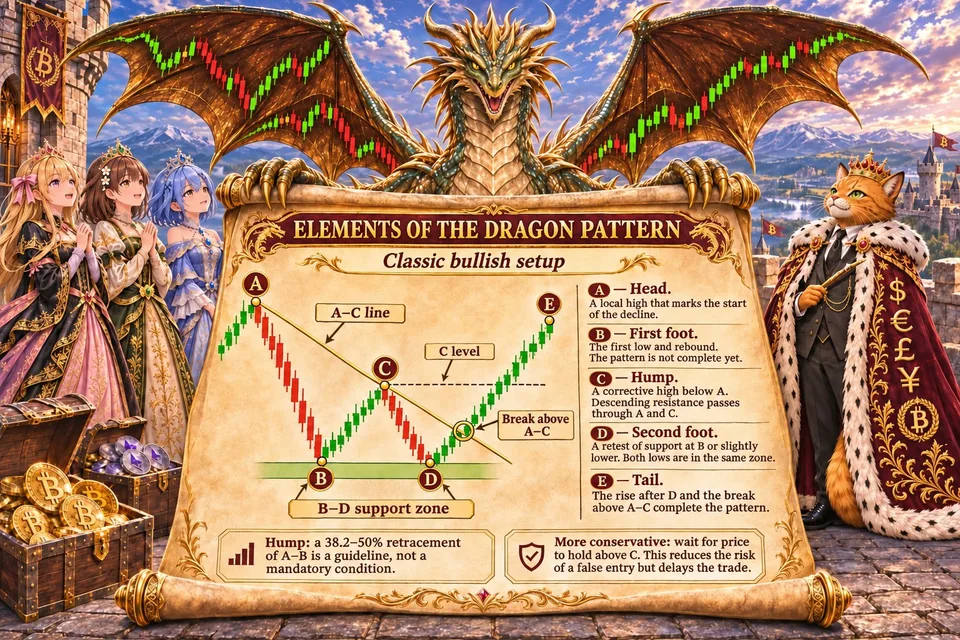
1. Dragon's head (A).
This is a local high that forms during a downward move. The main price decline begins from this point. The head serves as the starting point for drawing a descending resistance line.
2. First leg (B).
After declining, the price reaches a local low and bounces upward. The first support area forms. At this stage, it is still too early to consider the pattern complete: an ordinary corrective bounce may prove to be only a temporary pause in the downtrend.
3. Dragon's hump (C).
After the first leg, the price moves upward but cannot continue rising. A local high forms that remains below the dragon's head.
A descending trendline is drawn through the head and the hump. A breakout above this line will later become one of the main signals for opening a long position.
In some versions of the formation, the hump's position is also assessed using the levels of Fibonacci. For example, classic descriptions include a guideline of a 38.2–50% retracement relative to the move from the head to the first leg. This is a supplementary condition, not a universal requirement for all versions of the pattern.
4. Second leg (D).
After the hump forms, the price moves downward again and retests the support area. It may stop roughly at the level of the first leg or slightly below it.
The second leg is particularly significant. If sellers fail to establish a decisive continuation of the decline, this suggests that downward momentum is weakening.
The two lows do not have to lie on exactly the same horizontal line. It is more important that they belong to the same support area and that the price gap between them is not excessively large.
5. Dragon's tail (E).
After the second leg, the price reverses upward and breaks above the descending line drawn through the head and the hump.
This is the key element of the completed formation. The breakout shows that buyers have managed to overcome the previous resistance.
With a more conservative trading approach, the trader also waits for the price to hold above the hump level. This reduces the likelihood of entering on a false breakout, although it also means opening the position later.
How to Find the “Dragon” Pattern on a Chart
The search for the formation should begin after a noticeable directional move. The bullish “Dragon” is of particular interest at the end of a downtrend, when the price approaches a historical or local support area.
A step-by-step algorithm can be used to search for the pattern.
Step 1. Identify a downtrend.
The chart should show successive local highs and lows, each of which is lower than the previous one. This confirms that the market was under the control of sellers before the pattern formed.
Step 2. Find the head and the first leg.
After a local high, the price should show a sufficiently pronounced decline and then form the first low and a rebound.
Step 3. Identify the hump.
The next local high should be below the head. A descending resistance line is drawn through these two points.
Step 4. Wait for the second leg.
The price falls again toward the area of the first low. It is important to watch whether buyers respond and whether the market can stop the price from falling further.
Step 5. Wait for the tail to appear.
After the second leg, the price should reverse and break above the resistance line drawn earlier. It is advisable to wait for a candle to close above the line and, for stricter confirmation, above the hump as well.
Only after this can the formation be considered a completed bullish pattern.
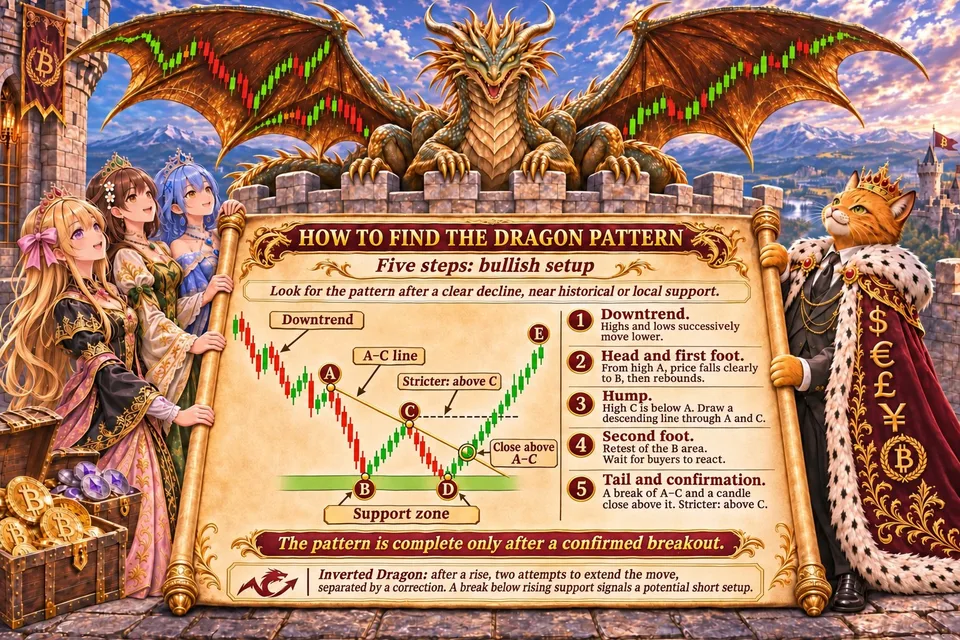
A similar sequence is used to find the inverted “Dragon,” but in a mirrored form. It forms after an upward move and involves two attempts by buyers to continue the rise, separated by a correction. A break below the ascending support line becomes a signal to look for a short position.
TradingView or Bybit are convenient for finding the Dragon pattern.
What the “Dragon” Can Be Confused With
The main difficulty in recognizing the pattern is that it resembles several classic chart formations.
Double bottom and double top.
This is the most obvious similarity. The bullish “Dragon” includes two areas of price lows, so it visually resembles a double bottom. The inverted pattern resembles a double top.
However, a double bottom is defined primarily by two lows and the resistance level between them. The “Dragon” also has a head, a hump, and a descending resistance line drawn through the corresponding extreme points.
In fact, a double bottom can be part of the “Dragon” structure, but having two lows alone does not turn it into this formation.
Inverted head and shoulders.
The patterns can also look similar, as both are used to identify a downward or upward reversal.
However, the inverted head and shoulders pattern has three lows: the left shoulder, the head, and the right shoulder. The central low is usually below the other two.
The “Dragon” has a different structure: two feet are separated by a hump, and the head serves as the starting point for drawing a sloping resistance line.
A normal correction in a downtrend.
This is one of the most dangerous mistakes. The price may form two nearby lows and an intermediate high, but then continue to fall.
If the price does not break through the descending resistance line after the second foot, the formation cannot be considered complete. Without this element, a trader risks mistaking a temporary pause in the decline for a reversal.
How reliable is the “Dragon” pattern
The reliability of the “Dragon” pattern depends less on its visual resemblance to the model than on the context in which it forms and the quality of the entry signal.
The pattern's main advantage is the ability to identify an entry point relatively close to the anticipated reversal. The second leg helps identify a level beyond which the trading scenario is no longer valid, while a breakout above the resistance line confirms a change in short-term market structure.
But there are also significant limitations.
First, a breakout above a descending line does not necessarily mean the start of a new sustained trend. The price may return below the line and continue falling.
Second, in a weak market or during sideways movement, similar formations appear regularly but do not always lead to a directional move.
Third, the outcome depends on the chosen timeframe, the instrument's volatility, liquidity, and trading costs. On lower timeframes, false breakouts and random fluctuations are especially noticeable.
Additional conditions can help improve signal quality:
the pattern forming near a significant support area;
increasing volume as the price moves away from the second leg and breaks through resistance;
a candle closing above the trendline and the hump level;
confirmation of the reversal on a higher timeframe;
an additional signal from the RSI or MACD indicators.
However, none of these conditions guarantees a profitable trade.
Claims of a fixed probability of the “Dragon” pattern playing out should be treated with caution. The potential reward-to-risk ratio of 4:1 mentioned in descriptions of the pattern does not mean that four trades out of five will be profitable. It is simply a possible ratio of the distance to the target to the distance to the stop-loss. Actual effectiveness can only be assessed after testing specific rules on historical data, accounting for commissions and slippage.
Should a Beginner Trader Use the “Dragon” Pattern
The “Dragon” pattern can serve as an additional tool for finding reversal trades. Its main advantage is the combination of a retest of a price area and a subsequent trendline breakout. This makes it possible to assess when the previous direction of movement begins to lose strength.
However, the pattern requires careful identification. Not every chart with two lows should be considered a complete “Dragon,” nor should a trendline breakout be treated as unconditional confirmation of a reversal.
Beginner traders are better off using a conservative entry after a candle closes beyond the resistance line, setting a stop-loss beyond the extreme of the second leg in advance, and calculating position size based on the acceptable risk.
Before using the pattern on a live account, it is useful to collect statistics from at least several dozen historical examples for the chosen instrument and timeframe. This will help you understand how often the formation actually leads to a reversal, where false signals occur, and which conditions improve entry quality.
Like other technical analysis patterns, the “Dragon” is best used not as a standalone trading system, but in combination with analysis of support and resistance levels, volumes, and the overall market structure.
Trading the “Dragon”
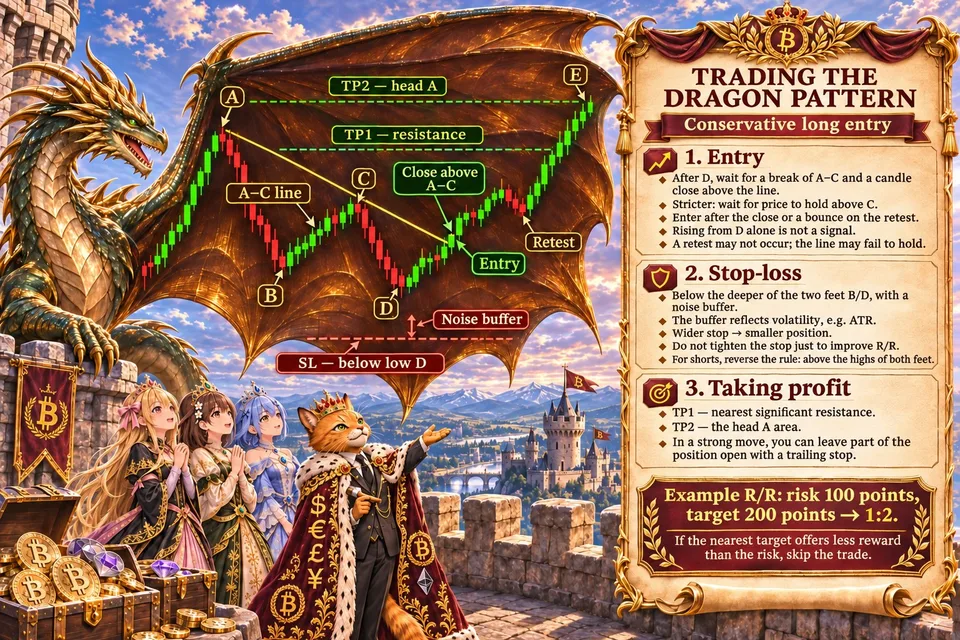
How to Enter a Trade Using the Dragon Pattern
For beginner traders, a conservative entry is considered the most suitable approach—after a confirmed breakout above the resistance line.
Let's look at opening a long position.
1. Wait for a breakout.
After the second leg forms, the price should break above the descending line connecting the dragon's head and hump. You should not enter a trade just because the price has started rising from the second low.
2. Get confirmation.
Wait for a candle to close above the resistance line. A stricter approach is to wait for the price to hold above the hump. This provides additional confirmation that buyers have overcome both the sloping resistance and the most recent local high.
3. Choose an entry point.
You can open a position after the breakout candle closes. Alternatively, wait for the price to return to the breached line and enter a trade after a confirmed upward bounce.
The second approach can provide a better price, but a retest does not always occur. In addition, the breached level may fail to hold as support.
For a beginner, it is better to avoid trying to predict a reversal in advance and wait for confirmation.
Where to place the stop-loss
When trading the “Dragon” pattern, the stop-loss is placed beyond the formation’s lowest point.
For a long position, the protective order is placed slightly below the lowest point of the two legs. If the second leg is lower than the first, its low should be used as the reference.
A small additional buffer is needed to prevent ordinary market noise from closing the position prematurely. Its size can be determined based on the instrument’s current volatility, for example using ATR.
It is not recommended to place the stop directly at the low: this makes the position vulnerable to brief breaches of the level.
For the inverted “Dragon”, used when opening a short position, the rule is mirrored: the stop-loss is placed slightly above the highest point of the two legs.
It is also important to consider the distance from the entry point to the stop. If it is too large, the position size must be reduced. The stop should not be moved artificially closer to the entry point solely to increase the potential profit-to-loss ratio.
Where to Take Profit
The “Dragon” pattern allows you to identify several reference points for taking profit in advance.
The nearest significant resistance in the price's path can be considered the first target. The next reference point may be the dragon's head area — the local high from which the initial decline began.
During a strong move, the price may break through this level as well. In that case, the trader can leave part of the position open, using a trailing stop or subsequent resistance levels.
To evaluate a trade, it is useful to calculate the ratio of potential profit to possible loss in advance. For example, with a risk of 100 points and a target of 200 points, the ratio is 1:2. If the nearest resistance is too close and the potential profit is smaller than the possible loss, it is more reasonable to skip the trade.