
Price Action: Support / Resistance Levels

In Forex trading, support / resistance levels are of very great importance. You should pay attention to them regardless of which strategy you trade with, whether it is Price Action or any other trading system. Levels will help improve your trading many times over. In this lesson we will talk about what support/resistance levels are, how to draw them, which levels are worth paying attention to and, most importantly, how to use them in our own trading on the Forex currency market.
What is a level?

A level is a place where a trend breaks or where there is "consolidation." At it, a certain struggle takes place between sellers and buyers, the outcome of which determines whether the price will continue its initial movement or reverse and go in the other direction. Any previous peak or trough is called a support/resistance level. Let us look at this visually on a theoretical price chart.
Let us imagine that we now have a chart with an uptrend.
Let us mark the levels on this chart.
I highlighted them with red lines:
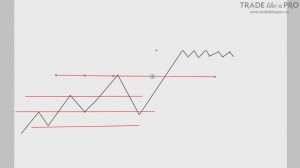
Also, at the end of our chart you can notice that the price is at one level and is constantly running into something. This is called consolidation.
It can also be considered a level, so let us also mark it with a red line:
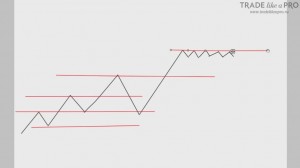
Thus, we found all the levels on the chart.
Right away I want to say that a level is not a straight line that matches point for point with some price on the chart, but a zone that includes some space around it:
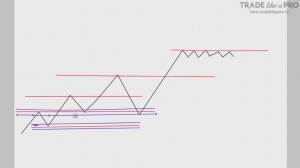
On this chart, you could immediately see that some local highs and lows lie on one straight line. But there is also one that lies slightly below the others. This is normal, because it is still within the zone of our marked level.
So, a level is a point of possible price reversal or, in other words, a place of increased trader activity. You probably have a question: "Why does this place attract traders so much?" Such a market reaction is caused by a cluster of limit orders from sellers and buyers. Why do they place their limit orders? The answer is very simple. All because it is obvious to them where to place a stop-loss. This is a feature of human perception, because not only robots trade on the market, but people as well.
And besides, I note that robots are programmed by people who realize that people trade on the market. They understand that instead of entering in unclear space where it is not clear how to place a stop-loss, the human brain will look for something to latch onto. It tends to enter the market at such breaks.
A level is a cluster of limit orders from sellers or buyers. Since high trader activity is observed at levels, levels are a possible place for a price reversal or an increase in its activity.
How can we find levels and draw them on the chart?

Before we start marking levels on the chart, first of all we should pay attention to the extremes, that is, the extreme points: the highs and lows of the chart.
As a rule, levels are usually marked on the chart with the red line that is in the toolbar of MetaTrader 4:
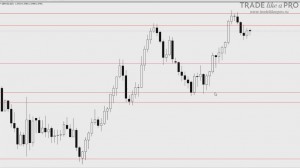
We draw levels through the extreme points of the candles, while trying to draw them through the zone of maximum bar density.What does this mean? For example, on the chart we have an extreme point.
It stands out by its tail:
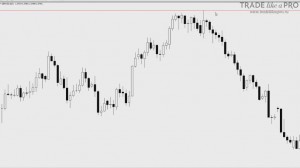
It would seem that the level should be built along its tail, but if you look at the chart carefully, you can see that the price bounced several times from an obstacle that did not let it go higher. For this reason, we need to shift the level a little below the tail:
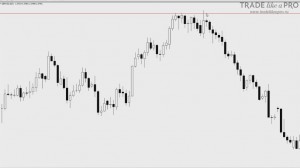
On the one hand, it is the closest to the highest point, but at the same time it passes through the areas with the maximum density of candles. This gives a more optimal picture.
And I remind you once again that a level is not a line, but a zone. We look at the line, but remember that in reality it can have approximately this area of influence on the chart:
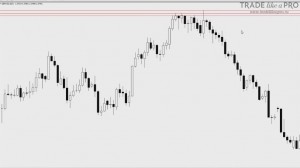
Note that the price does not have to reach our line point for point. It can reverse and move in the opposite direction without reaching the level we built. Therefore, imagine a certain zone and work inside it.
How to find levels if you are a beginner?

Beginners often find it difficult to see peaks and troughs on the chart. That is because they do not have enough experience. In this case, switching the chart to line mode can help you.
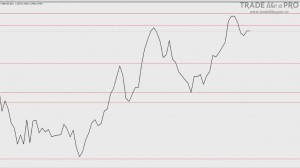
At first, it will be better to use exactly that.
Later on, you will be able to do this on a regular chart with candles or bars. I will say right away that it is very important to learn to work with a regular chart, because it shows the extreme price points, the candle tails and shadows, and levels built without them will be, to put it mildly, inaccurate.
The ZigZag indicator may also be useful to you for practicing level building:
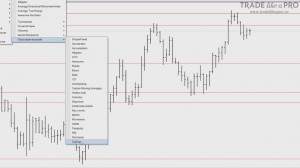
It will help you mark levels on the chart:
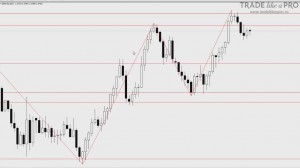
But I recommend that you do not use indicators and instead find levels manually.
How to choose significant levels?

After all the peaks and troughs have been marked on the chart, it may seem that there are too many levels on the chart.
And if you scroll the chart back and mark all the levels there, in the end you will get a chart covered with horizontal lines. And nothing except levels will remain on it. So what should you do and how should you deal with it? First of all, you must understand that not all levels deserve your attention. First of all, do not look too far away. There is no need to scroll the chart back several years.
You must understand that traders look at the current screen. In other words, you need to look at what fits on the monitor, and that is about 200 candles. Therefore, the distance we need to pay attention to when finding levels on the chart is about 200 points, or one screen. If there was a strong minimum or maximum not far from the screen boundaries, it should be taken into account when placing levels.
As an example, it is worth noting the extreme value of the franc:
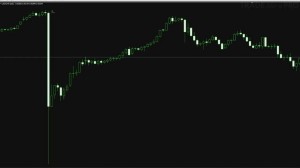
Because such extremes stand out strongly on the chart, traders will remember them for quite a long time, so they should not be forgotten.
Try to mark clear levels that are visible to the naked eye. The greatest number of traders pay attention to them. If we go a little deeper into the technical details, then first we mark the extremes, they are the most important when price reverses. Next we mark the levels formed by long tails, which are nothing more than stop-loss collection. The price made a move, enriching the market makers. Traders remember these levels and use them in trading in the future.
In addition, it is necessary to mark the levels from which an impulsive move occurred with a breakout of local lows and highs. And, of course, we mark levels where there was strong prolonged consolidation, when price was not allowed to go up or down.
Now that I have given you information about which levels are worth paying attention to, let us edit them in our example.
This is what our chart looked like with the levels previously marked on it:
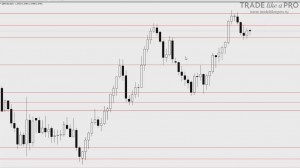
Let us start editing from the bottom, from left to right. The lowest level was an extreme. After it, a price move occurred that broke the local highs, that is, it gave us a new high point.
From this we conclude that we keep this level.
The next level gave us roughly the same information as the previous one, but there was consolidation here. Price was not allowed to go lower for a long time. There is a certain strength present at it. Some large positions are bought from it.
Therefore, we also keep it:
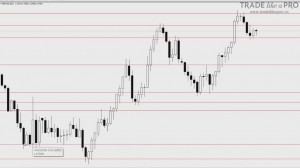
There is consolidation at it and price is not allowed to go below a certain level.
We marked the next level based on the long tail of the candle. But it did not produce a good downward move, so we remove this level:
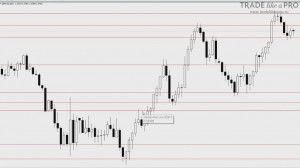
There was no move here that would have given us new local lows. If price had gone down from this pin bar, then the level would have had a reason to exist. But since there was no move, there was no result.
The next level should be set carefully so that it passes through the local low and at the same time captures the candles behind it. This level gave us a new high point, so we keep it.
Next we drew the level because price touched it three times and subsequently gave a new high:
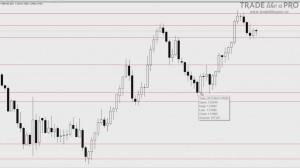
This means that we keep it.
For the next level it may seem that price takes it into account. But there were no new local lows or highs compared with the previous one, so we delete it:
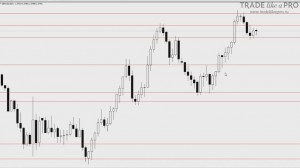
It is very easy to notice on the chart. It stands out, which means we will keep the level drawn through it. It will attract traders and may possibly bring us benefit. And the last level is at the very top. At the moment it is drawn by the extreme. Therefore, it remains on the chart. This is how we edited our chart and cleared it of unnecessary levels.
In this article, we are considering support and resistance levels. I usually call them simply levels. But if we distinguish these concepts, it turns out that support levels are the levels that prevent price from going lower. And resistance levels are the levels above that prevent price from going higher.
Our last drawn level will for some time be resistance for price. It will resist its further upward movement.
Role Reversal of Support and Resistance
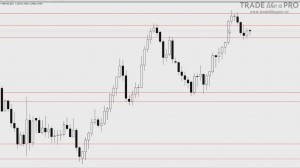
And as you may have already guessed, support can become resistance after the level has been broken downward.
For example, this level acted as support for a long time. After it was broken, it became resistance for some time:
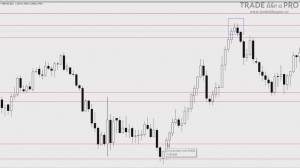
When the price broke it upward, it became a support level again. Remember: if the price is above the level, then it is support, and if the opposite is true, then it is resistance. Levels changing roles on the chart is a normal occurrence.
How to tell that a level has been broken?

Sometimes a zigzag price movement occurs on the chart. Because of this, it can be confusing which level relates to what. The price moves in a zigzag and breaks through it back and forth.
Therefore, there is a very simple criterion for levels. To understand that a level has been broken, you need to look at two candle closing prices at the level. If the level was broken the first time, and then it was broken again, this means that the level has been broken. There is nothing complicated about this, the main thing is to watch the chart carefully.
How to use levels in Forex trading?

To begin with, it is worth remembering that levels are a point of support. If you get a buy signal somewhere, and you see that the price is at a level, this means that the signal has a point of support. It can be taken with a greater degree of confidence.
For example, at this point in the middle of the chart we got a buy signal:
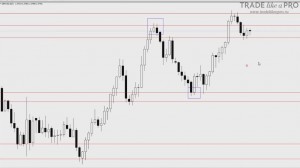
It has no point of support, so it is less significant than the next signal at the support level in the blue rectangle.
In addition, levels are used to determine stop-losses and profit-taking targets. As for targets, I think everything will already be clear to you. The nearest level acts as the target.
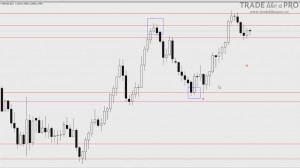
Stop-losses are placed slightly below the level if it acted as a point of support. Let us imagine that we entered the market somewhere in the area marked by the blue rectangle:
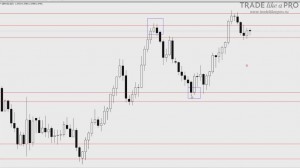
We would place the stop-loss slightly below the level, giving the price some freedom:
This is all determined by eye. There are no clear criteria for this.
On which timeframes should support / resistance levels be built?

On different timeframes, levels have different significance.
A support and resistance level on daily charts is much more significant than on hourly ones. Therefore, if you trade intraday, I advise determining levels on daily charts or on H4. And you can trade on the timeframe you are used to.
Conclusion

Try not to invent extra levels just to justify your entry into the market. If levels are located close to each other, then focus on the nearest one. Remember that they are processed from right to left. Also, do not forget that a bounce from a level is more likely than its breakout.
If you trade levels, and do not only use them as reference points for stop-losses and targets, then you can use: a breakout, a bounce, and a false breakout of the level. But we have separate video lessons about this.
Levels in trading will definitely be useful when working with any strategy. Therefore, before entering the market, do not be lazy and mark them on the chart. They will show you where it is better to enter the market, and will help you place a stop-loss.
Sincerely, Pavel Vlasov TradeLikeaPro.ru
