
Fibonacci Levels
 Hello, dear blog readers! When I was just starting to learn how to trade Forex, Fibonacci levels were associated in my mind with something complex and incomprehensible that the "smart guys" use in trading, but that I certainly would not understand :) . Moreover, the greatest difficulty for me was precisely the process of plotting the Fibonacci grid on the chart, for some reason I did not find any sensible instructions anywhere at that time. In the video below, I tried to make exactly the kind of guide to using Fibonacci levels that would have been useful to me myself at the initial stages.
From this video you will learn what Fibonacci retracement (recovery) and extension levels are, how to use them in Forex trading, determine targets and market entry points, and, of course, how to plot them directly on the chart. Much has been written about the history of the golden ratio, Leonardo Fibonacci's invention of his famous sequence, and its reflection in the world around us, there are plenty of materials on the Internet. Therefore, I did not focus attention on this aspect.
What are Fibonacci levels?

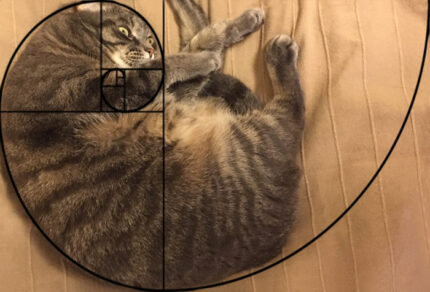
In the 13th century, Leonardo Fibonacci presented to the world a sequence of numbers where each following number is the sum of the previous two. At the same time, the ratio of any number in the sequence to the previous one is approximately 1.618. This sequence is based on the Golden Ratio, which is represented in nature. For example, the human body in many ways is a model of the Golden Ratio. A snail shell, plants, and even the unreachable galaxies that are visible from space.
We will not focus now on the Golden Ratio and the Fibonacci sequence in nature and around us. You can read about that in various books or on the internet if you are interested. We will find out how these numbers can help in Forex trading. First of all, we will talk about internal Fibonacci retracement levels.
How to plot Fibonacci levels on a chart

What are they needed for in Forex? Let us imagine that we have some kind of trend.
We need to determine when it is best to enter this trend. Fibonacci retracement levels give us the opportunity to identify potential levels where the correction of our upward trend will change back into an upward trend. Then we will be able to buy in and make a profit.
Suppose that an upward movement has begun:
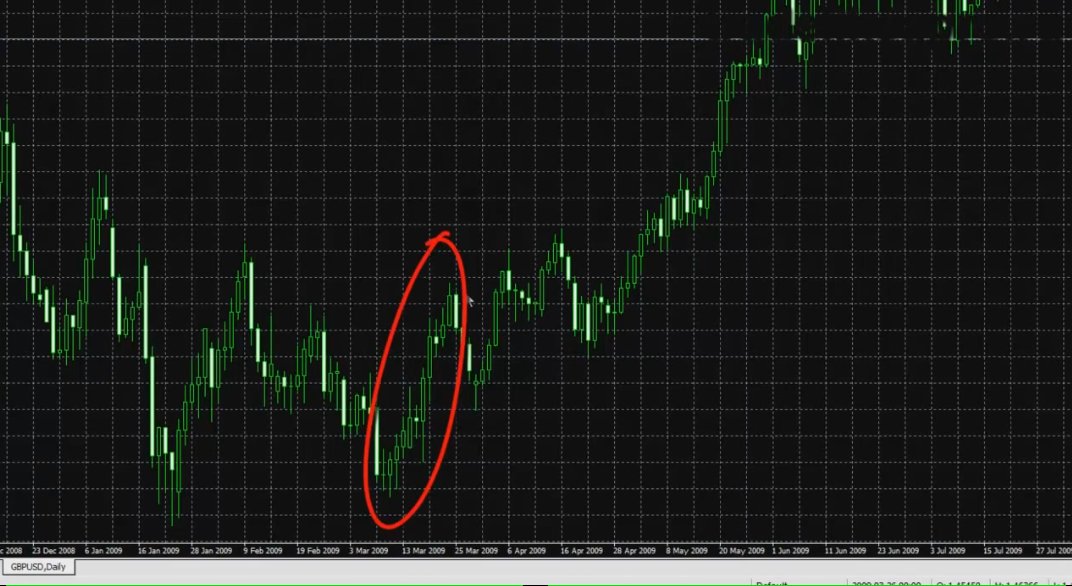 We decided that a bullish trend is about to begin and now we need to decide where to enter the market.
We need to determine in advance where the correction will end.
To do this, we will use the tool that in Metatrader 4 is called Fibonacci lines.
By default, it is located on the toolbar:
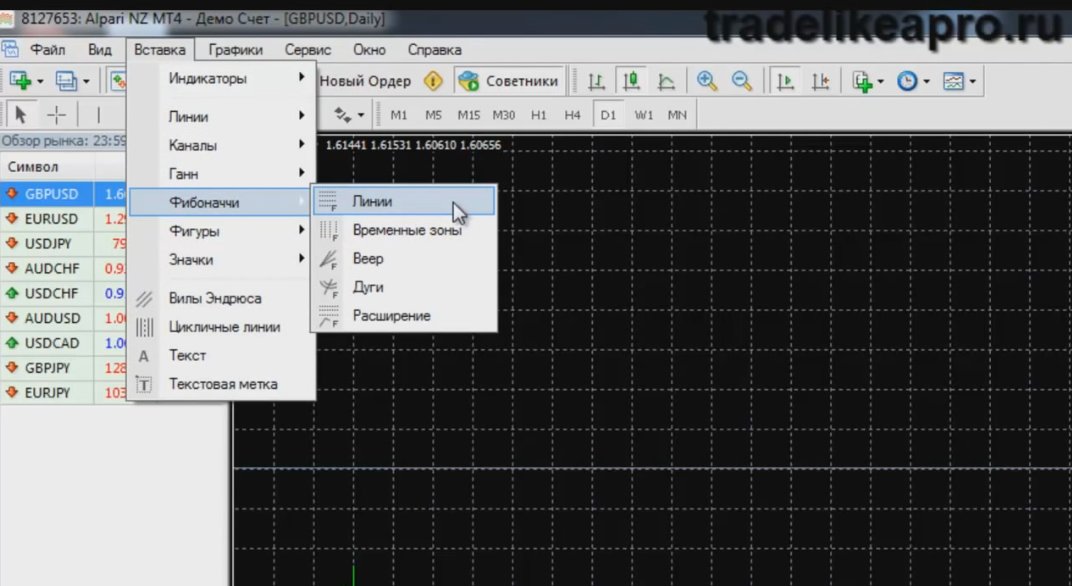
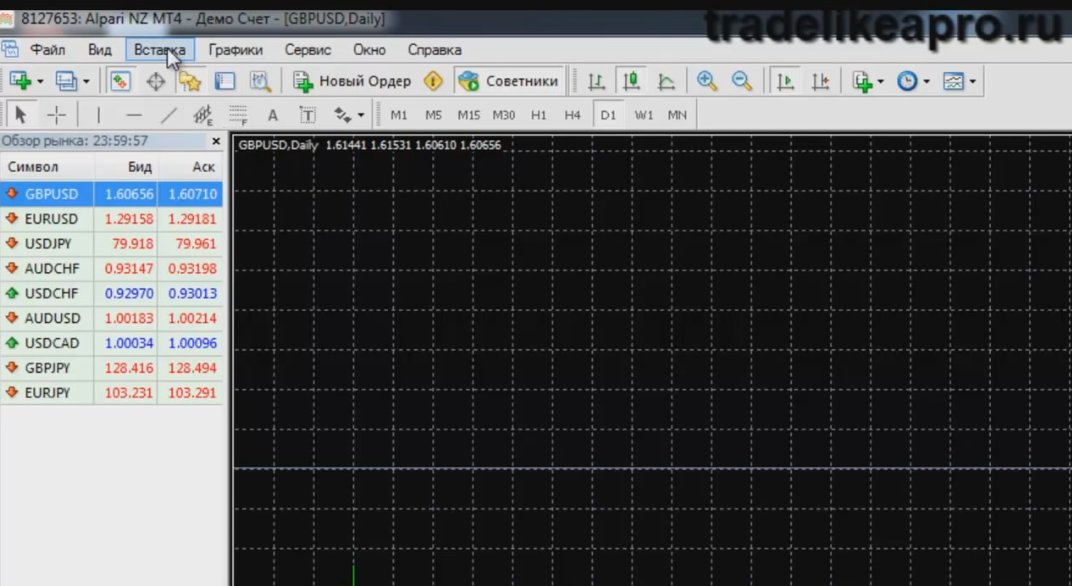 It can also be found in the menu "Insert - Fibonacci - Lines":
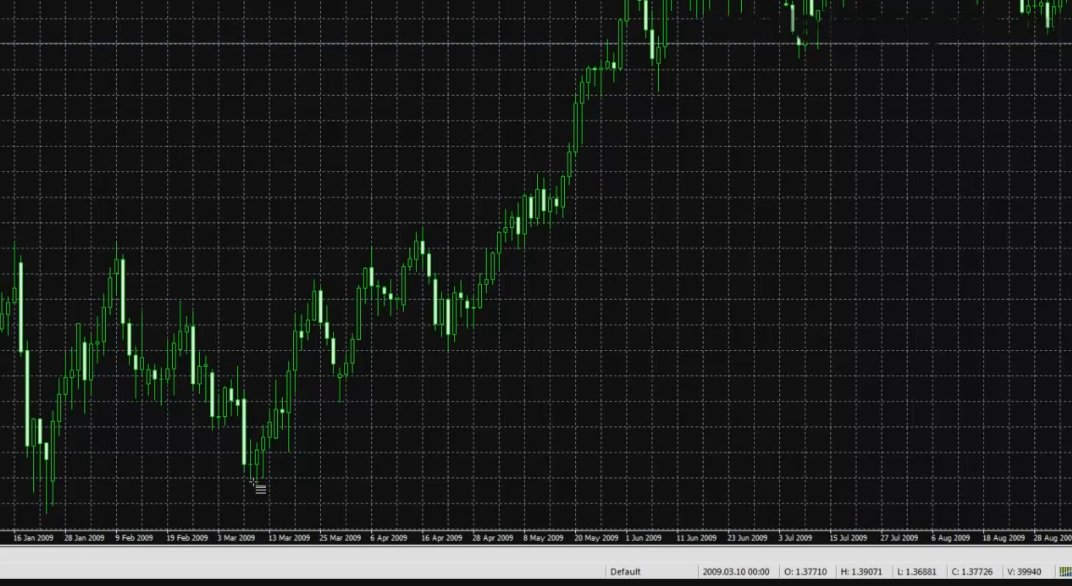
 For an upward trend, we need to mark the lowest point where the trend began:
 And without releasing the mouse button, draw the grid to the point where, in our opinion, the correction began:
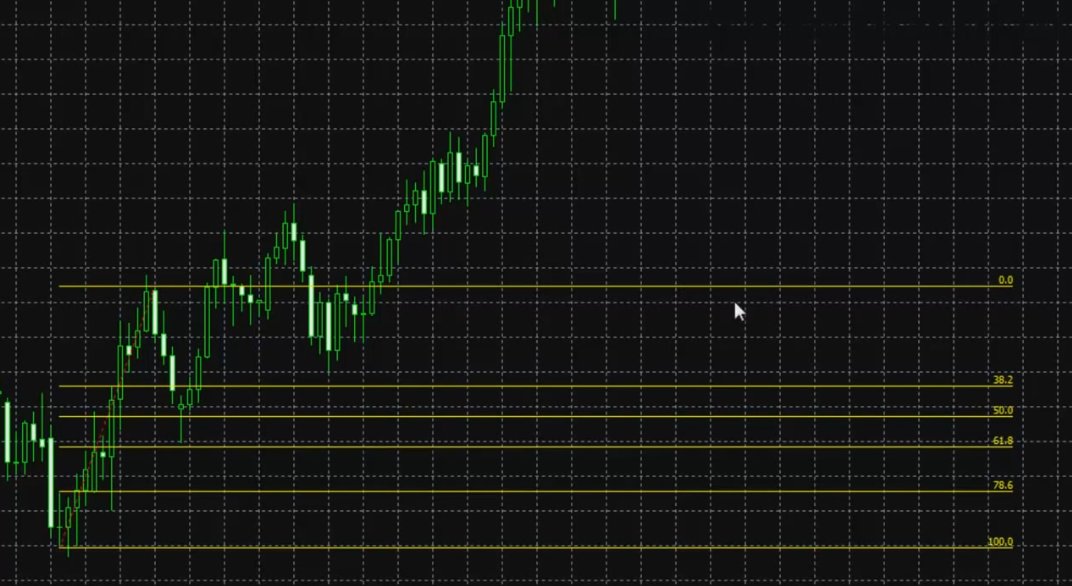 We get the levels 38.2, 50, 61.80 and 78.6. The values are percentages. If we take the entire segment that we used to plot the grid, that will be 100%. Put simply, the 38.2 level is 38.2% of the entire length of the segment.
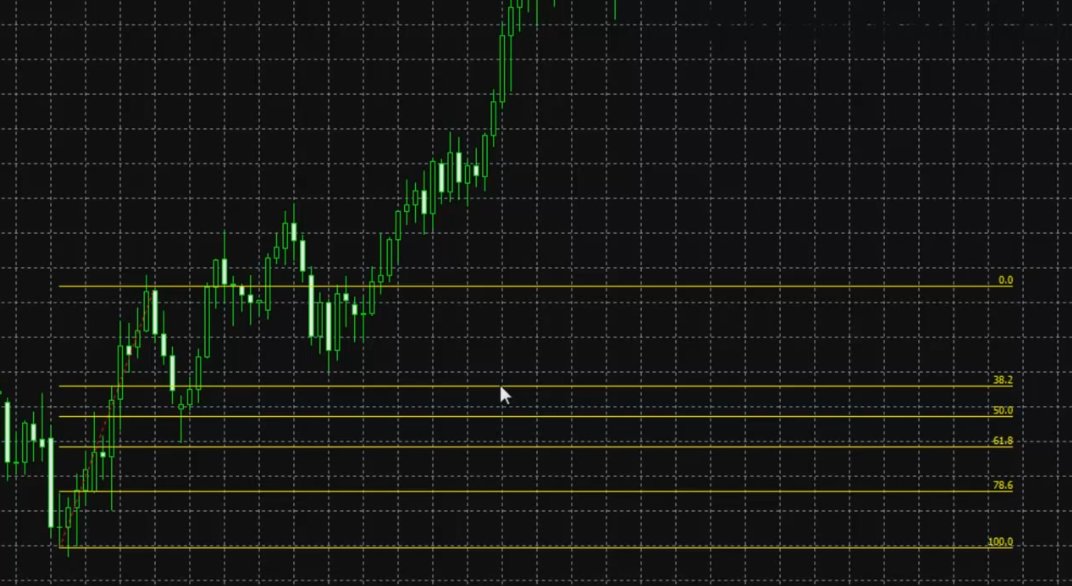 By default, Fibonacci retracement levels will look like this:
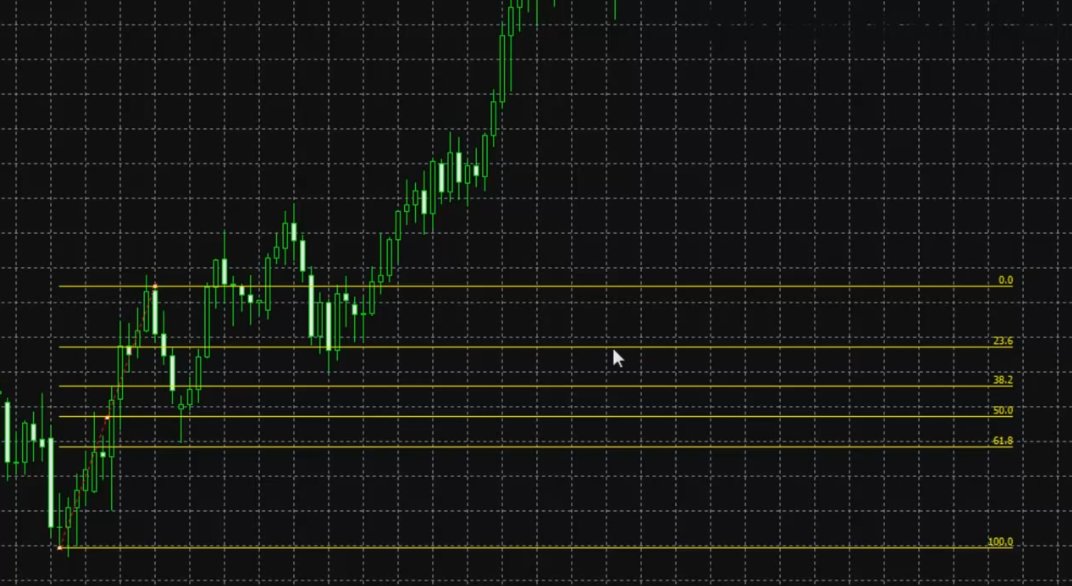 We get the 23.6 level added, which I consider extremely insignificant and do not advise using in trading at all. The 78.6 level is also absent because it is not part of the Fibonacci sequence, but it is the square root of 0.618, which is closely connected with this sequence. Very often reversals and bounces occur at this level, and therefore it should be taken into account.
How to set up the Fibonacci levels grid?

To do this, you need to click the dashed red line that marks the segment twice with the left mouse button. Then points will appear on the dashed line:
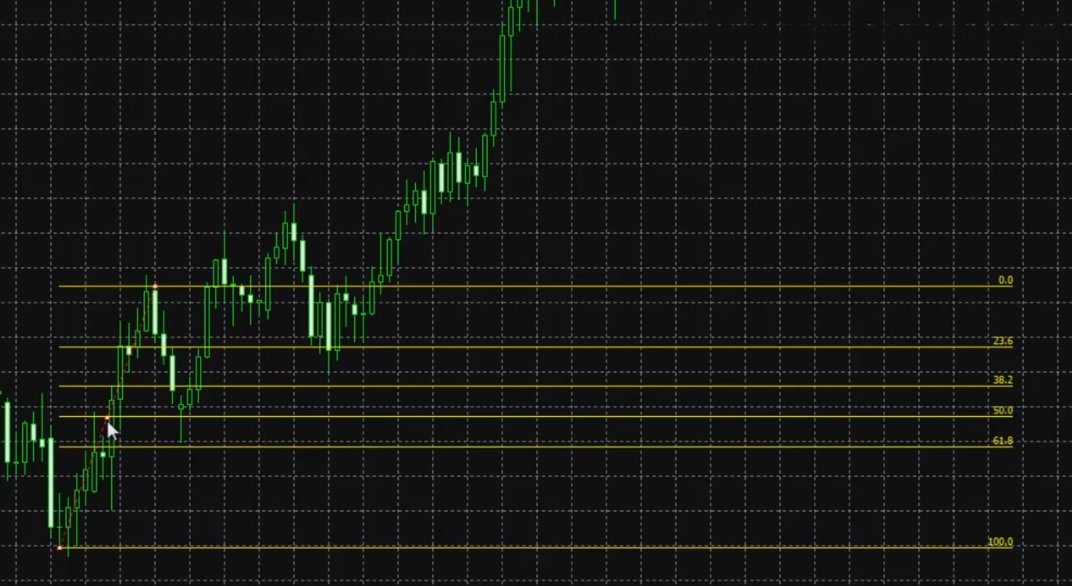 Now it can be dragged if you plotted it incorrectly the first time:
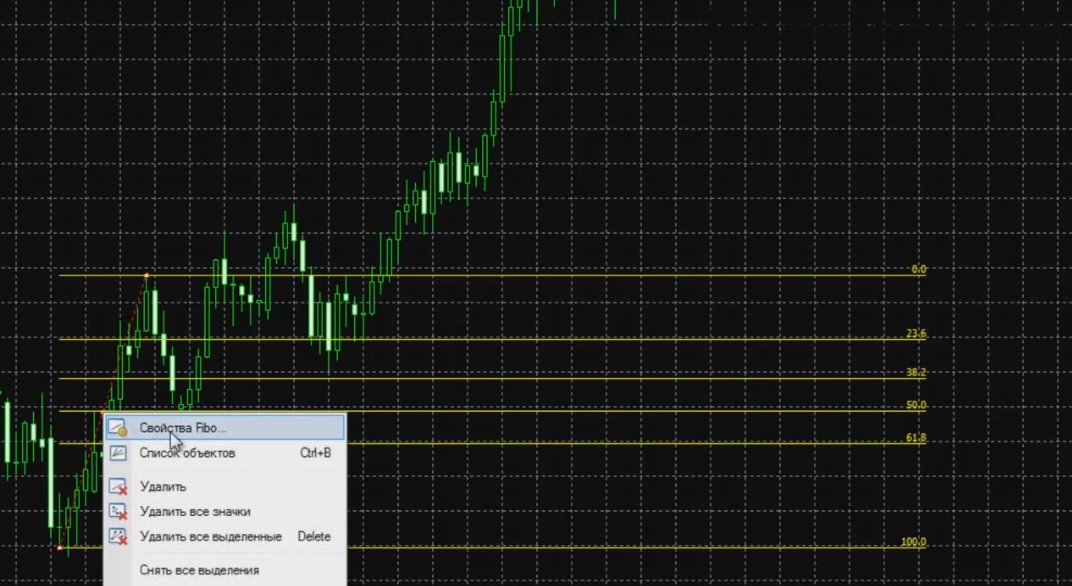
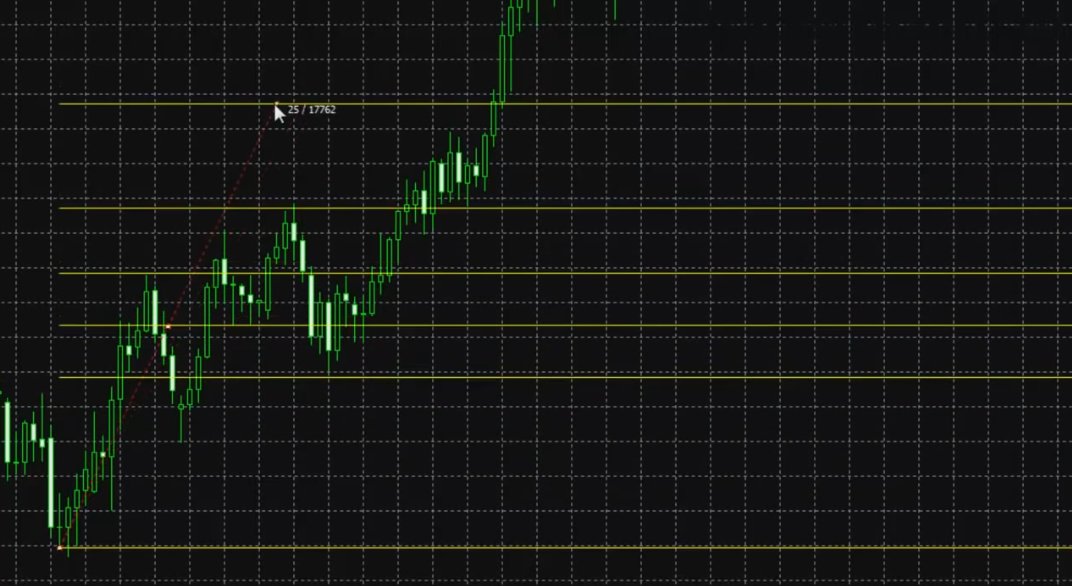 In addition, we can open the settings menu by right-clicking on the point and choosing "Fibo Properties...":
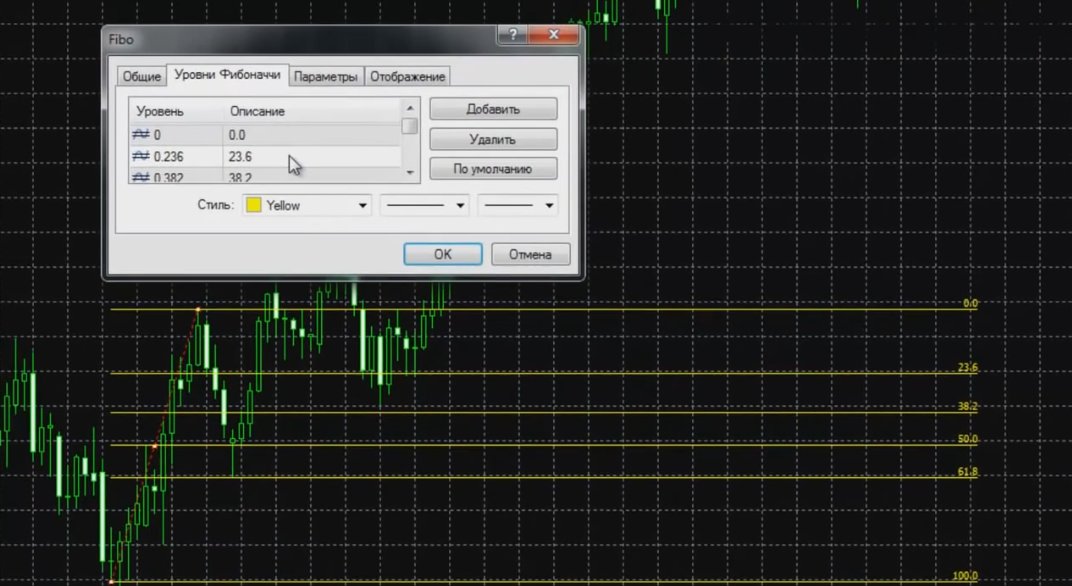 A settings panel appears:
 Here you can change the display color of the levels, delete one of the levels, or add one.
We find the level 23.6 that we do not need and delete it. Now this level will be gone and it will not interfere with us.
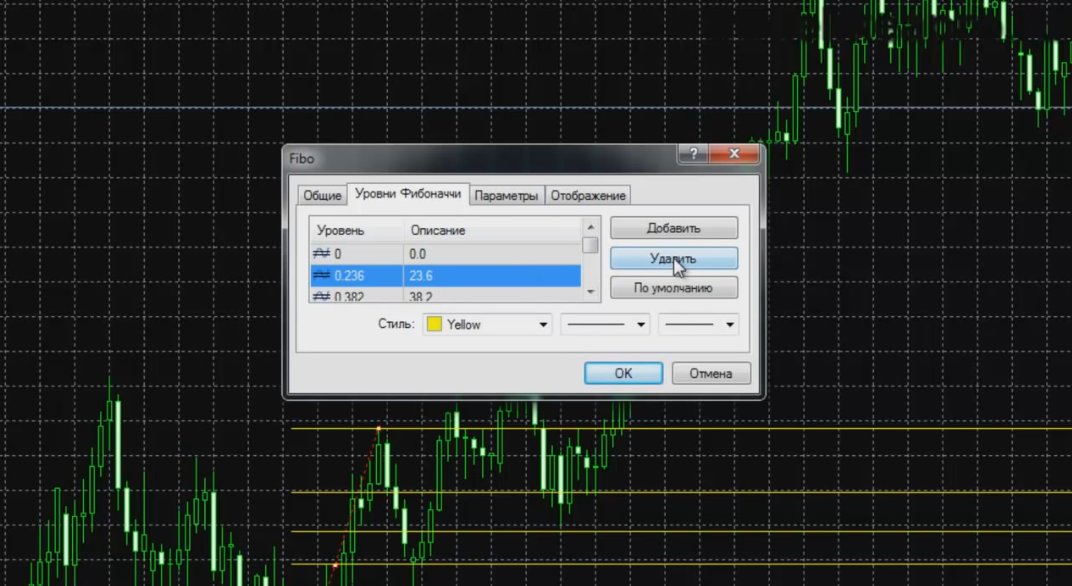 Now let us add the 78.6% level. To do this, click the add button:
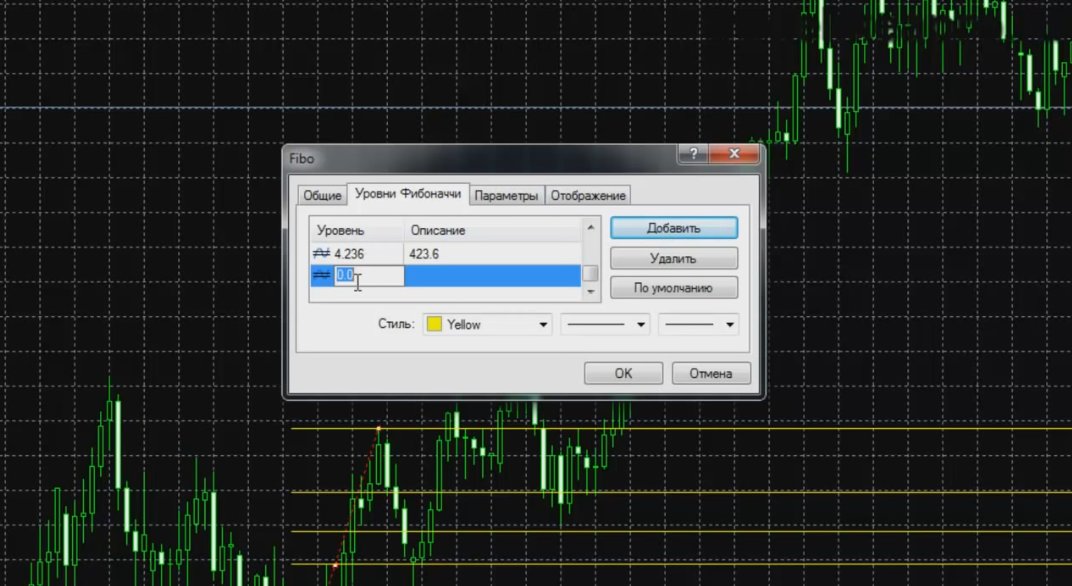 In the Level field write 0.786, and in the Description field 78.6:
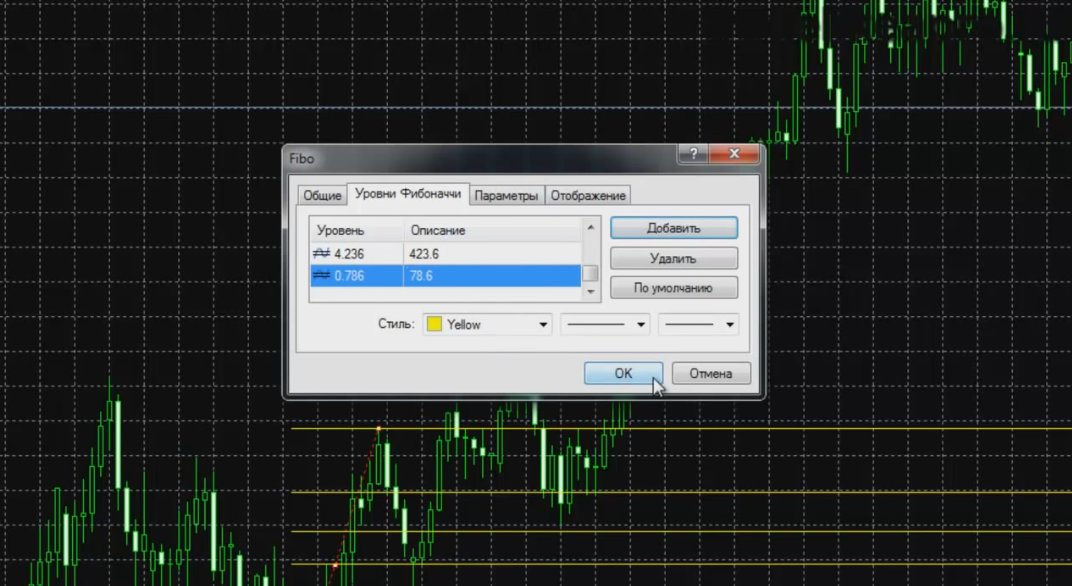 Click OK and we can observe that the 23.6 level disappeared and the 78.6 level appeared:
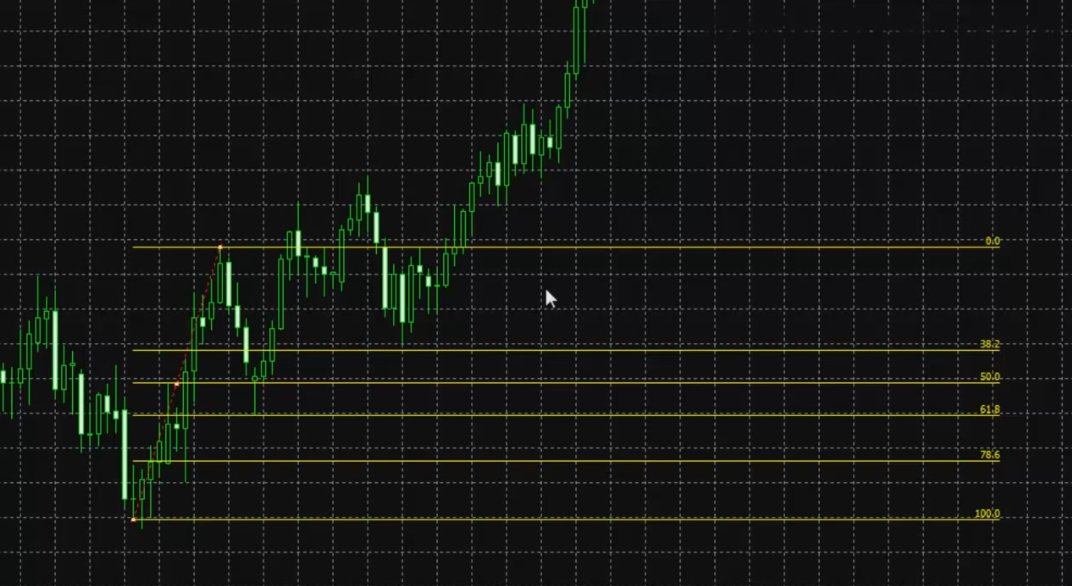 You can add your own levels that you consider necessary. This will let you customize the grid completely for yourself.
Practical Use of Fibo

So why do we need it? We observe that the levels on the Fibonacci line are levels of a potential correction and return to the trend.
We had the correction end at the 50% level:
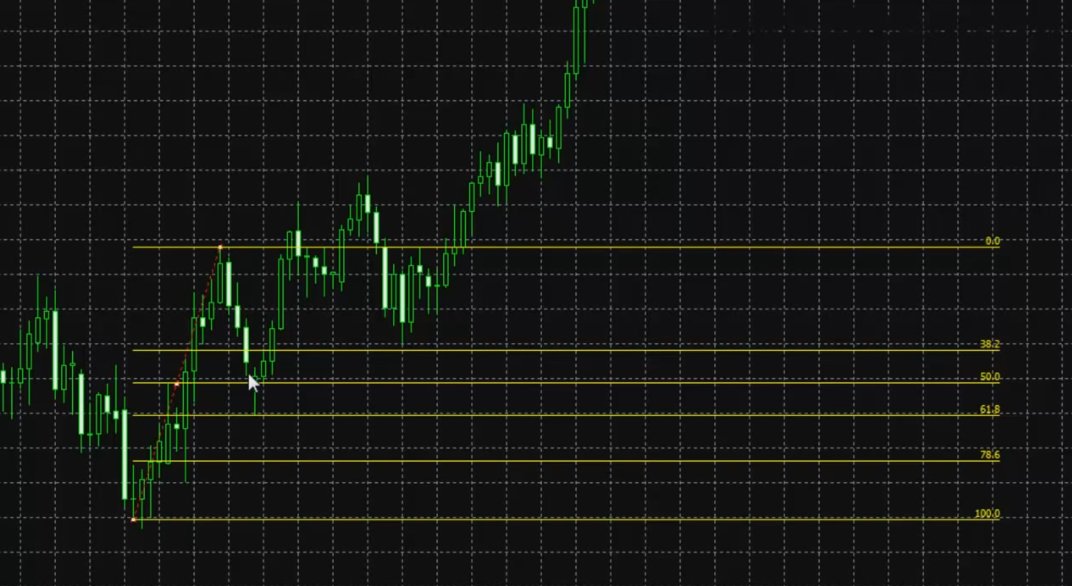 I think everyone understands that this candle with a very large tail was only a deceptive move and acted as a "spring":
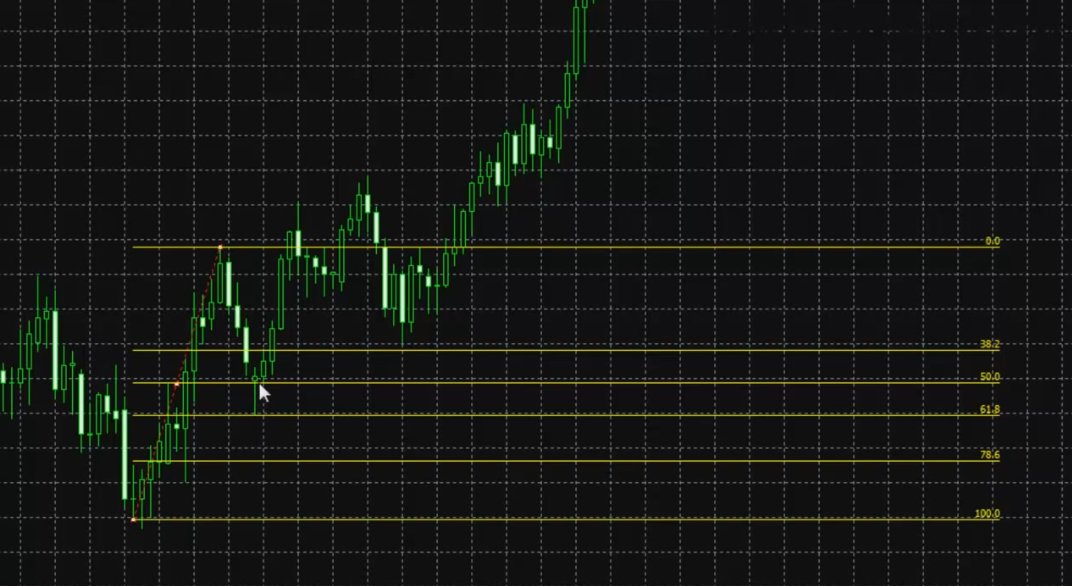 But even if we consider its tail, it falls at the 61.8% level of our existing segment. We can consider the 38.2, 50, 61.8 and 78.6 levels for a potential market entry. By themselves they do not carry any super-strong power, and by simply opening buy orders when the price reached 38.2% or 50%, you will not achieve profitability in trading.
These levels should be used only in combination with other elements of technical analysis. Suppose that you trade graphic patterns, then the formed pin bar pattern can be considered as an entry point, since it rests on the 61.8 level. Thus the graphic pattern gets a point of support, and we can open a buy trade, having a basis in the form of a graphic pattern and a Fibonacci level.
And simply because the price has reached a Fibo level, it is not worth opening a trade.
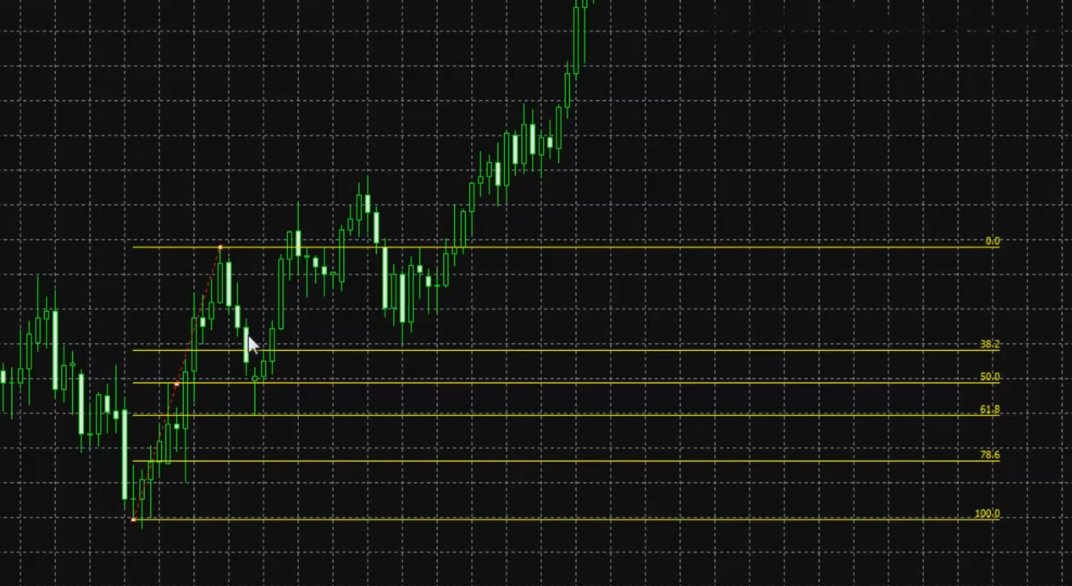 Let us imagine that we entered a trade, earned something, and the price moved higher, reaching a new maximum. What do we do next?
We simply drag the grid higher to the new maximum:
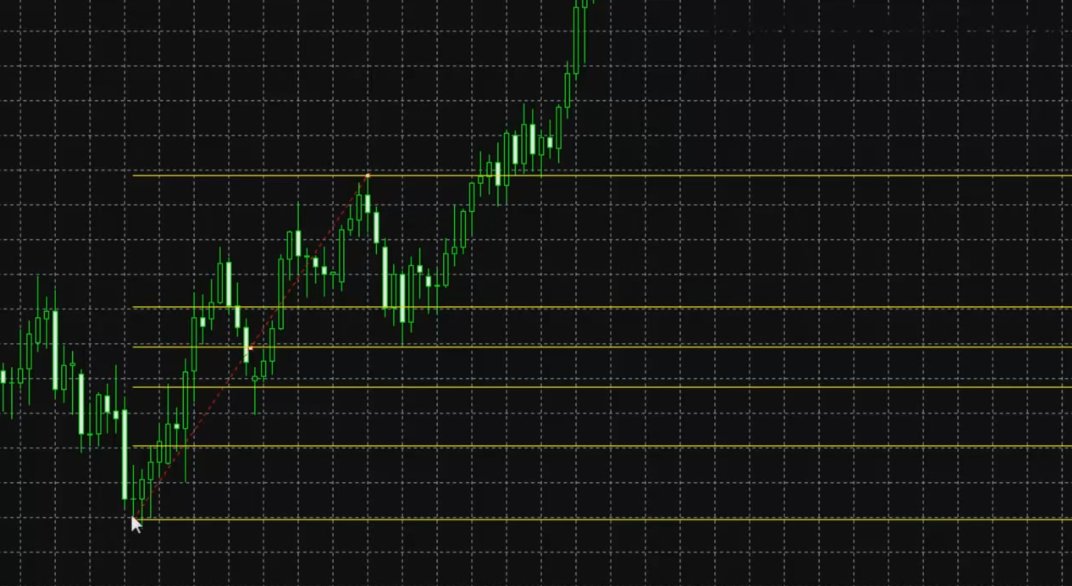 The trend minimum remains the same.
And again we get levels for a potential end of the correction. As we can see, the price at first stalled at 38.2%:
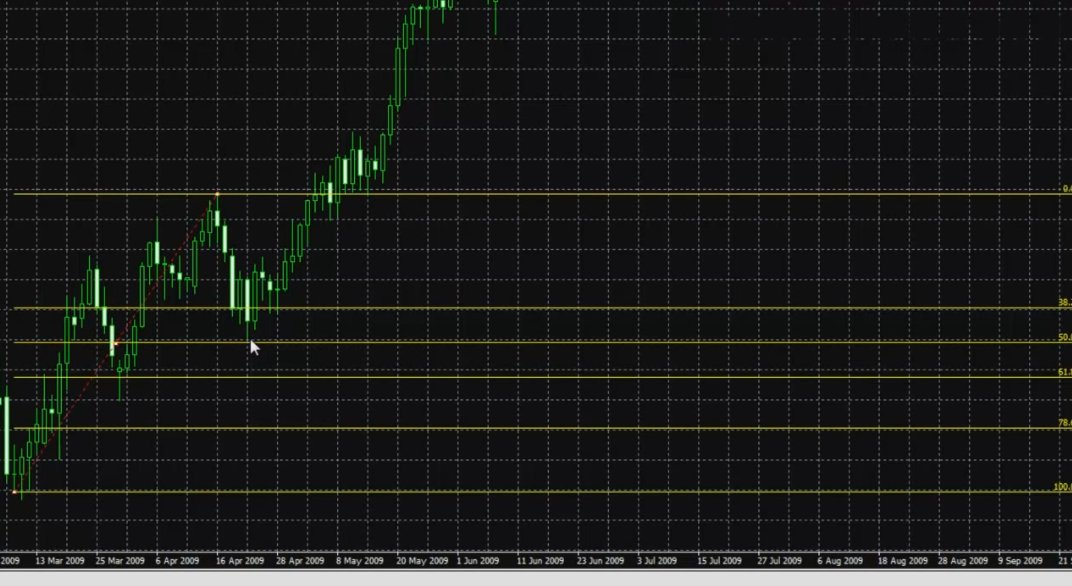 And then it reached the 50% level, and the upward trend continued. As soon as the price reaches the 38.2% mark, this does not mean that you need to buy urgently right away:
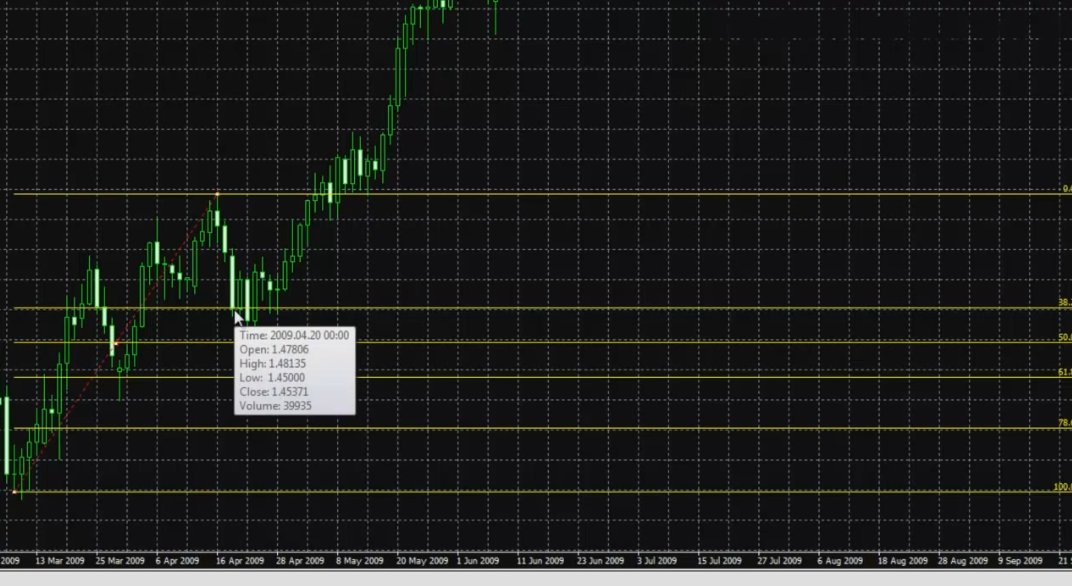 You should use Fibo levels only in combination with some other trading indicators or strategies.
If you see that the price reaches a Fibo level and a bounce is possible, then you can buy in. But if there are no signals that something is about to happen now, other than the fact that the price has reached the correction level, then we do nothing. Fibo levels are an auxiliary tool, but by no means the main one.
Let us look at one more example, but only with a downward trend.
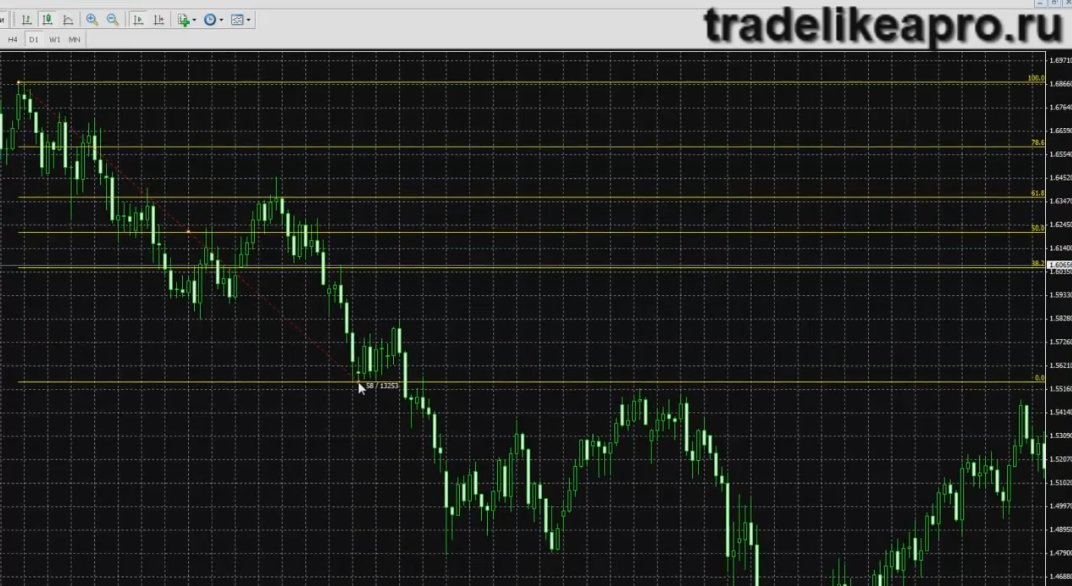
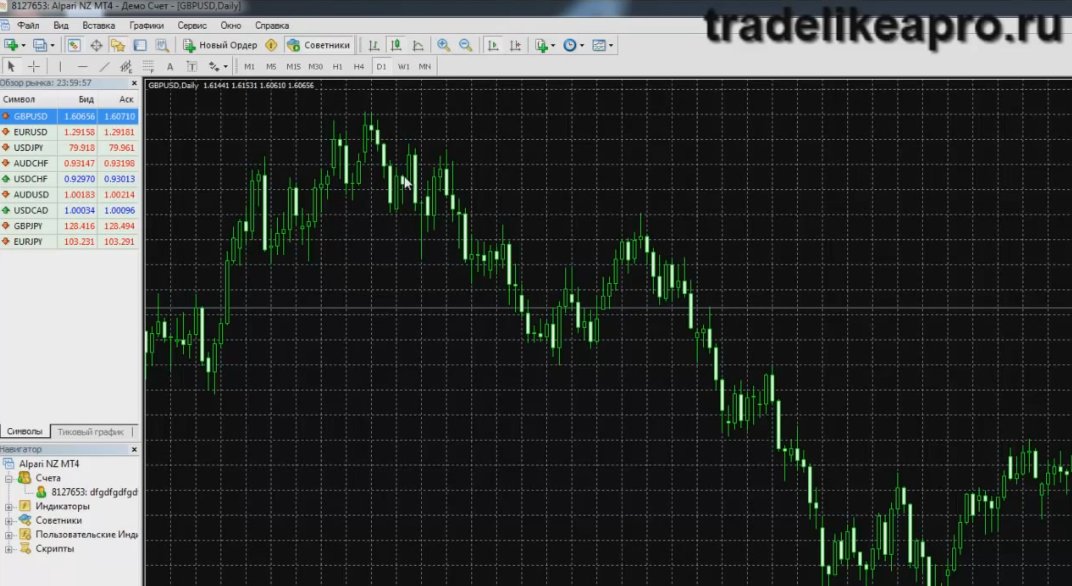 At its very beginning the price was going down, then it slowed down and a correction began. We need to determine where it can potentially end, and at which levels we should look for market entry points.
We select the Fibonacci Lines tool. For a downward trend we need to mark with the mouse the very top point, where the trend began and, without releasing the left button, bring our grid to the level where, in our opinion, the correction began:
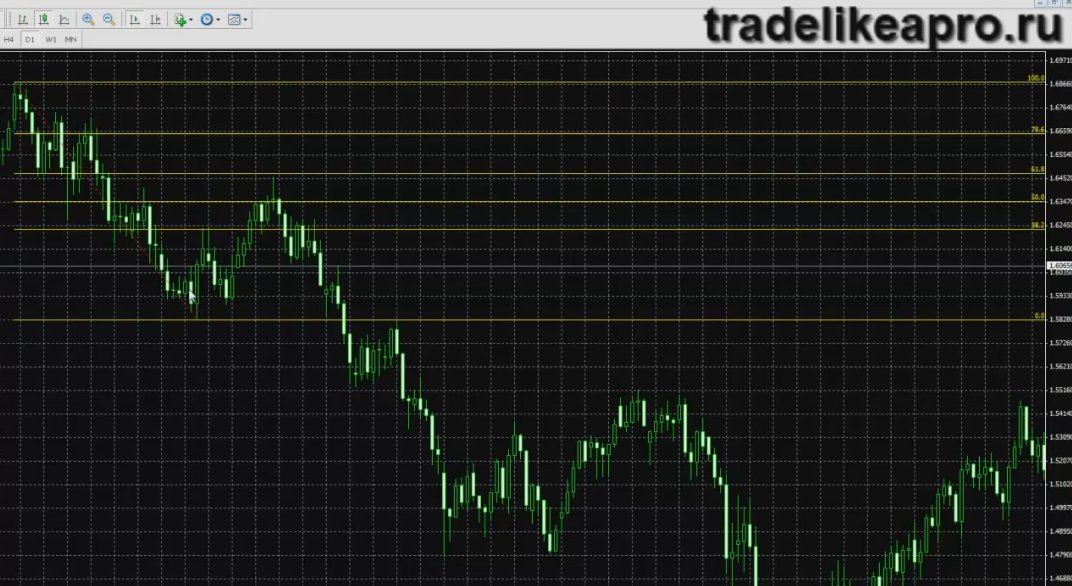 The first time, the price bounced off the 38.2 level, did not print a new low, and went up again all the way to the 61.8 level. These levels are very approximate, and you must understand that price is not obliged to bounce off the lines you drew and immediately reverse. Fibonacci levels are levels, not lines.
The price reached the 61.8% level and drew a pin bar:
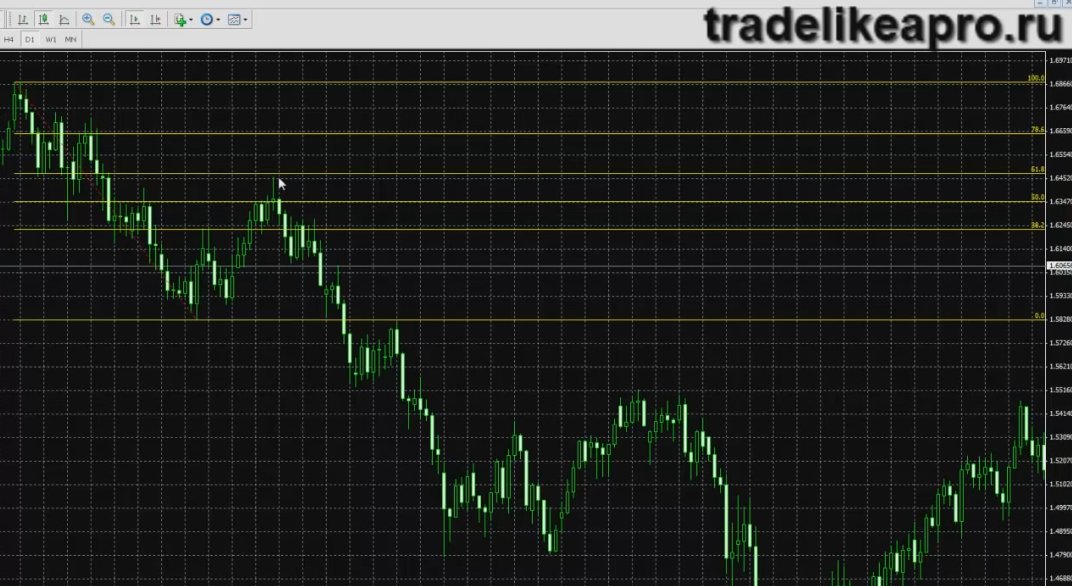 And then it moved downward again and printed new lows. Once a new low is reached, we can drag our grid lower:
 And you can clearly see that the price failed to reach the 38.2 level and went down:
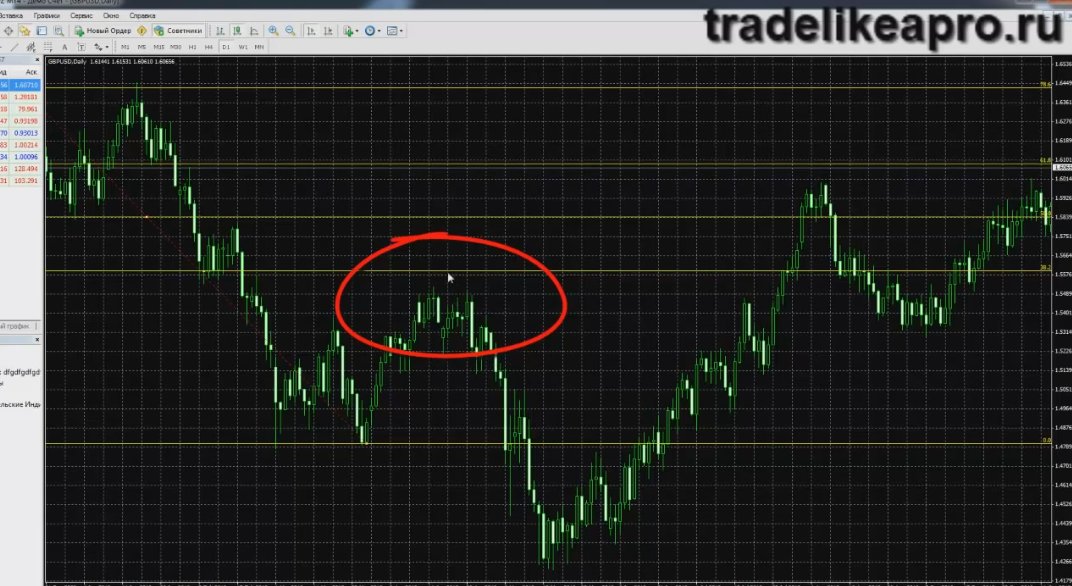 Fibo levels do not work out every time. But one way or another, they should be taken into account, because very often they play a good supporting role. This all concerns retracement levels.
Fibonacci Extensions
But we also have a tool called Fibonacci Extensions, which uses the same principle as the levels derived from the sequence of numbers discovered by the great mathematician. The “magic” of these figures is easy to explain from the standpoint of psychology of the subconscious reflexes of traders to price movement, if we present the values as a percentage series: 23.8%, 38.2 and so on.
It is precisely at these points, relative to the proportion (range) of the asset's previous move, that most traders see reversals as an opportunity for entry, an additional entry, or a target for averaging a pyramid of orders placed in the hope of a trend continuation, in order to:
- Increase the profit of an existing trade;
- Correct a premature entry, “lower” the overall price or enter at a more attractive rate, closing the first trade at break-even when the move returns to the trend.
The validity of the assumption that all traders choose the same levels based on psychology and percentage ratios was proven by Elliott. It was he who discovered the transformation of the Fibonacci number sequence into percentage level proportions, based on numerous observations and calculations, from which the famous “Wave Theory” emerged.
Without the mathematician's numbers, it would have been impossible to discover the five-wave structure and the three corrective waves, and to determine their reference and reversal points. Fibonacci Extension is a tool that simplifies the task of calculation and the search for Elliott patterns.
What Is Fibonacci Extension?

Fibonacci Extension is two multidirectional trend lines connected together and linked to Fibonacci levels starting from 61.8%.
In the standard interpretation of this tool on many trading platforms, including Metatrader, three such levels are implemented: 61.8, 100, 161.8. The numerical choice is explained by the scope of the tool's application:
- Fibonacci Extension represents two Elliott waves, usually I and II, with the goal of finding correction points on the third, the longest trend move.
The use of the tool assumes that the start of wave II is above wave I in an uptrend and below it in a downtrend.
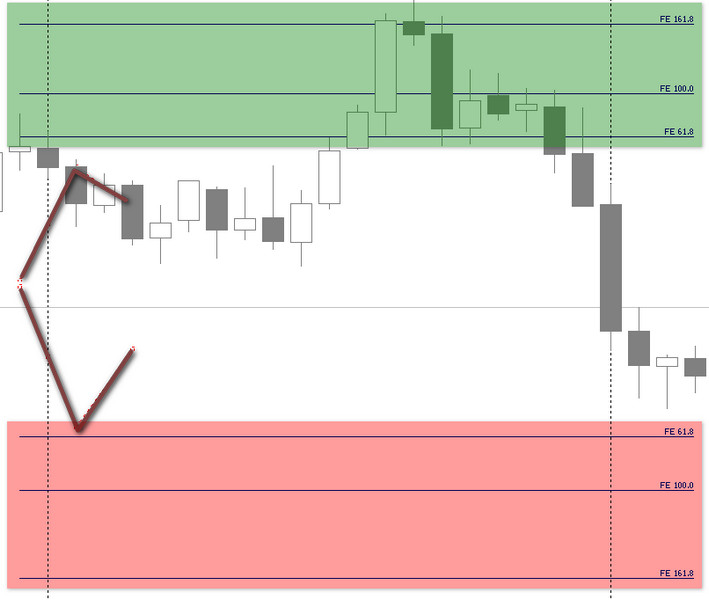 Some wave traders use Fibonacci Extension universally, placing it at the end of the second wave below the first in an uptrend, and vice versa in a downtrend, in order to confirm the peaks/troughs of the corrective three ABC waves.
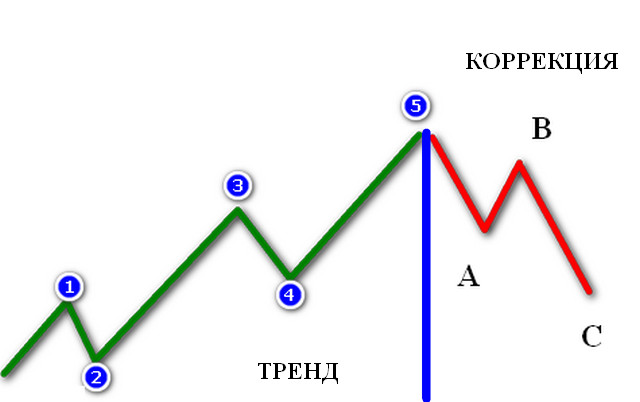 In ordinary Fibonacci waves, a trader considers only one trend move in order to catch an entry moment on a correction, represented by at least three levels 38.2%, 50% and 61.8%; sometimes 23.8% is added, which “works” in a strong, impulsive trend. The levels work very well in the event of a sharp directional change in the rate of a currency pair.
The 61.8% figure is a signal to stop trying to enter with the trend, indicating that it has been “broken” by such a deep correction. Therefore, it is logical that this line was chosen as the first take-profit in Fibonacci Extension. This tool works on an already formed trend pattern, and this is the main difference between levels and extension:
- Fibonacci lines show entry points on a reversal in the direction of the trend;
- Fibonacci Extensions forecast profit-taking points when the trend continues.
Rules for Plotting Fibonacci Extensions

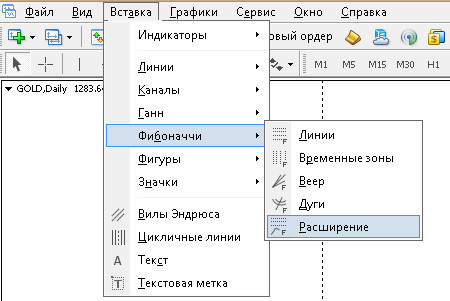
The graphical indicator “Extension” is available in Metatrader through the “Insert” menu and is located next to the “arcs” at the very bottom of the drop-down general list of Fibonacci tools.
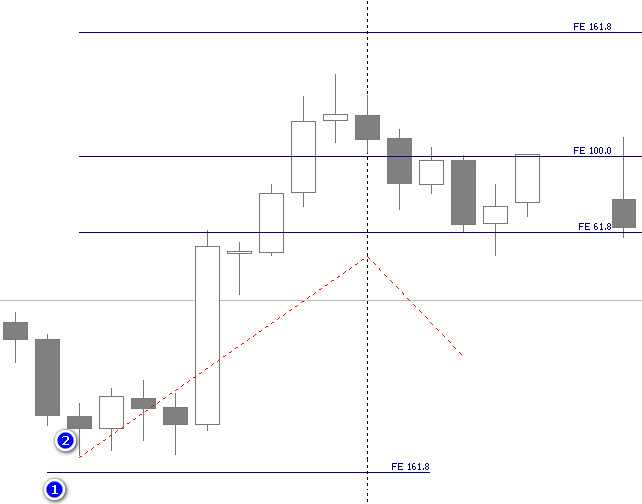
 If, after calling the indicator display function, you simply click on the chart, only one 161.8 level will appear on it, as in case (1). To get a full extension display, immediately mark the point of wave I and, while holding down the left mouse button, drag the indicator, stretching the levels and lines to the starting point of wave II. A broken line and three Fibonacci level segments will appear, as in case (2); this figure will then be easier to adjust on the chart than the line from example (1).
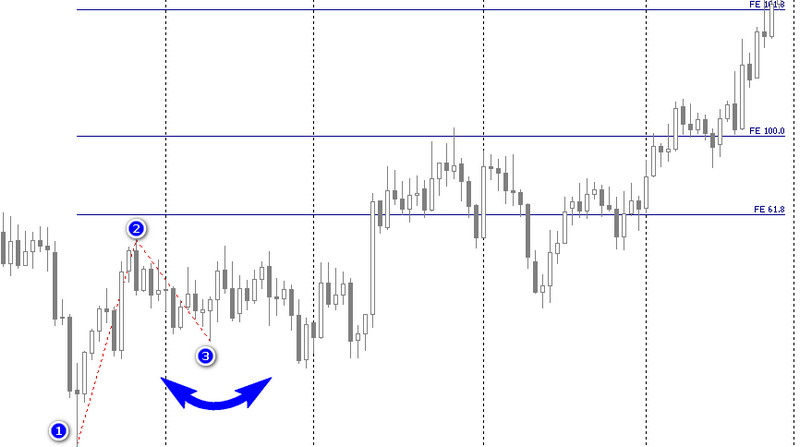
 In the ideal plotting option, a maximum/minimum (1) is found, the line is stretched to the peak/trough (2), and there the mouse button is “released”, after which point (3) is adjusted.
 The thickness, color, and display options of the lines are configured in the indicator window opened through the right mouse button menu; the process is no different from the analogous options for Fibonacci levels.

For traders familiar with Elliott wave theory, choosing the initial reference point will not be difficult, but most currency speculators have problems with this if they have not delved into the essence of the wave-finding method, so simpler options for choosing the start of drawing the indicator will suit them:
- At the trend reversal point, where there are already two waves moving against the main movement.
For example, the market fell sharply in direction (1), but the correction at point (2) after the breakout of peak (3) represents a segment of a local upward trend. If the trader uses an entry on this impulse or after this impulse, then the first take-profit will be at the 61.8% level.
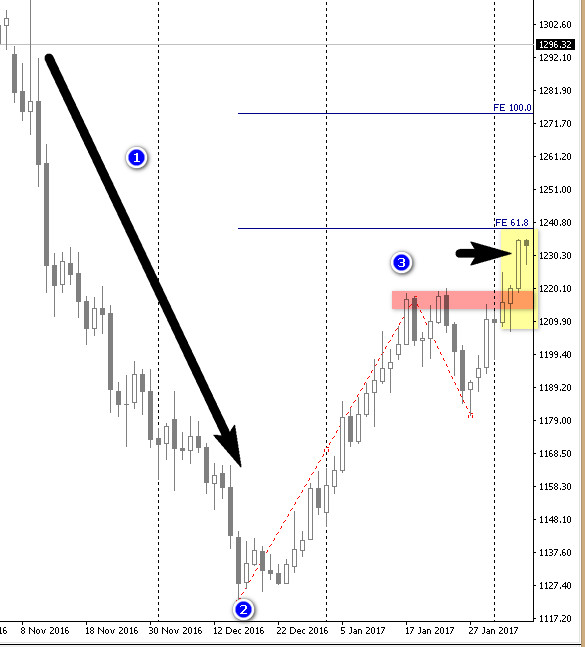 A feature of the Fibonacci extension indicator is the fact that a breakout above the above-mentioned line indicates the possibility of quotes moving to the next level of 100, and the final point where all positions should be closed is the 161.8% mark.
Traders use the tactic of partially taking profit at 61.8, together with moving the stop-loss to breakeven on the remaining position at the entry price. There are also options for placing opposite pending orders to create a "lock" (lock) to avoid splitting trades on the first order.
- At point IV, after the third wave.
Almost every trader can detect the third wave - it is the longest in the trend. In this case, the trader "draws" waves IV and V in order to find the point of trend exhaustion.
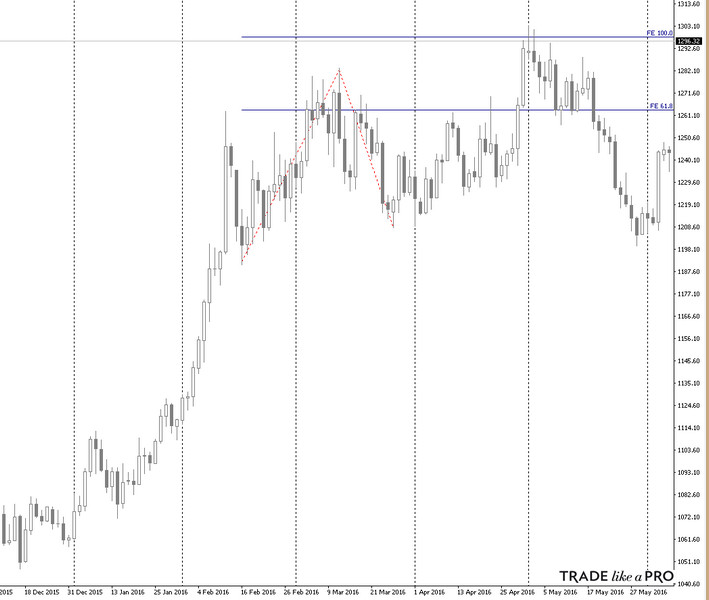 When building a Fibonacci extension, it is important to remember that this is an auxiliary indicator that determines points of slowdown, not reversal, of an already formed local two-wave trend. As with Fibonacci levels, the main rule for displaying the extension is that the start of the lines should coincide with the extremes (highs/lows) of quotes.
Examples of Using Fibonacci Extension

Fibonacci extension is used to manage already open trades along the trend, where after confirmation of its continuation by the location of peaks/troughs, waves I and II are found:
- A "pyramid" of orders is placed, with take-profit at levels 61.8, 100 and 161.8 by 1/3 each or in another proportion;
- The moment of "zero risk" is determined by moving the stop-loss into the breakeven zone, at the trade entry price, when the first 61.8 level is reached.
The indicator levels can also be used to search for pivot turning points, to forecast the moment of trend reversal, if the trader uses the extension on waves IV and V after finding an extended trend segment characterized by Elliott wave III.
In this case, line 100 plays the role of the reversal level, and the following speak in favor of choosing it:
- Frequent coincidences of this level with a double top or bottom;
- The theoretical premise for the formation of Elliott corrective waves ABC after wave IV.
The corrective formation B and C can serve as a reason for an "unusual" use of the extension. Pay attention to the figure below: after receiving confirmation of the formation of these Elliott waves, the trader "lowers/raises" the second end of the indicator below/above the first base.
At first glance, with such a construction, the meaning of the levels is "lost," since they turn out to be below the waves. However, wave C triggers the resumption of the trend in the form of a five-wave formation, and the 61.8, 100, and 161.8 lines play a major role here:
- Entry points on a "breakout" with Buy Stop orders in a rising trend and Sell Stop in a falling trend;
- Support/resistance after the quotes have consolidated above/below these lines.
Conclusion
 Do not forget that Fibonacci levels and extensions should not be used by themselves - you will lose completely. They should be combined with other elements of technical analysis, such as indicators, trend lines, Price Action patterns, etc. These are auxiliary tools, and this should always be remembered.
Sincerely, Pavel Vlasov TradeLikeaPro.ru
