
MVRV Bitcoin: How the On-Chain Indicator Reveals the Market’s Real Value

MVRV is one of the best-known on-chain analysis indicators. It helps assess Bitcoin’s position relative to the aggregate value at which the coins in circulation last moved on the blockchain.
Unlike traditional technical analysis indicators, MVRV considers more than just the BTC price and trading volume. The indicator uses data from the blockchain itself and answers the question: how much does Bitcoin’s current market value differ from the approximate aggregate cost basis of the coins?
MVRV is particularly useful for analyzing Bitcoin’s long-term market cycles and assessing holders’ unrealized profits and losses. It also helps identify periods when the market has historically become excessively expensive or cheap.
The History of MVRV
The history of MVRV begins not with the ratio itself, but with the concept of Realized Capitalization.
In 2018, Nic Carter and Antoine Le Calvez developed the concept of realized capitalization, which later became one of the fundamental elements of modern on-chain analysis. The idea was based on valuing Bitcoin using the price at which individual coins last moved on the blockchain. This approach made it possible to move away from valuing all coins at the current market price and instead value them at the actual price of their last movement — thus better reflecting the true structure of holders’ cost basis.
Building on this foundation, Murad Mahmudov and David Puell introduced MVRV in October 2018. The original study was published on October 1, 2018. In it, the authors defined the ratio as Market Value divided by Realized Value and examined its relationship with Bitcoin market cycles.
The original study identified 2 key levels: 1 and 3.7. Values below 1 traditionally corresponded to periods of severe market undervaluation, while values above 3.7 indicated a highly valued area. However, the authors emphasized that absolute levels may become less reliable as the market structure changes: a growing share of long-term holders, the emergence of institutional players, and new liquidity channels alter established cycle patterns.
Derivative versions of MVRV appeared later: MVRV Z-Score, MVRV for long-term and short-term holders, Adjusted MVRV, and other metrics. They made it possible to adapt the basic indicator to different types of market participants and time horizons, increasing its analytical value. For example, versions for different holder cohorts help distinguish the behavior of “old” and “new” coins more precisely — and therefore reveal exactly who is currently driving market momentum.
What MVRV Means in Simple Terms
MVRV stands for Market Value to Realized Value—the “ratio of market value to realized value.”
The basic formula is:
MVRV = Market Cap / Realized Cap
where:
Market Cap is Bitcoin’s current market capitalization;
Realized Cap is realized capitalization calculated using the BTC price at the time each coin last moved.
Coin Metrics defines MVRV precisely as the ratio of the current value of an asset’s supply to its realized value.

In practice, an equivalent expression is also used:
MVRV = current BTC price / Realized Price
Realized Price is realized capitalization divided by the Bitcoin supply. Glassnode uses this exact interpretation when describing MVRV.
Suppose Bitcoin’s market capitalization is $1 trillion and its realized capitalization is $500 billion. Then MVRV = 1,000 / 500 = 2.
This means the network’s current market valuation is approximately 2 times higher than its aggregate realized value.
In a simplified interpretation, the market is in a zone of significant unrealized profit. Glassnode notes that when MVRV equals 2, the price is approximately 2 times higher than the average realized price, while the corresponding unrealized profit relative to Realized Cap is about 100%.
To fully understand the logic of MVRV, it is necessary to understand Realized Cap—realized capitalization.
Conventional market capitalization (Market Cap) is calculated using a simple formula:
Market Cap = BTC price × number of coins in circulation.
This model does not account for ownership history: Bitcoin purchased 10 years ago for $100 and Bitcoin purchased today for $100,000 are valued identically—at the current price. In other words, Market Cap reflects only market value, ignoring the prices at which the coins actually came into holders’ possession.
Realized Cap is based on a different principle: coins are valued at the price recorded when they last moved on the blockchain. Coin Metrics describes realized capitalization as the sum of the value of the current supply, with each unit valued at the price of its last movement.
In essence, Realized Cap reflects the aggregate cost basis of the coins in circulation—it is the approximate total price paid to acquire them.
Suppose there are 3 coins:
Bitcoin A last moved when the BTC price was $20,000.
Bitcoin B—at a price of $40,000.
Bitcoin C—at a price of $60,000.
For conventional capitalization, all 3 coins will be counted at the current market price, regardless of their history.
For Realized Cap, each coin is counted at the price of its last movement. In our example: (20,000 + 40,000 + 60,000) = $120,000. This is the realized capitalization of these 3 coins.
This approach makes Realized Cap less sensitive to short-term price fluctuations than conventional capitalization. It smooths out market spikes and better reflects the long-term structure of Bitcoin holders’ cost basis.
This resistance to noise is precisely what allows realized capitalization to serve as the basis for on-chain metrics such as MVRV: the indicator stops “twitching” with every price movement and begins to show fundamental shifts in the distribution of profits and losses among holders.
How to Interpret Bitcoin MVRV
To understand MVRV, it is useful to identify 4 basic situations, each reflecting a particular phase of the market cycle and holders’ economic position.

MVRV Below 1
This means that Bitcoin’s current market value is, on average, below its realized value. In other words, the market price of the coins is lower than the price at which they last moved on the blockchain.
Historically, MVRV values below 1 were recorded during deep bear markets. A CFA Institute study identifies such phases, in particular, in 2012, 2015–2016, 2019–2020, and the 2022–2023 bear market.
It is important to understand that a level below 1 does not in itself guarantee an imminent upward reversal. It merely indicates that, in aggregate, the market is below the aggregate realized cost level—and this may represent either a point where demand begins to form or a continuation of selling pressure.
MVRV Around 1
This range reflects an approximate balance between current market value and aggregate realized value.
This zone is particularly informative when analyzing transitions between bearish and recovery phases of the market. The first signs of stabilization are often recorded around MVRV ≈ 1: some holders stop realizing losses, while new participants begin building positions based on the average on-chain cost basis.
MVRV Above 1
When MVRV exceeds 1, most of the aggregate value of the coins is valued by the market above their realized value. The higher the indicator, the greater the amount of potential unrealized profit accumulating in the system.
This creates conditions for profit-taking: holders become more motivated to sell some assets and turn unrealized gains into realized gains. However, a high MVRV is not an unambiguous sell signal—it only shows that the economic incentives to take profits are strengthening. The behavior of different holder cohorts, such as long-term and short-term holders, may vary significantly, and this determines whether the incentive turns into actual selling pressure.
Very High MVRV
Extremely high indicator values have historically coincided with phases of market euphoria and cycle tops. Coin Metrics and CFA Institute emphasize the connection between MVRV peaks and periods of large unrealized profits followed by profit-taking.
At the same time, there is no universal “red line”: threshold values evolve along with the market.
For example, a Glassnode study of Bitcoin’s mature stage, beginning in 2017, analyzes levels of 0.8, 1.0, 2.4, and 3.2 instead of mechanically using the old benchmark of 3.7.
MVRV should be viewed not as a rigid indicator, but in terms of value ranges and context.
MVRV Variations
Several variations of the MVRV indicator have been proposed to date.
STH-MVRV and LTH-MVRV make it possible to analyze the market by holder cohort. For example, Look Into Bitcoin defines STH-MVRV using coins that have been in motion for less than 155 days and LTH-MVRV using older coins. This approach is considerably more informative: it shows exactly who—long-term or short-term holders—is currently driving market momentum and where unrealized profit or loss is concentrated.
One of the best-known derivative indicators is MVRV Z-Score.
Basic MVRV shows the ratio of market capitalization to realized capitalization. MVRV Z-Score additionally relates the difference between Market Cap and Realized Cap to the historical volatility of market capitalization.
Coin Metrics describes the formula as follows:
Z-Score = (Market Cap − Realized Cap) / standard deviation of Market Cap.
The purpose of this transformation is to make extreme deviations more comparable across different periods of Bitcoin’s history while accounting for changes in the scale of the market.
Why MVRV Is Connected to Market Cycles
The economic logic of MVRV is based on a clear mechanism. When Bitcoin rises for a long time, coins acquired at low prices become worth significantly more than their original value. As a result, market capitalization begins to substantially outpace Realized Cap, and MVRV rises.
The amount of unrealized profit held by coin owners increases. Some investors in this situation seek to lock in their gains. If many market participants begin selling at the same time, some previously unrealized profit becomes realized, and selling pressure may accelerate a correction.
The opposite process occurs in a bear market. The price falls, MVRV declines, and owners of coins purchased at higher prices face unrealized losses. When MVRV is below 1, the market is, on average, below the aggregate realized cost level. Historically, such periods have been relatively rare and have coincided with deep phases of Bitcoin’s decline.
This is MVRV’s main value: the indicator makes it possible to assess holders’ economic position, not just price movements. An analyst sees not merely a price chart but the structure of profits and losses across the network—and can therefore distinguish persistent mechanisms, such as profit-taking amid high unrealized returns, from random fluctuations.
The MVRV Indicator for Analysis and Trading
How to Use MVRV in Bitcoin Analysis

MVRV is primarily an on-chain analysis tool with a longer time horizon than RSI, MACD, or most classic indicators.
1. Market Cycle Analysis
MVRV makes it possible to assess where the market stands relative to historical extremes.
Very low values correspond to a phase of deep decline and capitulation. High values correspond to periods of significant unrealized profit and overheating.
2. Identifying Potential Extreme Zones
Glassnode shows that extreme MVRV values can be used to identify historical areas of cyclical highs and lows. The study relies not on a single fixed level, but on several statistically defined zones.
This is a more accurate approach than the rule “MVRV has reached threshold X—the market must reverse”: statistical zones account for changes in the market structure and do not impose rigid boundaries.
3. Trend Analysis
MVRV can be considered not only through its absolute value but also through its dynamics. Glassnode, for example, examines the relationship between MVRV and its annual moving average to analyze Bitcoin macrotrends.
A rising MVRV means that current market value is increasingly exceeding realized value. A decline reflects the opposite process: the market valuation moves closer to holders’ aggregate cost basis.
4. Identifying Divergences
One useful technique is to compare MVRV with the price.
For example, the price may set a new high while MVRV forms a lower high. This means that although the market price is higher, the average cost basis of coins in circulation has also risen—in other words, the price increase is not accompanied by proportional growth in unrealized profit. Glassnode views such bearish divergences as one sign of supply distribution near major market tops.
Can MVRV Be Used to Trade Bitcoin?
Yes, but primarily as a context indicator rather than a standalone trading signal.
MVRV is fundamentally different in nature from indicators such as RSI on an hourly chart: it is designed to assess market conditions over a longer horizon. The trading logic may therefore look like this:
MVRV → identify the cycle phase → other on-chain metrics → price structure → specific trading decision.

For example, a low MVRV may signal that the market is in an area of historically low valuation. But the indicator does not show whether the decline will continue over the next few days.
Similarly, a very high MVRV reflects significant unrealized profit, but Bitcoin may remain in a highly valued zone for a long time.
Professional analysis is therefore usually not limited to a single metric. CFA Institute explicitly notes that such metrics should not be used in isolation when assessing crypto assets.
It is useful to consider MVRV alongside logically related metrics—this provides a more complete picture of market conditions than observing a single number.
Realized Price reflects the approximate aggregate cost basis of coin ownership.
NUPL (Net Unrealized Profit/Loss) measures unrealized profit or loss as a share of market capitalization.
SOPR (Spent Output Profit Ratio) shows the profit or loss at which actually spent coins are moved.
Where Can You View MVR?
The MVRV indicator is available on TLAP, which displays current and historical MVRV and MVRV Z-Score values.
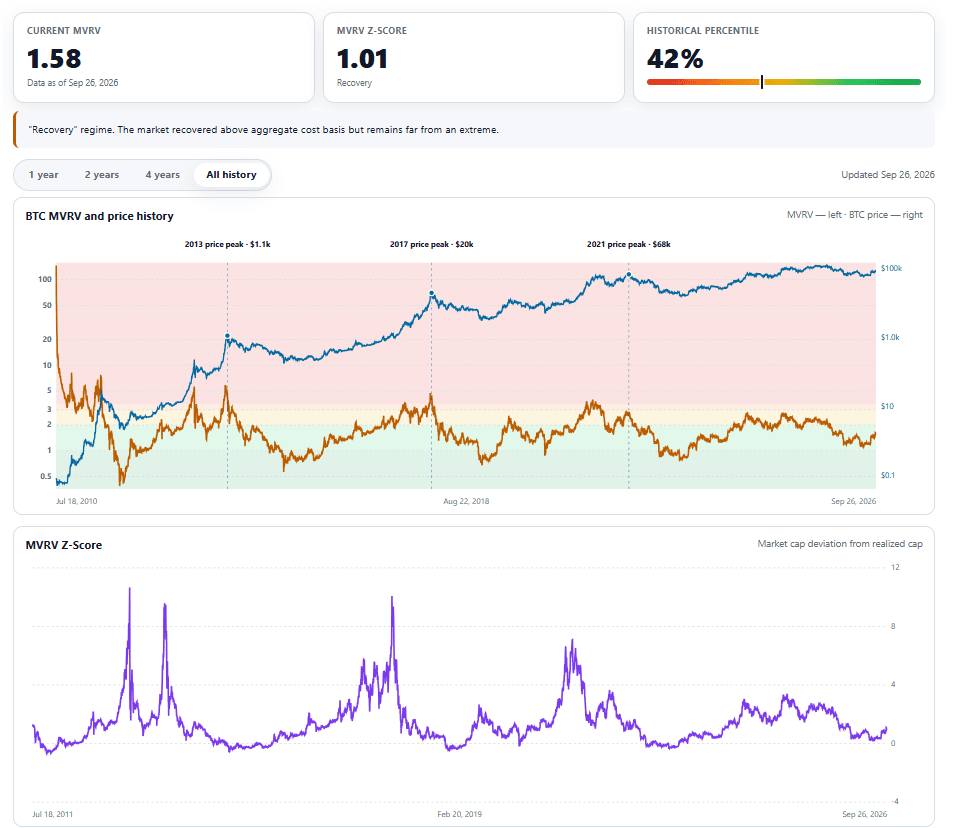
It is important not to confuse MVRV with MVRV Z-Score. The metrics are related but serve different analytical purposes: the first shows the ratio of values, while the second shows the statistical significance of that ratio.
Bitcoin cycles are highlighted by color on the main chart.
Capitulation (below 1): market cap is below realized cap.
Recovery (1–2): the market is above realized value, but profits are moderate.
Expansion (2–3): holders’ profits rise along with the price.
Overheating (3–3.5): historically high values that were the first signs of a halt and subsequent correction.
Euphoria (above 3.5): a rare euphoria zone. These values appeared before the second halving.
MVRV Limitations
MVRV has several important limitations that must be considered when using the indicator.
Realized Cap is not an exact cost basis. Realized Cap is an estimated on-chain valuation based on the price when each coin last moved. It is not equal to the actual purchase price paid by each individual investor and does not account for over-the-counter transactions or other operations not recorded on the blockchain.
Old and lost coins distort the indicator. Coins from the early years that have not moved for a long time and may be inaccessible to their owners have a very low last-movement price. According to Glassnode’s observations, such coins overstate estimated unrealized profit. This is why Adjusted MVRV versions have been developed: they exclude some long-inactive supply and provide a more accurate picture.
Historical thresholds are not immutable market laws. The best-known values, 1 and 3.7, come from a 2018 study. However, subsequent research uses other statistical ranges adapted to the changed market structure. Mechanically applying old thresholds to new conditions may lead to incorrect conclusions.
The short-term horizon is not MVRV’s domain. The indicator is unsuitable for predicting prices over several hours or days. Its strength lies in analyzing long-term processes: cycle phases, the accumulation of profits and losses, and macrotrends. Attempting to use MVRV as a short-term trading signal undermines its essence and leads to incorrect decisions.
Disclaimer
This material is intended solely for educational and informational purposes and does not constitute investment, financial, or trading advice.
MVRV is based on historical data and on-chain analysis models. Past indicator values do not guarantee that similar market behavior will recur in the future.
Investment decisions must take other indicators, risks, and personal circumstances into account.