
Horizontal Volume and Cluster Indicators in Trading

Horizontal volume and cluster charts are tools for market volume analysis. Unlike the standard vertical Volume indicator, which shows volume by time intervals (candles), these tools reveal the volume structure at different price levels.
Horizontal volume and cluster analysis (footprint) indicators help examine the structure of trading activity at different price levels. They are used to identify areas of elevated volume, assess market balance, and study how buying and selling affect price movement.
This group includes two main tools: the horizontal volume profile (Volume Profile) and the cluster chart (Footprint). They work with volume data but differ in how they group and present it.
A horizontal profile aggregates trade volume by price level over a selected period. A footprint shows the distribution of volume within each candle and, depending on the settings, can separate it into buying and selling volume, calculate delta, or highlight imbalances.
It is necessary to distinguish between three levels of settings: the profile construction period, the data display mode, and the method for highlighting significant values. For example, a profile for a trading session and a profile for an arbitrary range are different ways of constructing a volume profile. Bid × Ask and Delta, meanwhile, are Footprint data display modes.
Horizontal Volume Indicators (Volume Profile)
A horizontal profile is a histogram of volume distribution positioned along the price scale. Its bars show trading volume at each price level over the selected period. For example, if the price fluctuated within the 100–105 range for several hours, the profile will show which prices saw the highest trading activity and which saw relatively low activity.
The main difference between the various types of horizontal volume indicators lies in how the time period is defined and the starting point for building the profile.
Classic Volume Profile Indicators
Basic Volume Profile Indicator
Originally, the volume profile was built using data from the entire chart or, if the trading platform or indicator allowed it, from an arbitrary date.
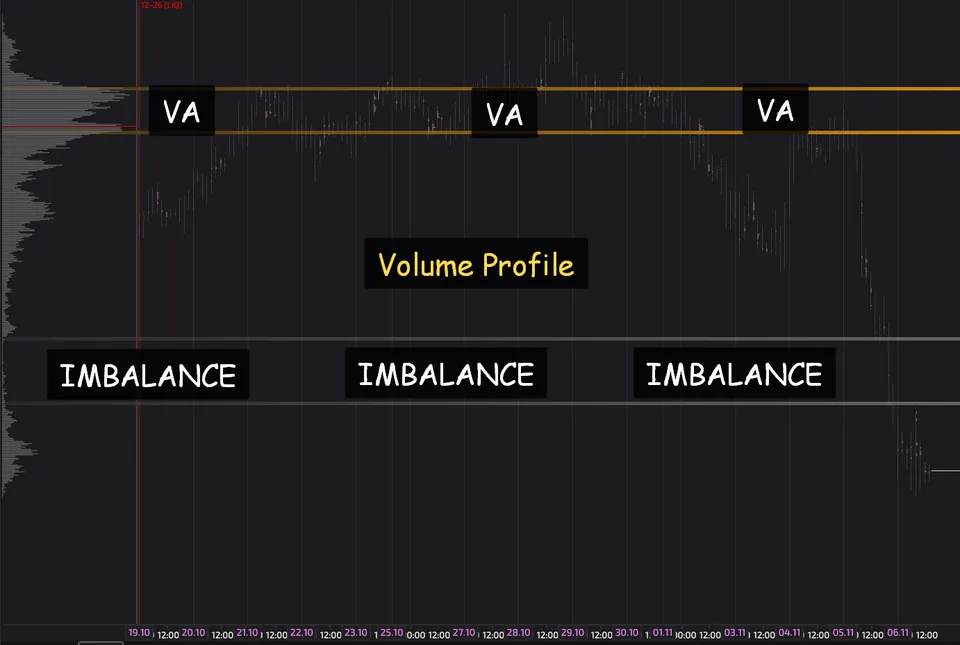
The basic indicator helps identify the main volume levels, highlight imbalance zones, and so on. It is used for:
a quick market overview;
finding the POC—the level with the highest volume;
identifying high-volume nodes (HVN) and low-volume nodes (LVN);
analyzing how price is positioned relative to the main zones of trading activity within the visible range.
The drawback of the classic volume profile is that its results depend on the chart scale. If the time range changes, the volume distribution changes as well. Furthermore, comparing two different periods is fundamentally impossible.
Therefore, to gain a deeper view of the market, you need to look at other volume profiles.
Fixed Range Volume Profile — a profile of a specified range
Fixed Range Volume Profile (FRVP) calculates volume for a specific section of the chart that the trader selects manually.
The start and end points can be set at the boundaries of an impulse, consolidation, trading session, or another movement of interest. For example, the image below shows a profile selected for a downward impulse.
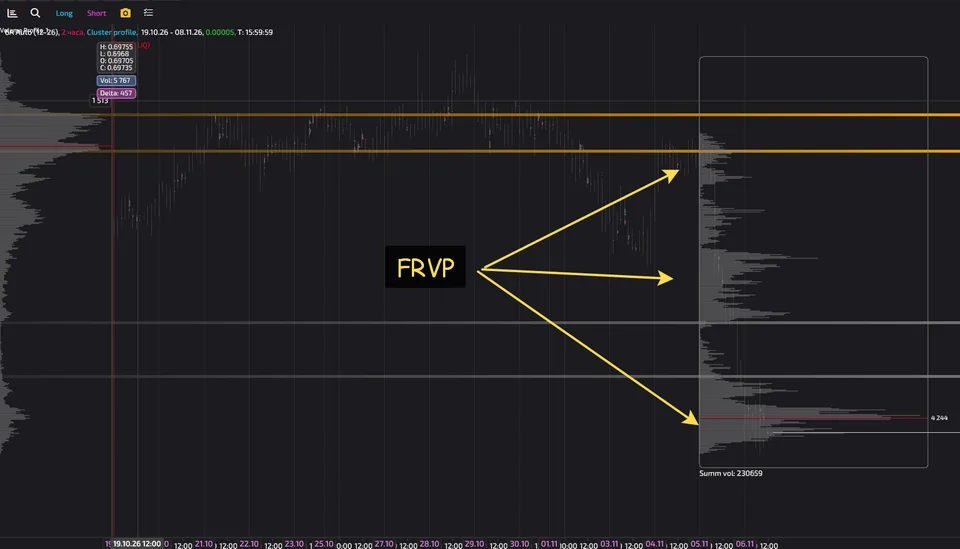
A custom profile is used for:
analyzing an individual trending move;
comparing an impulse and the subsequent consolidation;
finding areas of price acceptance within the selected range;
analyzing breakouts and returns to levels formed in the past.
The advantage of FRVP is control over the section being studied. This allows different movements to be compared using the same principle.
The main disadvantage is its dependence on the choice of boundaries. If the start or end of the range is selected without justification, the profile may give a distorted view of the structure of the movement of interest.
Periodic Volume Profile — periodic profile
Periodic Volume Profile (PVP) creates a sequence of profiles for specified periods. Depending on the settings, an individual profile may correspond to an hour, day, week, month, or another interval supported by the indicator.
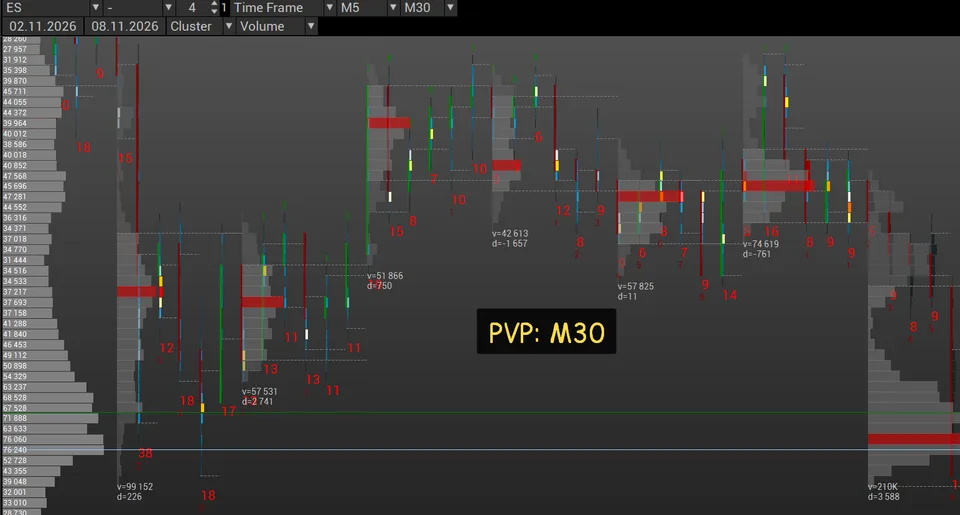
For example, when plotting 30-minute profiles, a trader sees the volume distribution for each 30-minute period separately. This helps compare trading activity within and between days, as well as analyze changes in market structure.
The periodic volume profile is used for:
comparing profiles across different timeframes (hourly, daily, weekly, etc.);
assessing changes in POC between periods;
identifying price levels that have repeatedly attracted trading activity;
analyzing the gradual shift in the main trading area.
Periodic Volume Profile is particularly useful for analyzing how the market shifts its area of price acceptance. If the POC of successive profiles moves upward, this shows that the highest trading volume is forming at increasingly higher levels.
Session Volume Profile — trading session profile
Session Volume Profile (SVP) is essentially a type of PVP. This indicator builds a separate profile for each trading session or specified subsession. Depending on the instrument, you can analyze the main trading session, premarket trading, the postmarket period or other intervals supported by the exchange.
Session profiles allow you to assess market participants' sentiment across different venues: for example, Europeans may be buying while Americans are selling.
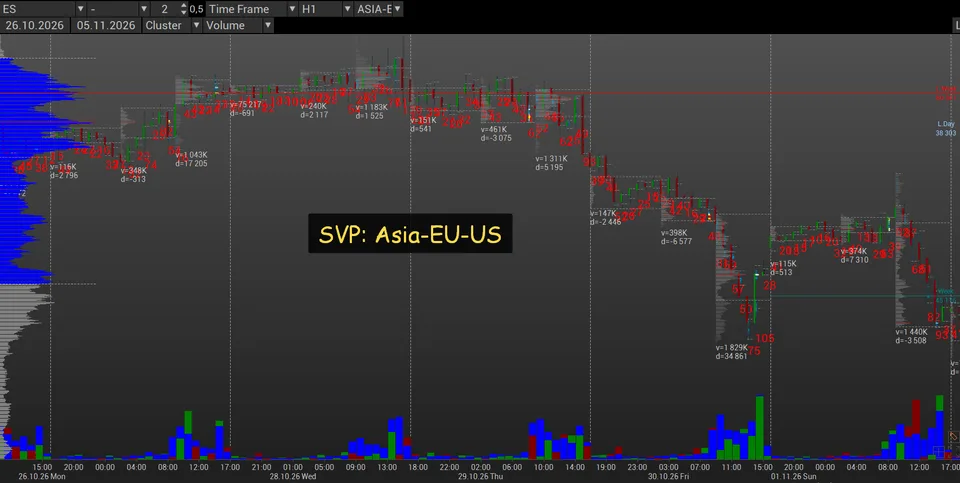
In the US futures market, traders actively use the RTH profile. Some trading platforms allow other sessions to be hidden, which is very convenient for visually comparing trading activity within the US session.
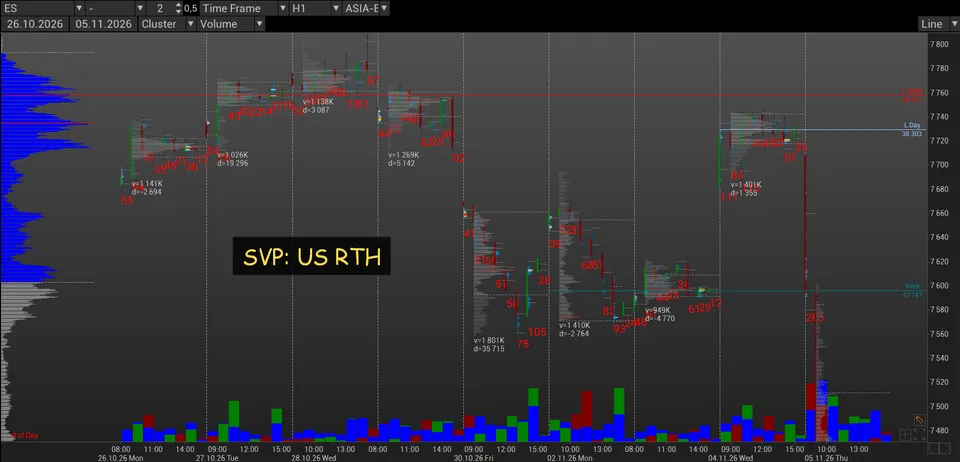
Session profiles are used for:
analyzing the intraday distribution of volume by session;
comparing the current session with previous sessions;
identifying levels around which the main trading activity developed during different sessions.
studying how the area of price acceptance shifts upward or downward.
The profile's shape can provide additional context. A broad profile with volume concentrated in the middle of the range often corresponds to a balanced session. A shift in volume toward the upper or lower part of the range may accompany a directional move.
However, the profile's shape is not a standalone predictive signal. Interpretation requires taking into account price dynamics, the timing of volume formation and the structure of previous sessions.
Other delta profile indicators
Delta Profile
These types of profile charts differ from those listed only in that a delta profile is displayed instead of a volume profile. The image below shows the overall delta profile and the delta profile for a specified range.
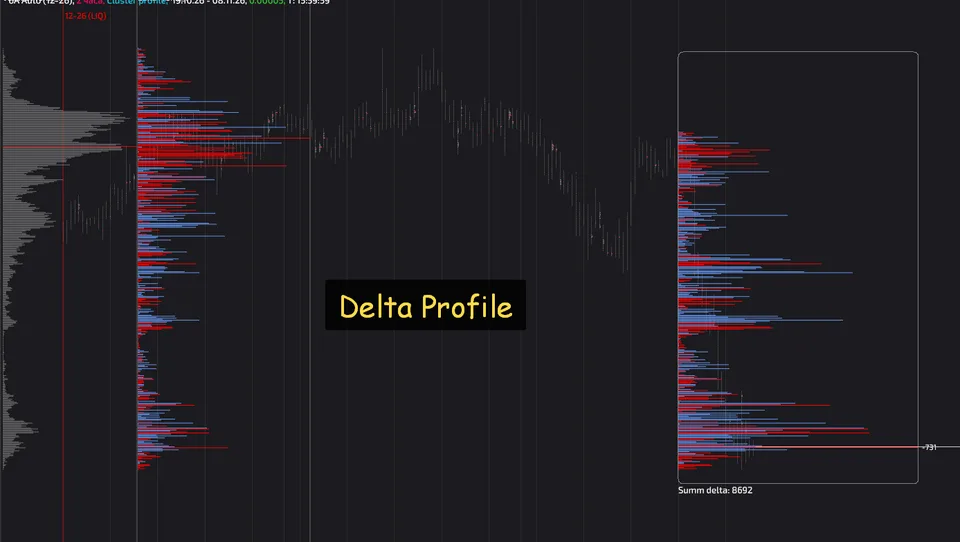
Delta profiles are used to assess the pressure exerted by market participants at each price level and identify the strongest zones.
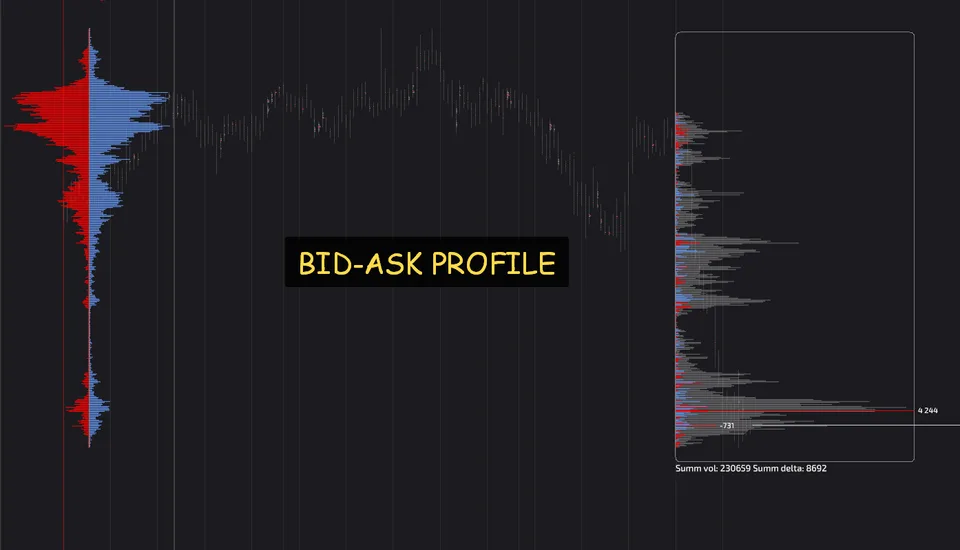
Bid-Ask Profile
This type of profile splits the total horizontal volume into buyer volume and seller volume on each price profile.
The bid-ask profile is often combined with a regular volume profile for better visualization.
Cluster Charts: Footprint Modes
Cluster charts, or footprints, provide a detailed view of volume distribution on lower timeframes. Footprints can be displayed as either profiles or clusters.
Cluster — cells at adjacent price levels have the same width. This presentation is useful for comparing numerical values within a candle.
Profile — cell widths vary in proportion to the volume at the corresponding price levels. The greater the volume, the longer the visual representation of the cell.
Both modes can display the same underlying data. The difference lies in the visualization, rather than in a cluster chart showing something different from a profile.
It is also necessary to distinguish between a profile within a footprint and a horizontal volume profile for a session or a specified range. The first analyzes the structure of an individual candle or bar, while the second analyzes aggregated volume over a longer period.
A cluster chart, or footprint (Footprint), divides each candle into individual price levels and shows the trading volume at each one. Depending on the settings, the data can be displayed as numbers, a color scale or a profile whose width is proportional to volume.
While a regular candle shows the open, high, low and close, a footprint allows you to examine what happened between these four points: where substantial volume traded, whether aggressive buying or selling predominated and how strongly this affected price movement.
Thus, a footprint helps analyze not only horizontal volume but also its structure in the context of price movement. Footprint modes differ in which values appear in the cells and how they are visualized.
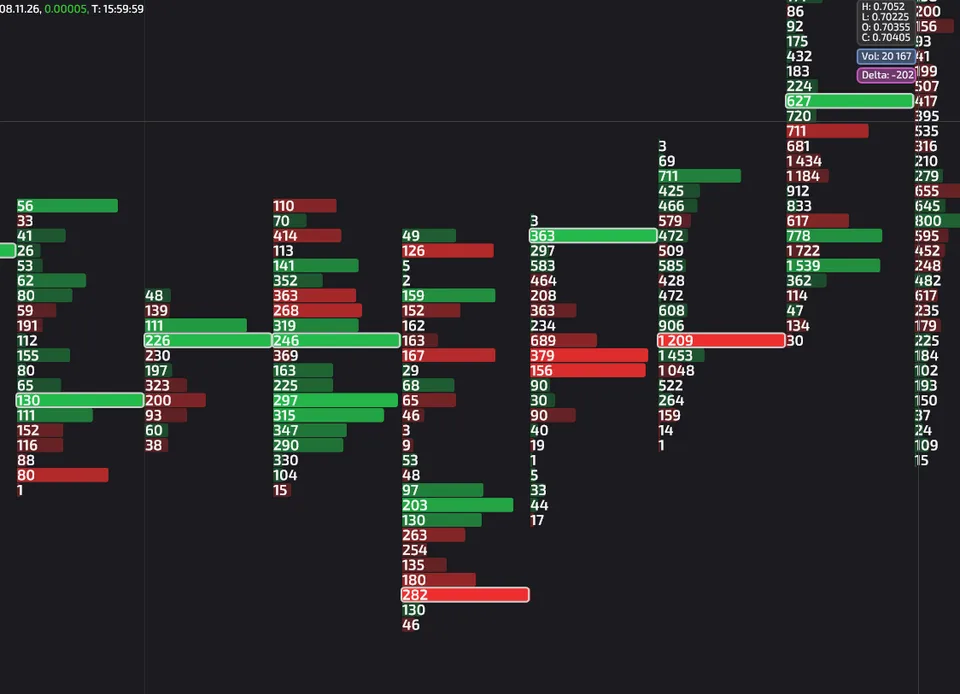
Bid × Ask — buying and selling at price levels
Bid × Ask is one of the most informative footprint modes. Each price level displays two values representing buying and selling volume according to the data classification method.
In the traditional exchange representation, Ask volume reflects trades in which buyers executed orders at the asking price, while Bid volume reflects trades in which sellers executed orders at the bid price.
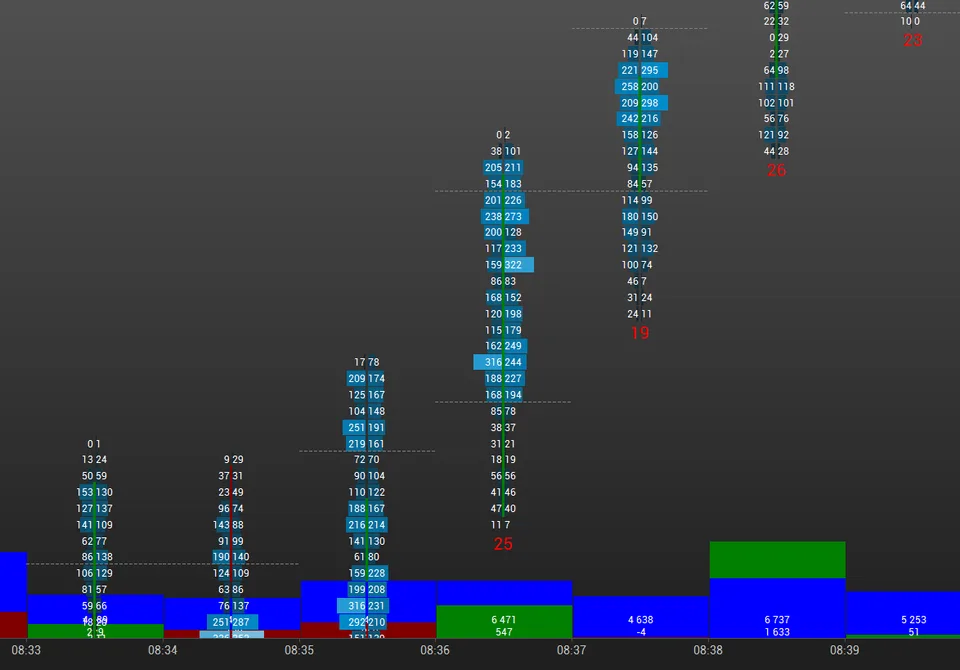
Below, we show the bid-ask profile again, this time for each individual bar. When zoomed out, the trading platform highlights the most heavily traded zones in color; when zoomed in, it shows the actual buying and selling volumes at each price.
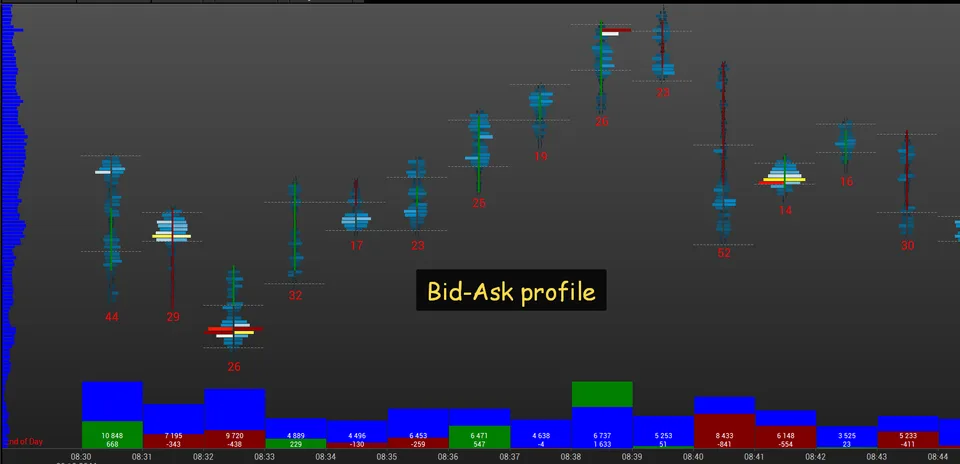
Another way to visualize a bid-ask cluster is as a table, where colors mark zones dominated by sellers or buyers, and numerical values show the actual buyer and seller volume at each level.
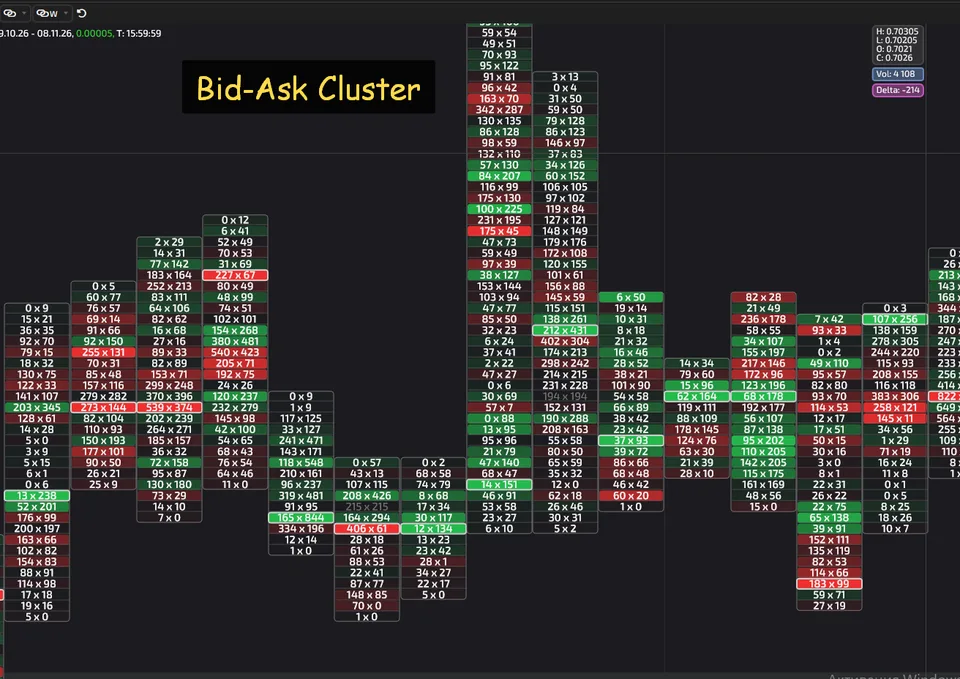
This allows you to examine both total volume and the balance between aggressive buying and selling at each level.
What it is used for:
To analyze buyer and seller initiative.
To find price levels where one side clearly dominates.
To assess whether trading activity is accompanied by price movement.
To investigate possible absorption of aggressive volume.
For example, if buying volume significantly exceeds selling volume at several adjacent levels, this may indicate buyer activity. However, if the price barely rises, an alternative must be considered: aggressive buying may be meeting substantial opposing volume.
An important limitation: not all platforms receive actual Bid and Ask trade classifications. Some use the direction of price movement on lower timeframes. Before interpreting the data, you therefore need to establish exactly how it is generated.
Bid/Ask Ladder mode displays buying and selling volume at successive price levels in a ladder format.
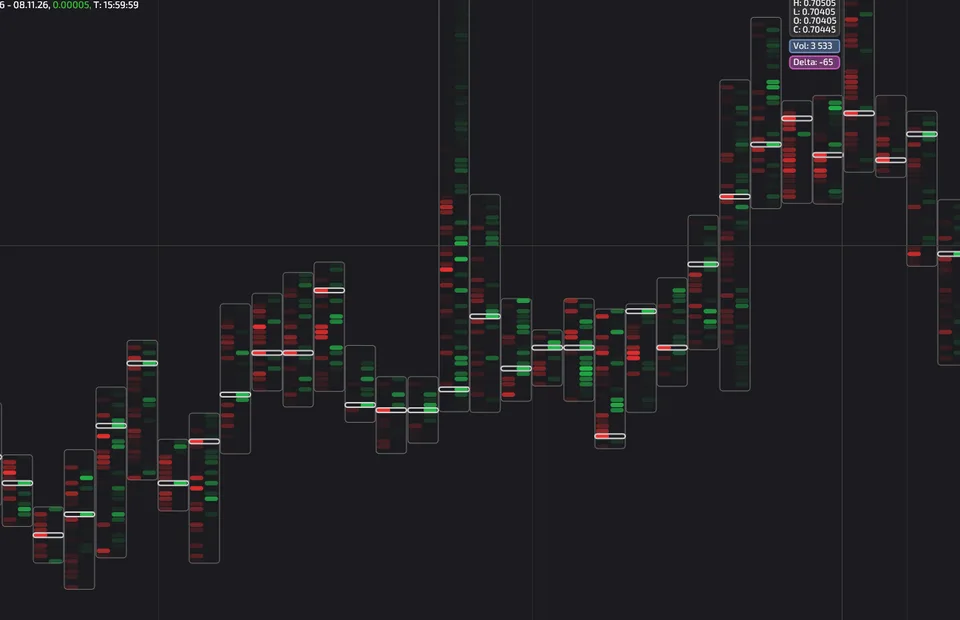
It is similar to the classic Bid × Ask mode, but individual platforms may differ in how they arrange cells, highlight the two sides, and display imbalances.
The ladder view helps you compare volumes at adjacent levels in sequence and see where the dominance of one side strengthens or weakens.
It is used primarily for detailed order flow analysis, especially when trading on short timeframes.
Volume — total volume at each level
In this mode, the footprint shows the total volume of trades executed at each price level within a candle.
Buy and sell volumes are not separated. This makes the mode suitable for analyzing the concentration of trading activity, but it does not allow you to directly assess the dominance of either side.
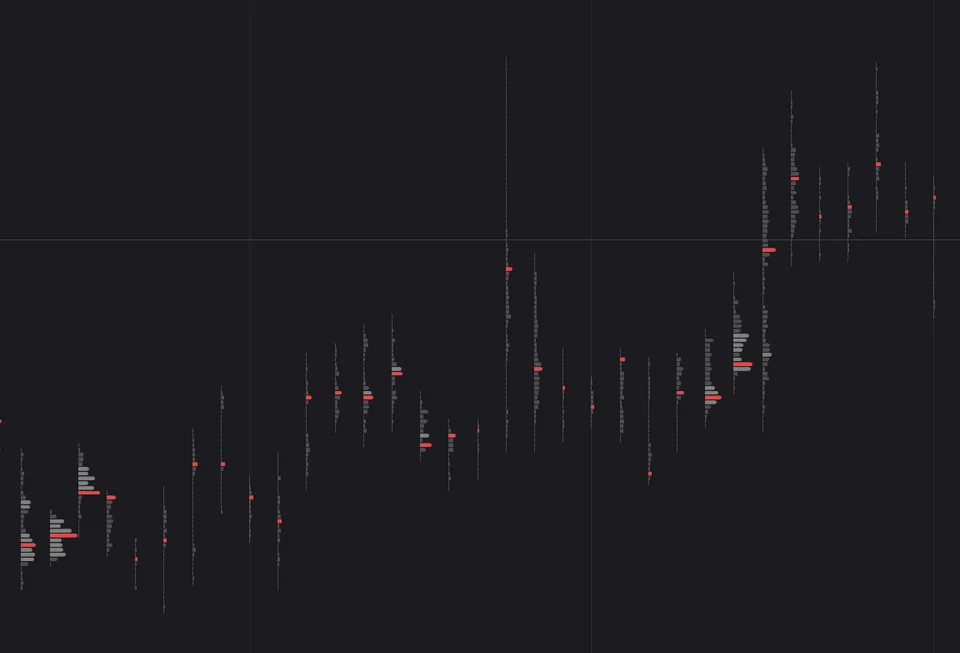
Used for:
Finding local volume peaks within a candle.
Identifying the level with the highest volume in an individual bar.
Comparing activity across price levels.
Analyzing areas where the price lingered or moved through quickly.
For example, if most of the volume within a candle is concentrated in its middle, while volume near the upper edge is significantly lower, this may indicate differences in trading intensity within the range. However, the reason for this distribution requires further analysis.
Delta — the difference between buying and selling volume
Delta is calculated as the difference between buying and selling volume according to the platform's classification rules.
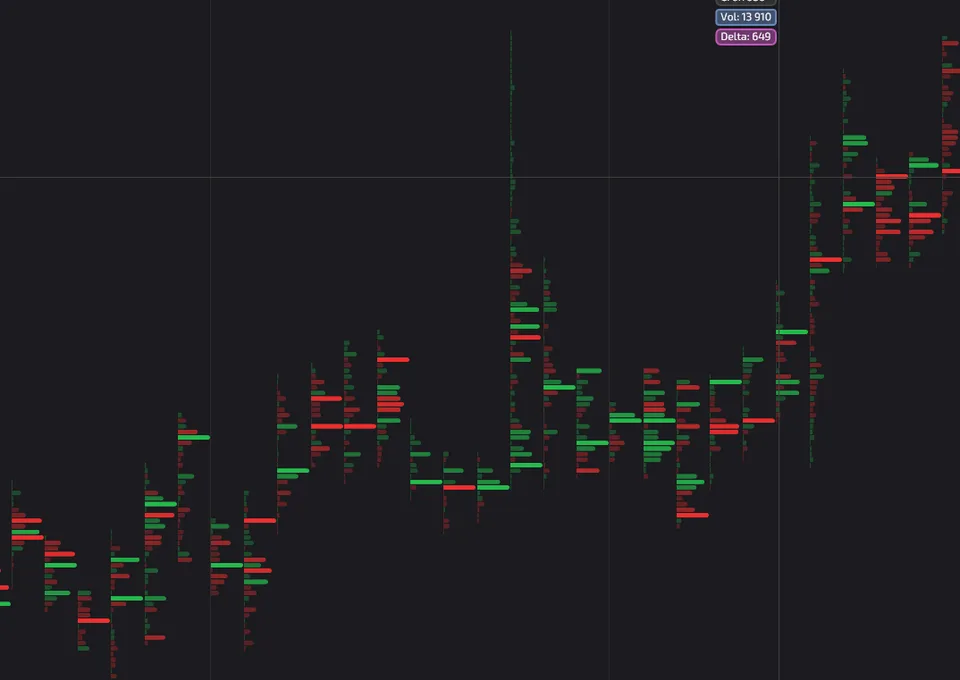
Positive Delta means that buying volume exceeds selling volume. Negative Delta indicates the opposite relationship.
In a footprint chart, Delta can be displayed at each level, as well as a total value for the entire candle.
It is used for:
assessing the predominance of buying or selling activity;
comparing the delta of adjacent candles;
looking for divergences between changes in price and changes in delta;
examining whether volume confirms a directional move.
For example, the price reaches a new high, but delta becomes smaller than in the previous bullish candle. This may indicate weakening buying activity. However, this combination alone does not guarantee a reversal.
Delta shows the difference between classified volumes, rather than the net inflow or outflow of capital from the market. Interpretation requires considering the volume size, the movement range, and the behavior of subsequent candles.
Volume + Delta — total volume with a delta indicator
Some platforms can display total volume and delta simultaneously.
This mode combines two metrics: how many trades occurred at a level and how strongly buying or selling volume predominated.
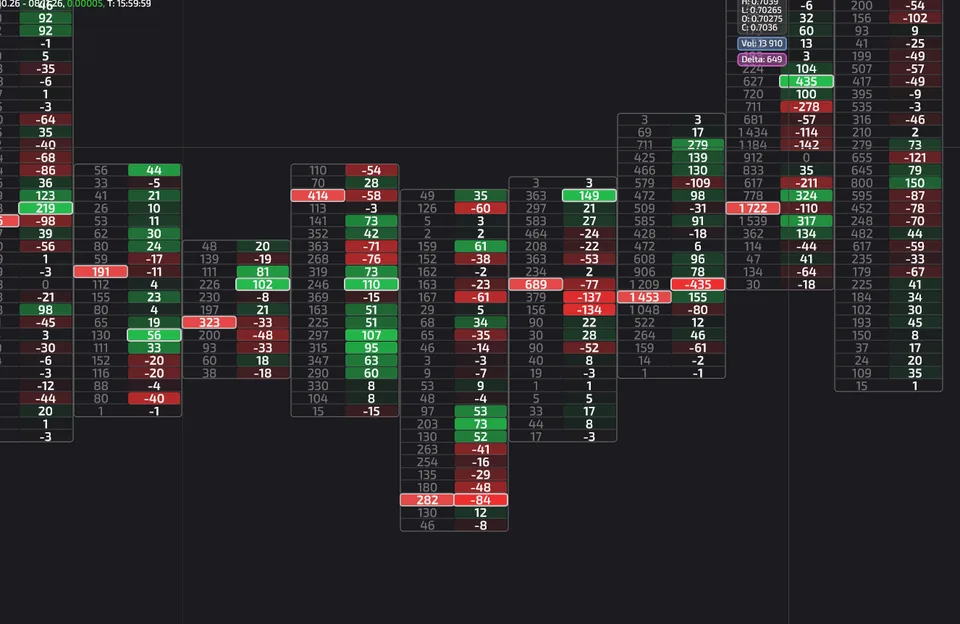
This is useful because a delta with a large absolute value can have different implications depending on the total trading volume.
For example, a positive delta of 100 contracts against a total volume of 120 contracts indicates a much stronger predominance of buying than the same delta with a total volume of 2,000 contracts.
It is used to compare trading intensity and the relative predominance of one side. The specific presentation of the two metrics depends on the platform.
Trades — number of trades
Some platforms allow you to display the number of trades, rather than just volume in contracts, lots, or units of an asset.
This is another way to assess activity: one large order can generate substantial volume but a small number of trades. Conversely, many small trades can produce a large number of executions with relatively little total volume.
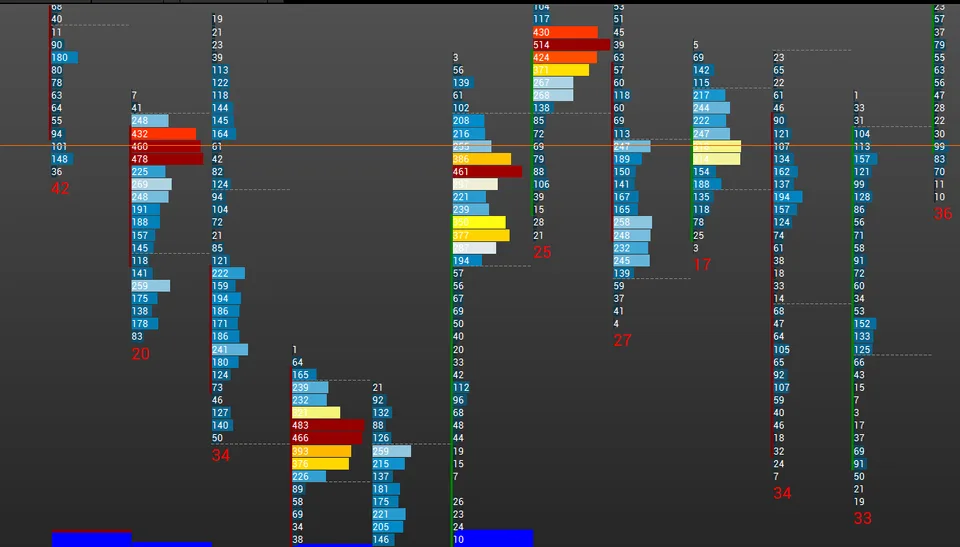
Trades mode is useful for further examination of the structure of transaction flow. But the number of trades alone does not show the direction of aggression and does not replace volume analysis.
You can find most of those indicators on TradingView.
Disclaimer
This material is for informational purposes and does not constitute investment advice.
Volume data depends on the source, calculation methodology and platform settings. It does not guarantee a particular price direction or rule out losses.