
Footprint charts and horizontal volume: how to use them together

A cluster chart, or footprint chart (Footprint), and a horizontal volume profile (Volume Profile) are two interconnected tools for volume analysis. They allow a much deeper examination of the market than a conventional candlestick chart.
Both methods show the distribution of trading activity across price levels, but use different approaches to grouping data and answer different questions.
Horizontal volume shows where the market was most active, which prices attracted traders, and where trading balance developed. A footprint chart displays the structure of individual candles: which levels saw aggressive buying or selling, where imbalances arose, and whether significant price movement accompanied the efforts of one side.
The difference between the tools is not that one shows volume while the other shows the order flow that generates volume. Thus, both work with volume data, but present information differently, expanding the possibilities for interpreting it.
What is horizontal volume (Volume Profile)?
A horizontal profile is the distribution of executed trading volume across price levels over a selected period. Instead of vertical columns below the candles showing volume over time, the trader sees a horizontal histogram aligned with the price scale.
A horizontal volume profile can be constructed for a trading session, day, week, or an arbitrary chart range. This reveals which prices saw the most trades and which levels the market moved through relatively quickly.
A horizontal volume chart has several main elements.
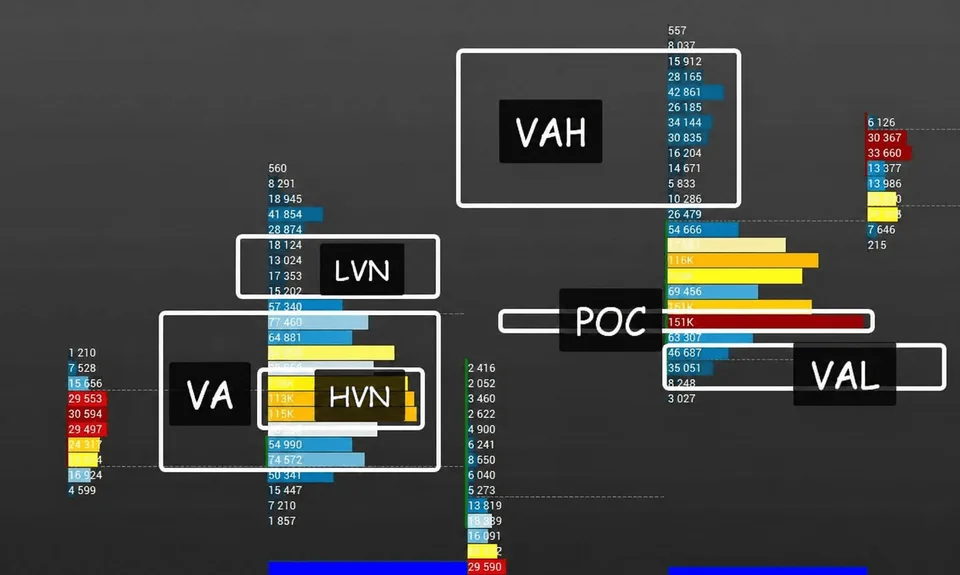
POC (Point of Control, or control point) is the price level with the highest trading volume over the selected period. It shows where the greatest trading activity was concentrated. POC is often considered a reference point for assessing market balance, but it does not guarantee that the price will hold.
VA (Value Area, or area of value) is the price range within which a specified amount of total volume was traded. A value of 70% is often used, although it depends on the indicator settings.
VAH (VA High) and VAL (VA Low) are the upper and lower boundaries of the value area, VA. They help assess the price's position relative to the main area of trading activity.
HVN (High Volume Node) is an area of elevated volume (balance) where the market actively exchanged positions. Such areas may correspond to zones of price acceptance and consolidation.
LVN (Low Volume Node) is an area of reduced volume (imbalance). It may indicate prices where the market did not linger. When moving through such an area again, the price sometimes passes through it faster, but this depends on current order flow and market conditions.
A horizontal volume profile shows where and when trading activity was high or low.
Horizontal volume alone does not show why it arose or which side controlled trade execution at a particular profile level. High volume may accompany either a continuation of movement or the absorption of aggressive participants by the opposing side.
Horizontal volume indicators
Depending on the task, a trader can use different construction methods. Names may differ substantially across trading platforms, but the underlying logic remains the same.
Volume Profile (VP) is the classic horizontal volume indicator. It constructs an overall profile for the period selected in the trading platform.
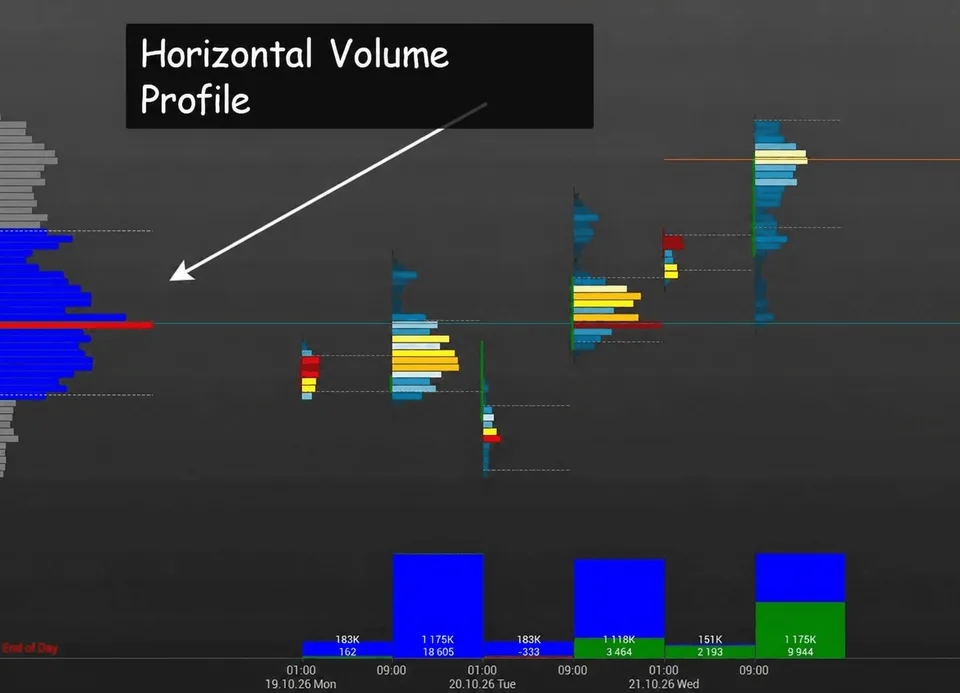
One variation of the classic volume profile is Volume Profile Visible Range (VPVR), which recalculates data in real time when scrolling, zooming the chart, or changing the timeframe. This allows volume analysis specifically for the section currently visible on the screen.
Fixed Range Volume Profile calculates a profile for a manually selected range. It is suitable for analyzing a particular impulse move, consolidation, or completed trading session.
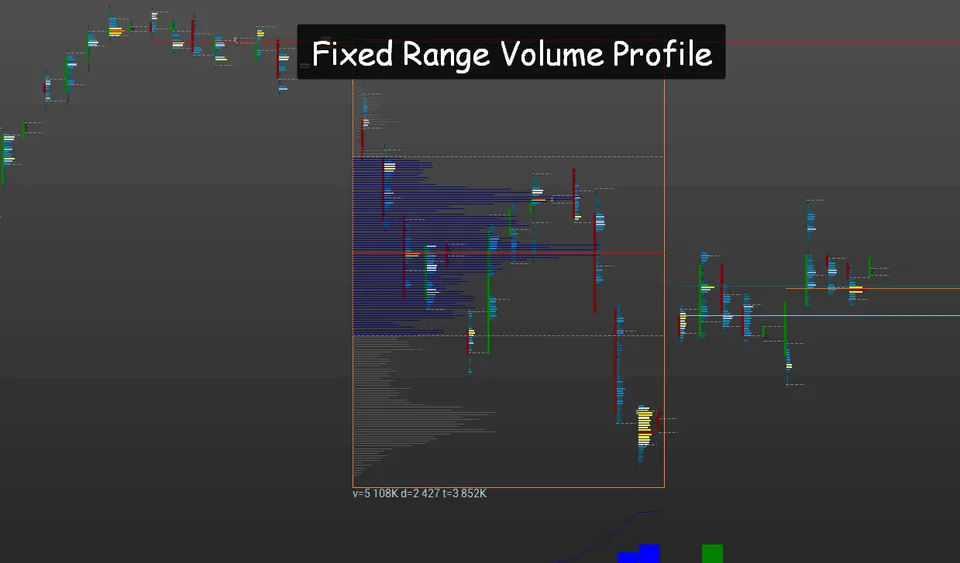
A variation is Auto-Anchored Volume Profile, which automatically selects a construction anchor according to the logic of the particular indicator. This allows volume analysis from a significant historical event or another specified anchor.
Periodic Volume Profile constructs separate profiles for specified periods, such as each day, week, or month. Essentially, these are profiles of a second timeframe, meaning a higher timeframe relative to the working chart.
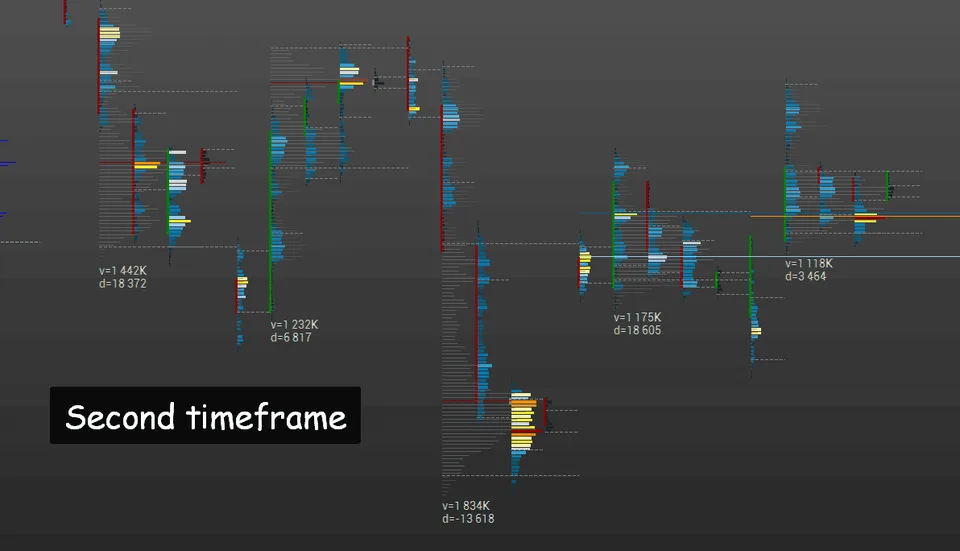
One important variation of the second-timeframe profile is Session Volume Profile. The indicator shows the distribution of volume over a trading session. It allows sessions to be compared and levels around which the daily balance formed to be identified.
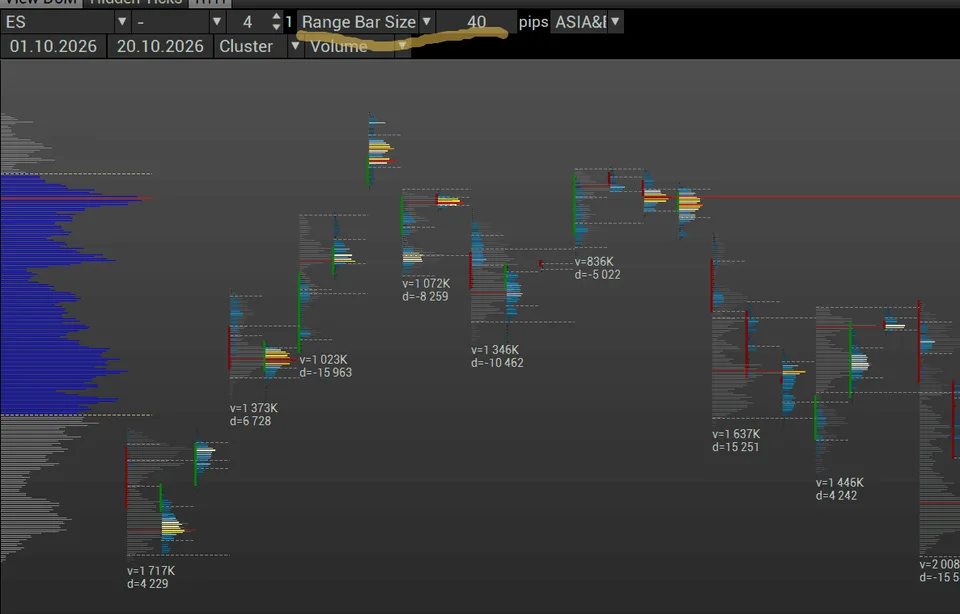
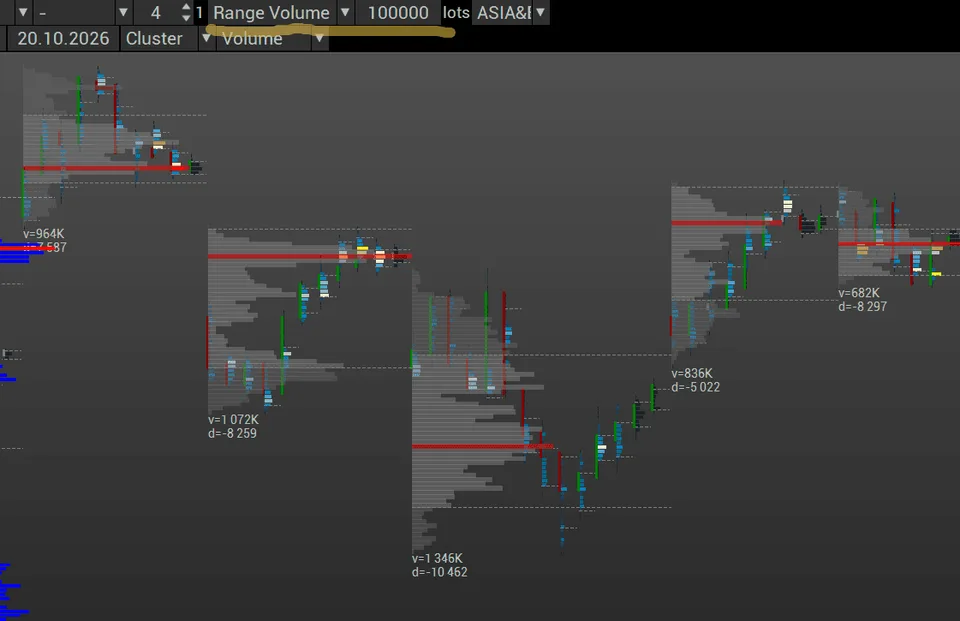
Professional construction options include range bar size (constructs a profile for a range, for example, 40 points), range volume (constructs a profile for a specified volume, for example, 100,000 contracts), and so on.
What is a cluster chart (footprint)?
A cluster chart is a way of displaying trading volume at individual price levels within each candle. Unlike a conventional chart, where a candle combines price movement over the entire period, a footprint reveals its internal structure.
A cluster, in turn, is an element of a footprint containing volume data at a particular price level. In essence, a cluster is a level in a horizontal volume profile, but more on that later.
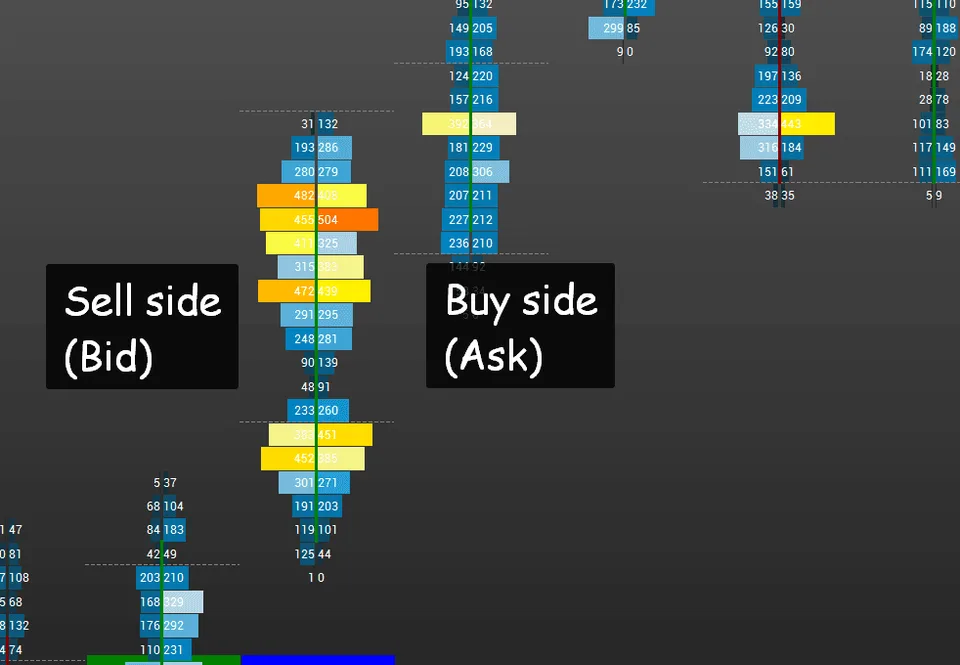
In the classic presentation, bid-ask volume is shown as two values at each price level:
Bid Volume is the volume of sales executed at the Bid price, meaning when aggressive sellers (immediate market sells) open positions at the best available buy price (limit orders).
Ask Volume is the volume of purchases executed at the Ask, when aggressive buyers (immediate market buys) purchase the asset at the best available sell price (limit orders).
As a result, the trader sees not only total trading volume but also its distribution between aggressive buyers and sellers at each level within the cluster.
Implementation details need to be considered. Not all platforms classify volume in the same way.
For example, Footprint on TradingView uses the direction of price movement (tick movements) on lower intrabar intervals to divide volume into buying and selling. Therefore, this measure is not always identical to classifying trades directly by Bid and Ask.
Main elements of a footprint:
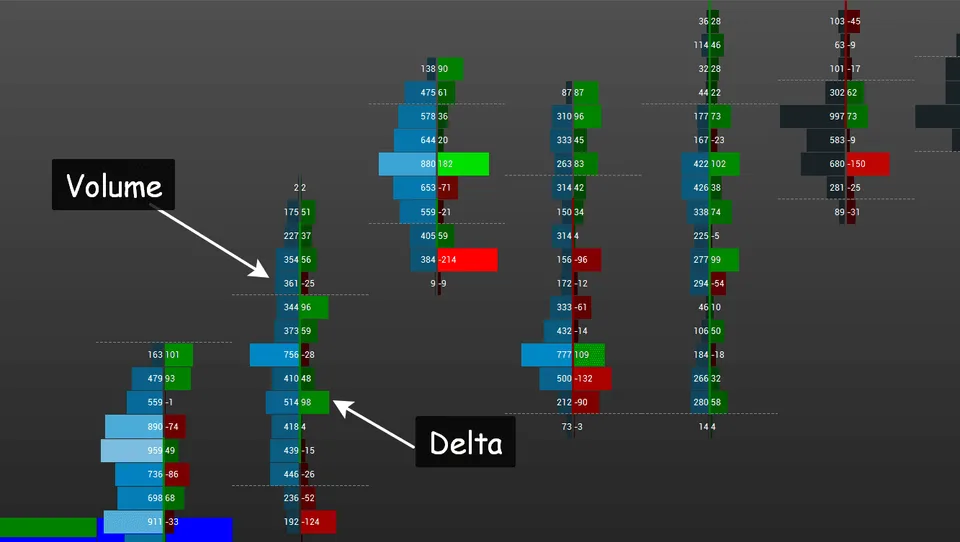
Delta is the difference between buying and selling volume in the selected breakdown. Positive delta indicates a predominance of classified buying volume, while negative delta indicates selling volume.
Imbalance is an imbalance between buying and selling volume at the price levels being compared within each cluster. Several consecutive imbalances with a substantial delta advantage constitute a strong signal.
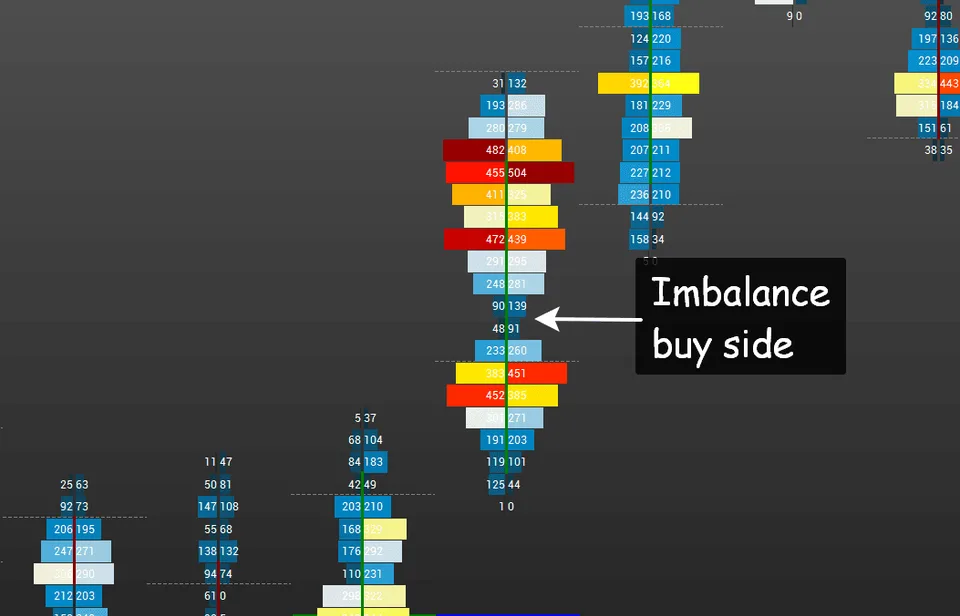
Cluster POC is the level with the highest volume within a range on a cluster chart (a candle in technical analysis). It does not necessarily coincide with the profile POC for the entire session or selected range.
Absorption (absorption) is a situation in which significant aggressive volume from one side does not result in the expected price progress. For example, sellers sell actively, but the price stops falling. This may indicate opposing limit demand absorbing the selling flow. However, high volume alone is insufficient to confirm absorption: the price response must be analyzed both immediately and after some time.
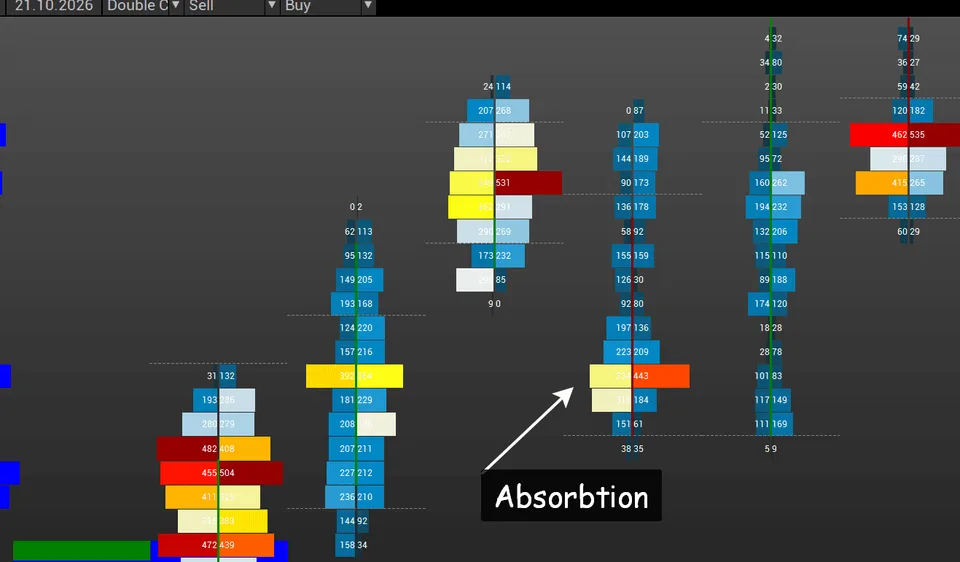
Thus, a cluster chart helps reveal the distribution of buyer and seller activity in each price cluster and the price response to that activity.
Main indicators for cluster analysis
Bid × Ask. Shows volume classified as selling (Bid) and buying (Ask). It helps investigate which price levels were dominated by seller or buyer aggression. The specific classification method depends on the platform and available data.
Volume. Displays total trading volume at each price level within a candle. It allows local concentrations of activity to be identified regardless of how strongly one side predominates. Essentially, this is a classic horizontal volume profile.
Delta. Shows the difference between buying and selling volume according to the calculation method. Positive delta means classified buying volume predominates, while negative delta means selling volume predominates.
Imbalance. Highlights levels where the volume of one side substantially exceeds that of the other according to a specified criterion.
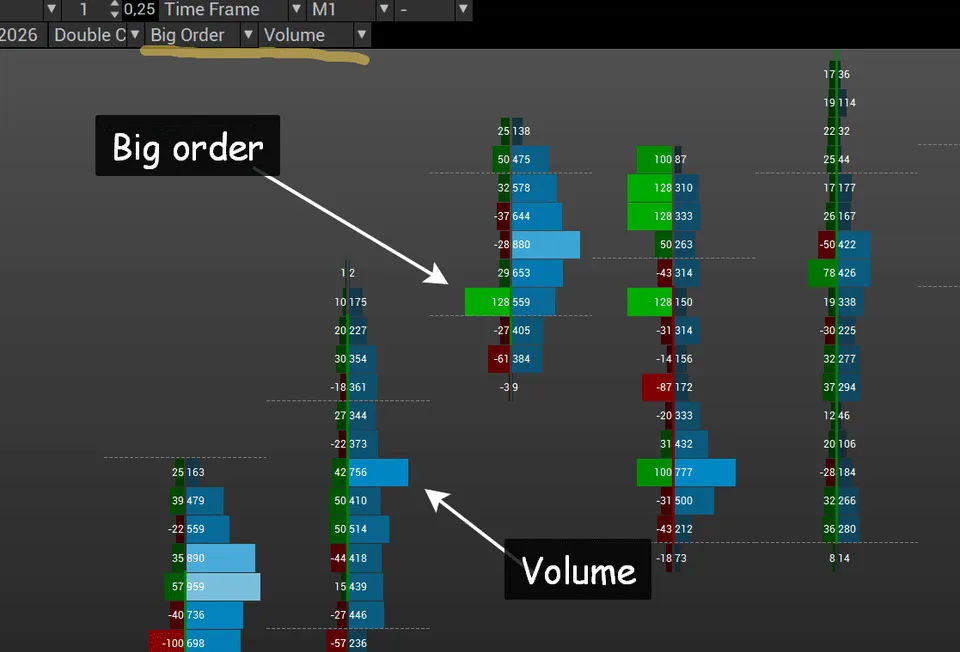
Modern indicators allow more specialized cluster charts to be constructed. For example, the chart below shows the largest order in the cluster on the left and total volume on the right.
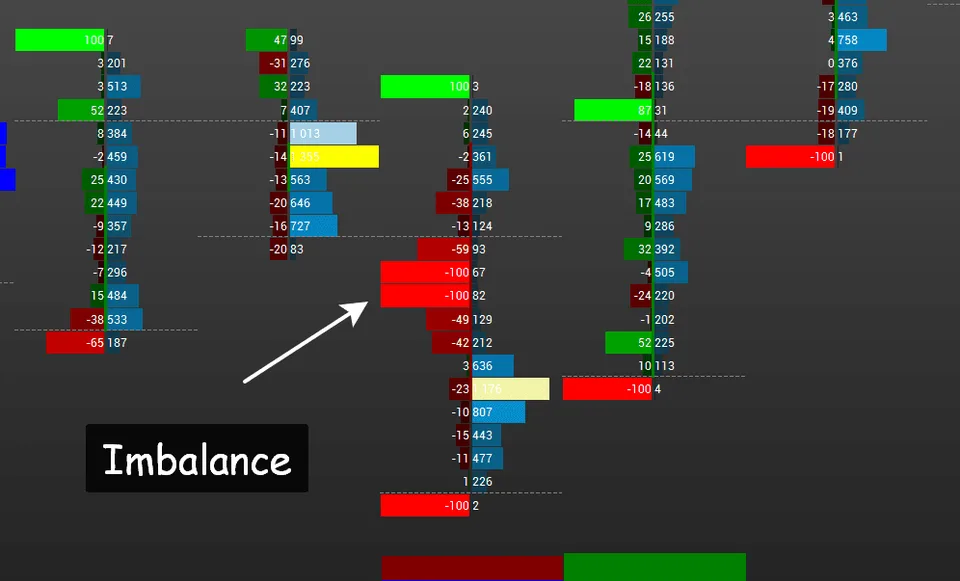
To find imbalances, a cluster can be constructed with total volume on one side and delta percentage on the other. An imbalance is a situation where, with relatively low volume in the middle of a cluster or between two clusters, the delta percentage reaches its maximum value.
The names of indicators and calculation algorithms may differ across trading platforms. In particular, most indicators on TradingView offer Buy and Sell, Delta, and Total modes, as well as Cluster and Profile display options. The latter determine the visual presentation of cells rather than replacing the horizontal profile for the entire selected period.
Using footprint charts and horizontal volume
Differences between clusters and a horizontal volume profile
The table below presents the main differences between a horizontal volume profile and a footprint.
Parameter | Horizontal volume | Footprint |
|---|---|---|
Scope | Higher timeframe (session, day, week) or selected range | Individual candle or bar |
Level of detail | Volume by price level over the entire period | Volume at each price within each bar |
Main information | Concentration of trading activity | Distribution of buying and selling volumes in each cluster |
Key metrics | POC, VAH, VAL, HVN, LVN | Bid/Ask, Delta, Imbalance, bar POC |
Main task | Find significant price areas | Investigate participants' responses at specific levels |
Practical application | Finding levels, identifying areas of interest, range boundaries | Analysis of breakouts / bounces, absorption, and local imbalance. Entry/exit points. |
The fundamental difference lies in data aggregation.
In a horizontal profile, volume from all the candles under consideration is combined at matching price levels. A footprint preserves the volume distribution separately for each bar.
Therefore, two different price movements can produce similar horizontal profiles while having completely different structures within the candles. Conversely, several candles may show a pronounced buying or selling imbalance even though the profile for the entire session still looks relatively balanced.
How to use them together
In practice, a horizontal volume profile is more convenient for identifying an area where the price should be watched closely, while a cluster chart is useful for studying the market's response as it approaches that area.
1. Finding an entry point at a range boundary
Suppose the price is moving within a sideways range. A previously formed area of elevated volume lies at its lower boundary. When the price returns to this area, the profile alone cannot establish whether buyers will defend the level.
A footprint helps assess what is happening.
If sellers continue selling aggressively but the price stops falling, there is reason to test the hypothesis of selling absorption. If the price then starts moving upward, this behavior strengthens the case for a possible bounce.
If, however, the selling imbalance is accompanied by a sustained price decline and the market establishes itself below the area, the assumption that the level will hold weakens, and a genuine breakout can be expected.
The same applies to buying.
2. Analyzing price range expansion
A price move beyond the value area (VA) or another significant volume profile level does not necessarily mean the start of a new trend. The price may only briefly move beyond the range boundary and return, taking buyers' and sellers' liquidity.
A footprint allows the nature of the expansion to be examined.
Consecutive buying imbalances combined with an expanding price range may indicate buyer initiative. But if a large volume of market buys cannot push the price higher, an alternative scenario needs to be considered: limit sellers may be absorbing the buying.
Confirmation should be sought not only in delta but also in price behavior after the breakout: whether the new level holds, whether the price returns inside the range, and whether the move continues.
3. Analyzing areas of elevated and reduced volume
HVN and LVN allow areas where price behavior may differ to be identified in advance. In an elevated-volume area, the market previously traded actively, while a reduced-volume area has a lower concentration of executed trades over the selected period.
When the price approaches an HVN again, a footprint helps determine whether a price pause is accompanied by opposing aggression or whether the market continues through the level without pronounced resistance.
As the price moves through an LVN, it is possible to observe whether it accelerates, whether imbalances arise, or whether the movement fades. Low horizontal volume in a cluster does not mean there is no current liquidity: resting limit orders may change the nature of the move, or aggressive participants' liquidity may run out within the double auction, stopping the movement.
Limitations
Both tools have limitations.
First, trading volume is not the same as liquidity. A volume profile shows trades that have already been executed, while a footprint analyzes their distribution within bars.
Neither tool alone shows the volume of current unfilled limit orders in the depth of market (DOM).
Second, data quality matters. On centralized exchanges, the volume of a particular trading instrument can be analyzed using data from the relevant venue. In the decentralized Forex market, there is no single consolidated volume covering all trades. Individual brokers' charts may use tick volume or data from a specific provider, so the data may differ.
Third, construction parameters affect the picture. Changing the trading session, profile period, price row size, or volume classification method can change the appearance of levels and the indicator readings.
Finally, positive delta does not guarantee a price rise, and negative delta does not guarantee a decline. High volume may indicate either initiative from one side or opposing execution that prevents movement. Data should be interpreted in the context of price structure and the market's response.
Disclaimer
This material is for informational purposes and does not constitute an investment recommendation.
The interpretation of volume data depends on the instrument, data source, and platform settings. Volume Profile and footprint chart readings do not guarantee a particular price direction or rule out losses.