
Global Markets During Turbulence. Part 1.

The TLAP team returns with a global financial markets overview in a new format.
Previously, we analyzed the trading activity of large capital on the Binance cryptocurrency exchange (BTC / ETH / SOL) and the CME exchange (US equity futures ES, NQ, YM), but now the decision has been made to expand the list of instruments to include futures on oil, wheat, the dollar index, $10-year bonds, and other assets.
Why? Because turbulence is mounting in financial markets, while at the same time the world is on the brink of an unprecedented crisis—an energy crisis and, quite possibly, a food crisis.
Today we will discuss paper WTI crude oil (CL futures), paper gold (GC futures), and digital gold (BTC).
Incidentally, there is a reason I emphasize that these assets are “paper.” The reason is simple: in these difficult times, the spot price of oil has not exactly broken away from the paper price, but the paper price certainly no longer reflects the real market.
The situation with gold is a little easier, but demand for physical metal continues to grow, which means that we may soon see paper and real gold prices diverge as well.
CL Futures
Oil (WTI and Brent) is one of the market's most interesting assets today. The author happens to be more familiar with CL crude oil, so that is what we will discuss.
Not long ago, I discussed the crack spread—give it a read; it is interesting. The prospects for CL futures were examined at the end of the article.
The model implies a probability of more than 80% of moving farther north. Moreover, the $86.5–$93.5 range could be crossed in 1–2 weeks during the first half of September. Right now, the annual average VWAP is being carefully broken through. A breakout of the average VWAP means a target at the +1 deviation and beyond. This implies entering the $100–$105 range, where the upper boundary of the annual value area is also located. This is where the quote's future direction will be decided. Nevertheless, the real structural oil deficit is not going anywhere, so a continued move north can be expected. Unless US banks intervene again with their limits to restrain the exchange-traded price.
Market participants played out the scenario exactly as the volume model implied. Events unfolded rapidly, but within the timeframe under discussion.
The $86.5–$93.5 range was crossed easily during the first week of September. The second week was spent reaching $104.5, effectively the upper boundary of the $100–$105 range. The quote closed the week at around $100, i.e., at the lower boundary of the $100–$105 range and at the +1 deviation of the annual VWAP.
What comes next? There are several options, and they are fairly obvious.
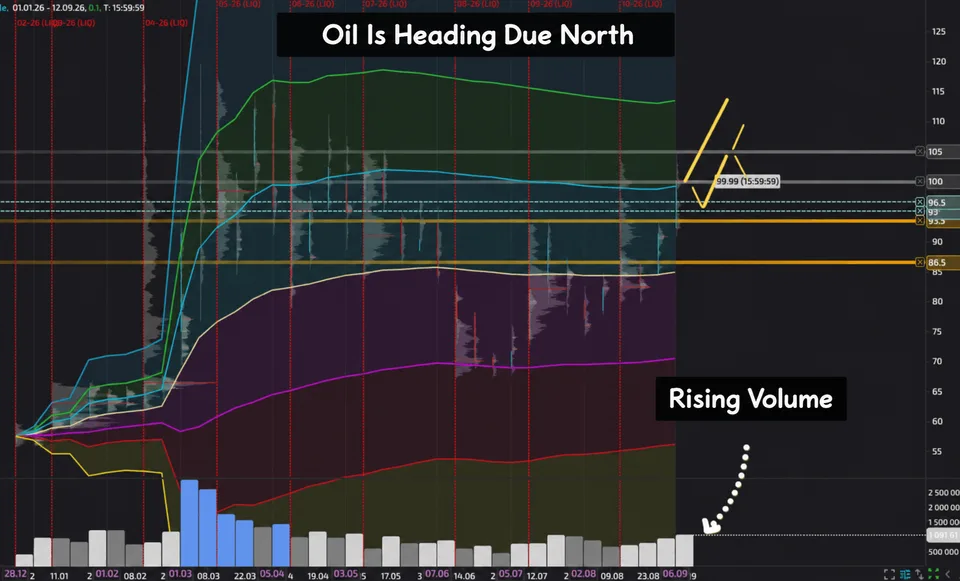
Aggressive growth from the weekly open. It could begin either from $100 or after touching $99. Targets are around $110 and even $115.
Consolidation. This implies a pullback to the upper or lower boundary of the $95–$96.5 range, followed by growth toward $105.
In other words, market participants are most likely ready to test the +2 deviation of the annual VWAP (around 115), either immediately or after consolidation. This is indicated by both the increase in trading turnover and the aggressive rise in the quote itself.
I have shown the model here in the broadest strokes on the weekly chart.
Before discussing the lower timeframes, here are a couple of developments from the real world.
A Little Geopolitics
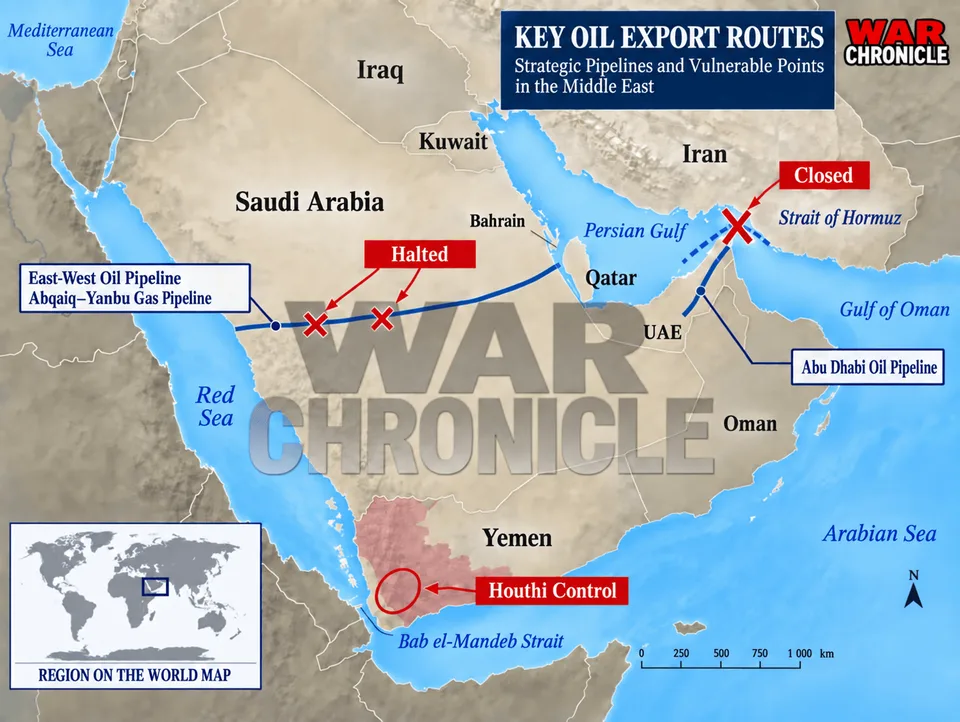
The turmoil involving Iran led the Saudis to redirect a significant portion of the flows lost from the Strait of Hormuz toward the Bab el-Mandeb Strait.
As soon as the flow was established, the Yemeni Houthis, who are actively supported by Iran, entered the game in full force.
It reached the point where US Central Command (CENTCOM) commander Admiral Brad Cooper urgently traveled to Saudi Arabia to help address the new problem. At the same time, Saudi Crown Prince Mohammed bin Salman called Donald Trump twice during the past week with insistent proposals for the Americans to launch airstrikes against the Houthis. But Trump reportedly refused. Axios says it was because he did not want to aggravate the situation. Perhaps.
Events are unfolding so rapidly that on September 12, Ansar Allah political bureau member Hizam al-Assad told RIA Novosti that they had taken control of every city near the Bab el-Mandeb Strait and the western coast of the Red Sea. Whether this is true will become clear only after our overview is published.
In any event, below is a map from the area. According to the Houthis, they are allowing every tanker except Saudi ones to pass. But the situation is tense.
Meanwhile, Bloomberg also “delighted” global markets with a report that the US administration is considering halting exports of petroleum products to global markets.
Could my expectation of oil at $115 be too conservative? Perhaps. Or perhaps another verbal intervention from Trump, saying that peace with Iran is close and will come immediately after the midterm elections, will work.
Lower Timeframe
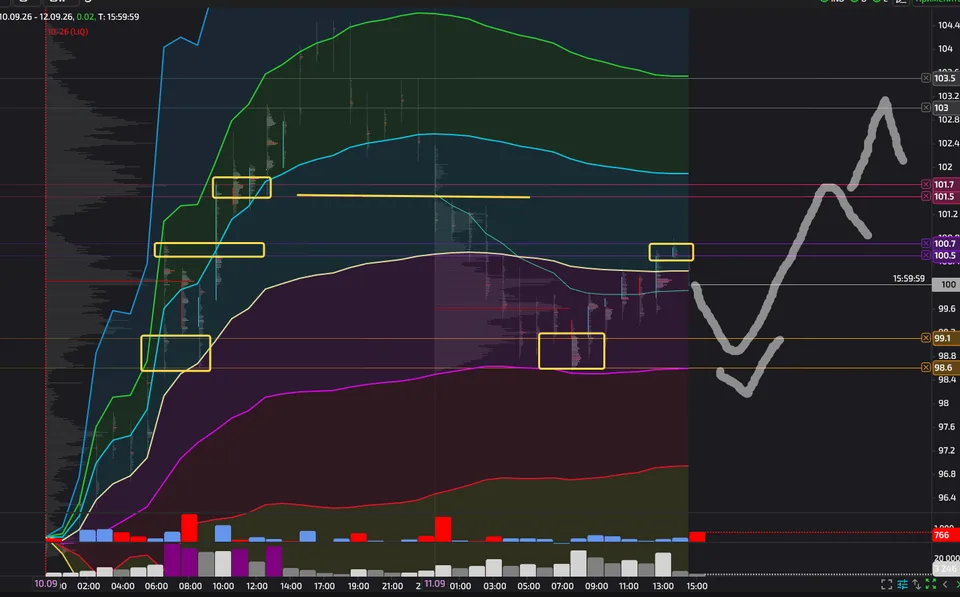
A fixing model formed on the lower timeframe, with an extreme printed on Thursday. However, it is also an FVG model, i.e., the trading of Thursday's imbalance, which in turn represents the passage through the same $100–$105 range discussed above.
Overall, Thursday's final purchases began in the $101.5–$101.7 range. Buying continued almost to $103. Everything above that was activity before and after clearing and a low-liquidity play.
Although, if postmarket liquidity is taken into account (call it Asian liquidity), the first short was formed at $103–$103.5. Then... And what happened next is not interesting, because the quote simply declined as part of a pullback.
Buyers became active in the $98.6–$99.1 range and dragged it to $100.50–$100.70, where Thursday had an imbalance toward $101.50 and beyond.
For context, I will show only the RTH chart constructed around US exchange trading hours. It is not the most informative chart for oil, but pure US-session activity still needs to be monitored. On Friday, the US session opened at the same level as Thursday's low.
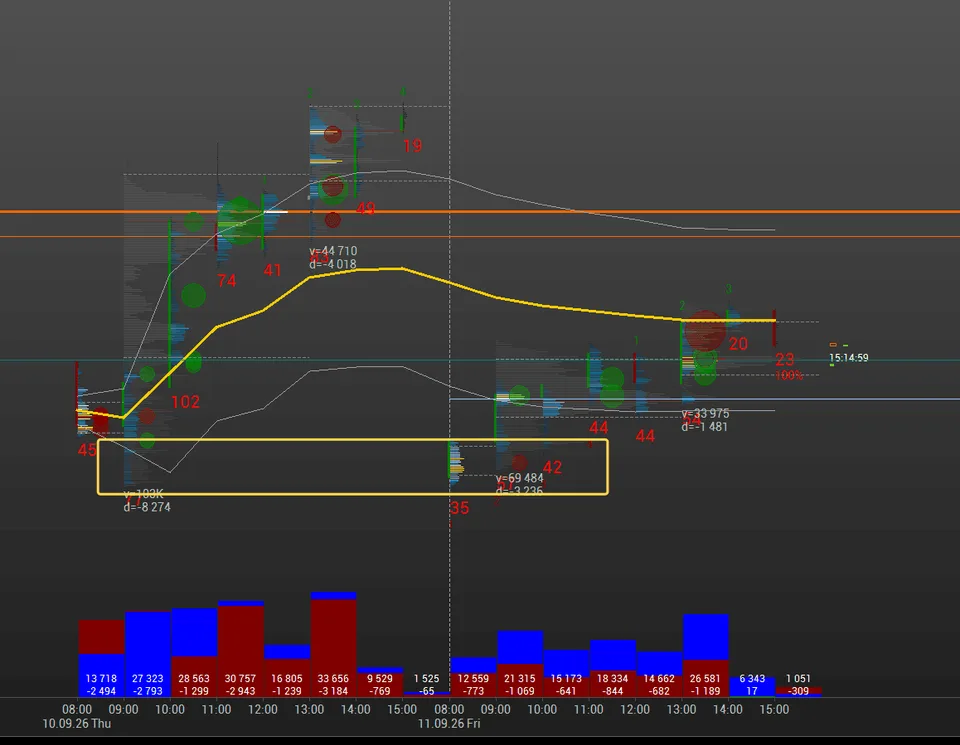
They bought the dip and traded carefully within an ascending balance. Classic.
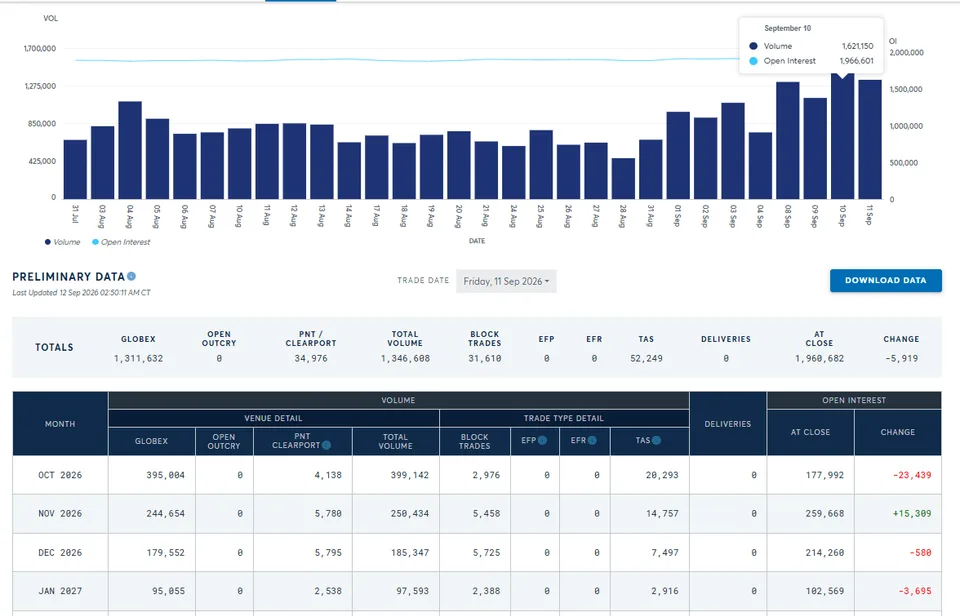
Before concluding the oil overview, let us see what is happening with open interest.
And the situation with open interest is quite interesting. It began rising during the week and reached its highest values in a month. Hot speculative liquidity is actively entering the instrument. They are waiting for something.
As a summary, another self-quotation:
... entering the $100–$105 range, where the upper boundary of the annual value area is also located. This is where the quote's future direction will be decided.
The sharp increase in open interest confirms what was already clear from examining the volume model.
Paper Gold
There is an amateur opinion that gold market participants still cannot decide what they want. We confidently maintain that speculators decided long ago what they want from the instrument: money, lots of money.
If there is no one-way momentum, daily moves of $100 suit everyone just fine. Of course, the depth of market (DOM) is frightening to look at: gaps of 2–5 ticks, but who cares when 1,000 ticks a day are at stake?
First, let us look at the bigger picture. For almost a year now, gold buyers have maintained a platform in the $3,980–$4,150 range. This is where the move toward 5,400+ began.
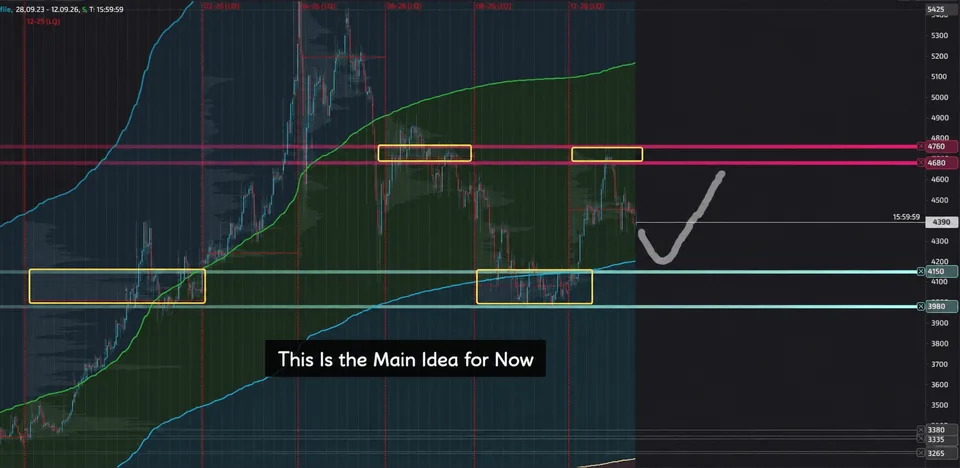
During the second half of June and in July, the $3,980–$4,150 range served as an area where buyers calmly absorbed sellers before moving directly to the $4,680–$4,760 range during August.
What is the $4,680–$4,760 range? It is the area where sellers were most active in March–April.
Overall, we are observing a typical balance (also called a corridor or consolidation). That being the case, it is reasonable to expect some kind of test of the upper boundary of the $3,980–$4,150 range, perhaps even a speculative breach, but nothing more.
The next step is once again toward the $4,680–$4,760 range. Once there, we will see what appears on the horizon: 5,200+ or a return closer to approximately $4,100.
Let us examine why gold could very well move downward without bringing the liquidity placement model into the discussion. What might give us a clue? Expectations for the Fed's interest rate.
The Fed meeting will take place very soon, on September 16. As of Friday's market close, a full 87.3% of investors expect the rate to rise by 250 basis points: from 350–375 to 375–400.
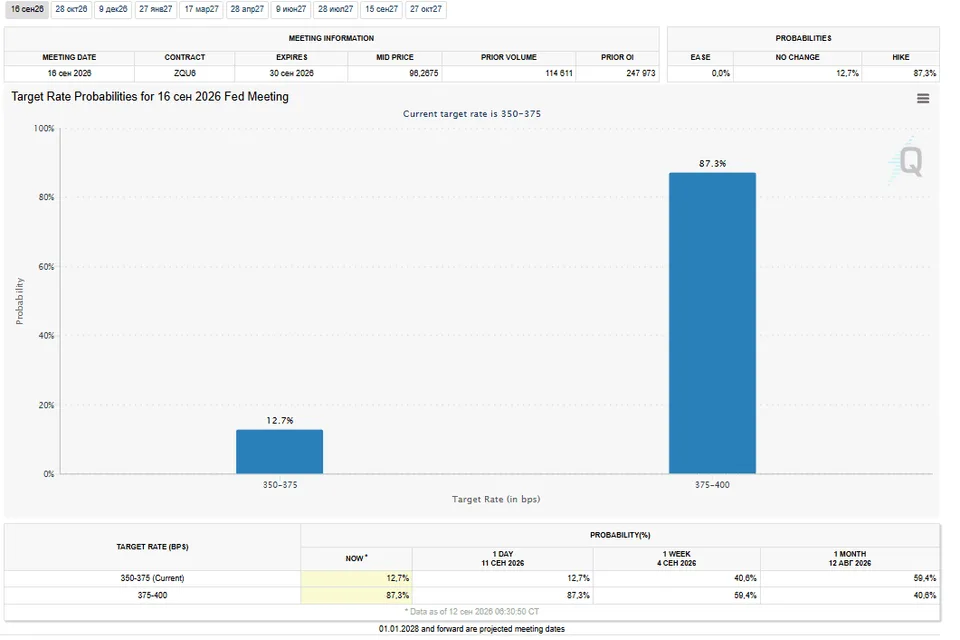
When rates rise, investors usually move capital into bonds, including capital from gold. We will not discuss bonds today, but let us accept the conventional view.
Digital Gold
BTC has come to a complete standstill below the $81,900–$85,300 range.
The $81,900–$85,300 range is the resistance area I discussed in great detail in the extensive quarterly Bitcoin overview. A week has passed since then, and nothing has changed.
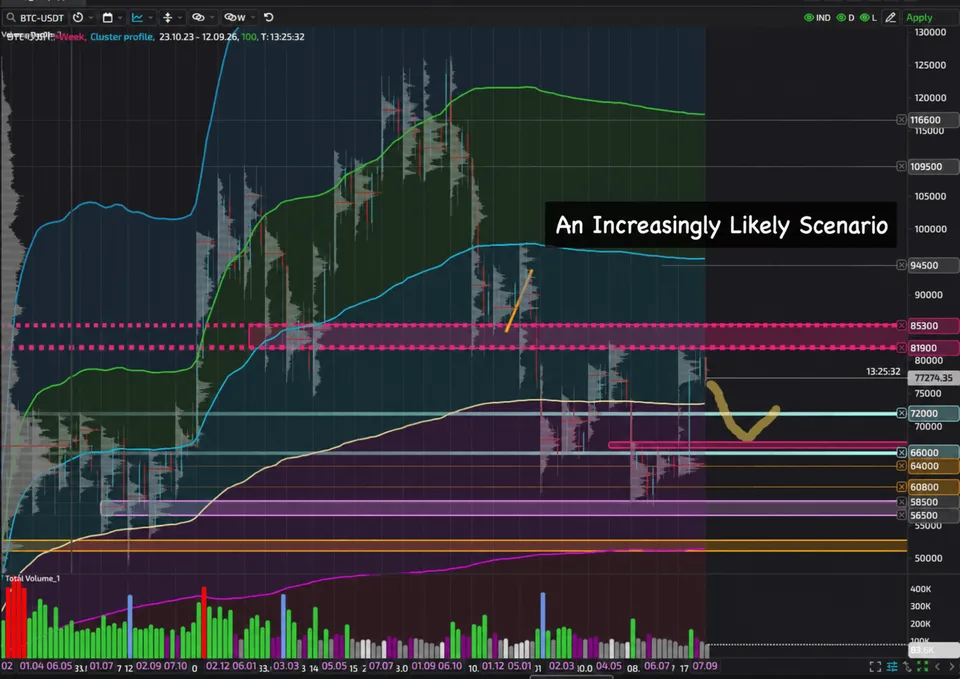
Except that expectations of a rate increase have risen by almost 30% over the week. A high interest rate is negatively correlated with expensive crypto.
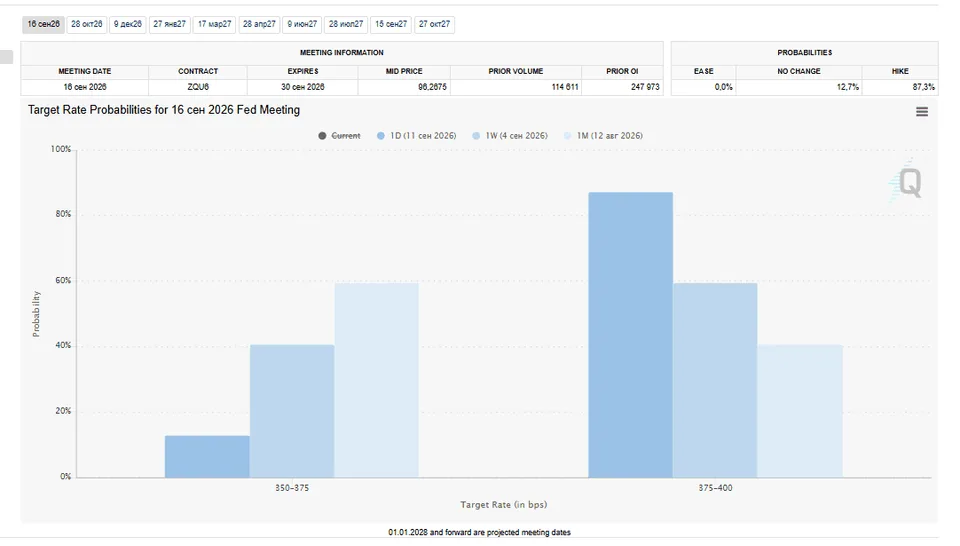
That being the case, the increasingly likely play is a return somewhere into the $66,000–$72,000 range.
Conclusions
Next week brings the Fed meeting, which is expected to result in a 0.25% rate increase. Rate increases generally do not support growth in paper or digital gold, which means they have room to move south while trading within their respective balances.
As for oil and petroleum products more broadly, the markets are extremely tense and unbalanced. Growth remains the priority, possibly after consolidation.
That is the whole story for today.