
BTC to the Moon: What If It Doesn't Happen? Scenarios and Risks

For the third week now, the main market narrative has been crypto to the moon.
Naturally, Bitcoin, where capital has been invested both through ETFs and directly, is expected to pull the entire market along with it. The TLAP altseason index clearly indicates this.
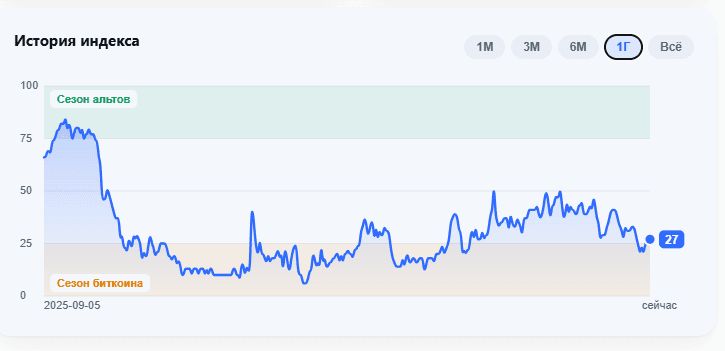
But dear crypto enthusiasts, let us assess the risks of this scenario being invalidated. You never know: after all, cryptocurrencies are deeply secondary to the main financial instruments. They directly depend on the availability of free—specifically free—liquidity in the global financial system.
Yes, we are talking about several billion dollars, but these must be billions that, very loosely speaking, investors “would not mind losing.” Is there much free money like that now? Exactly.
To begin, let me recall the conditions under which we can truly speak with confidence about a solid bullish scenario.
Factors confirming a new cycle The formation of a new bullish trend may be confirmed by the following indicators: Sustained consolidation above 100,000 A breakout above the all-time high of 126,000 Growth in trading volume Increased inflows into Bitcoin ETFs Thus, the current market situation is characterized by uncertainty about the direction of the next move. To produce a final forecast, it is necessary to monitor the dynamics of breakouts above key resistance levels when supported by fundamental factors. It is important to note that continued positive momentum under the stated conditions may indicate the beginning of a new bullish cycle in the cryptocurrency market.
None of these conditions has been met. The only exception may be the flow of funds into ETFs that we can see. But the confidence does not look particularly convincing. ETF inflows are not as strong as they were in previous periods. And they seem to have slowed down.
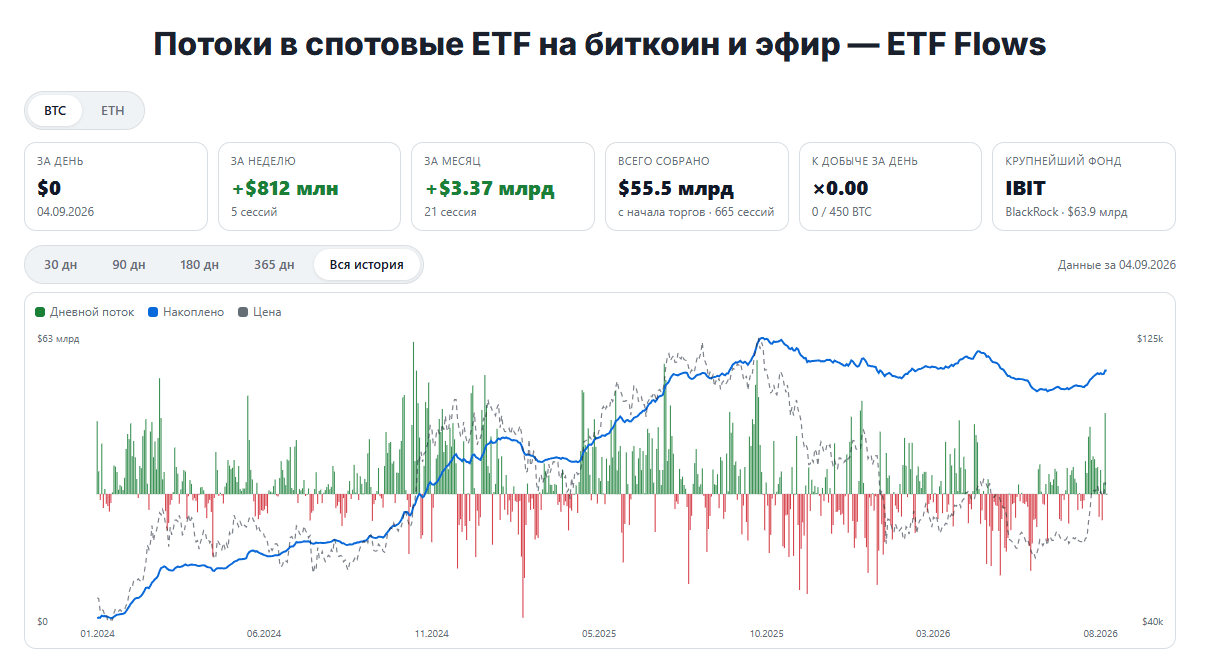
So let us try to view this entire Bitcoin story through the lens of a bearish scenario.
Analysis of the Previous Forecast
Let me clarify at once that a severe bearish scenario is not currently the priority. Although in early June 2026, I assumed that the bearish scenario had a slight priority.
Main scenario—a decline toward 50,000 The first main scenario is an accumulation of volume in a range no higher than 64,000. This scenario implies a sharp move below $60K in the second half or final ten days of June through the first half of July. This scenario could unfold in two ways. The first option involves holding the $64,000 area before a further collapse. The second is a price test of $65K–$66K without consolidation above $67K. Both downside scenarios imply a test of $60K–$65K from below. If the test from below reaches the upper boundary of the range, the decline may be smoother and include pullbacks, whereas a rapid test of the lower boundary would make the decline more impulsive. Highly alternative scenario—a return above $67,000 The second global scenario for the coming quarter implies a return to the $66,000–$72,000 accumulation zone. This scenario could develop in two ways: either the local bottom is pushed down as far as $57,000 followed by a sharp recovery, or there is an upward jump from $59K–$60K, which is extremely unlikely. Consolidation above 67,000–68,000 on the daily timeframe would be the marker for this scenario. Subsequently, this scenario implies prolonged trading in the $66,000–$72,000 range for 2–3 months, followed by a new bifurcation point.
BTC Auction Volume Model
We will discuss the volume model on weekly cluster charts.
Once again, let me clarify that the model's realization implies a certain probability of it playing out. One factor is time. In the previous review, I indicated that the timing for entering a short position was no later than early July; otherwise, questions would arise.
And yes, here is the ETF flow chart again. It was precisely in early July that tentative inflows began.
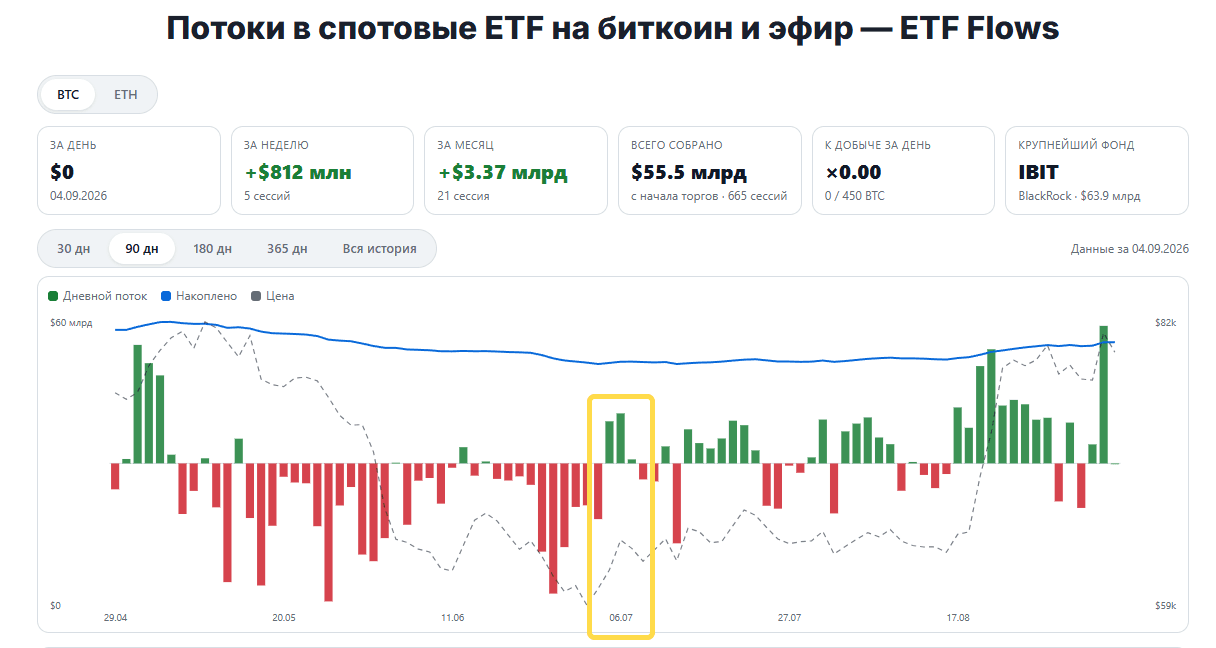
This means that investors, like me, expected a possible bearish strike, if it happened, to occur by early July. When it became clear that no one was crashing BTC, large speculators began cautiously moving money into ETFs.
The bearish scenario requires certain conditions to be met, just like the bullish scenario. More on these conditions below. First, let us examine the scenario of a return to the balance area—the value area—of recent months.
Let me remind you of the volume-level markings on the weekly chart. I have not changed them since the previous review.
Auction History in the $81,900–$83,500 Range
The first key resistance lies in the $81,900–$83,500 range. It was formed by liquidity placed in March–April 2025.
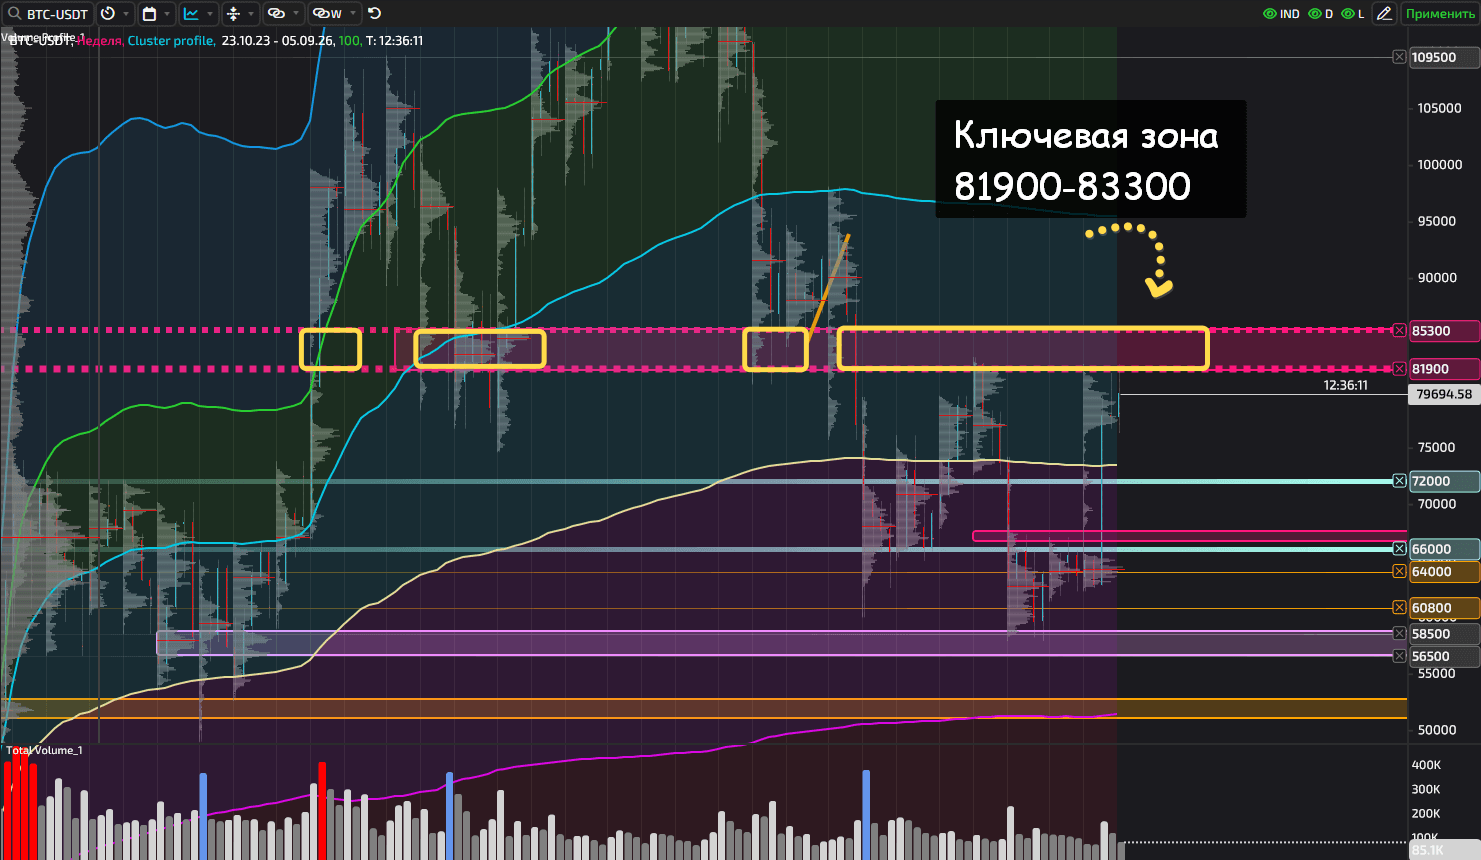
At that time, this liquidity was clearly bullish and represented the closure of an FVG imbalance. Everything was just as described in the textbook and our article.
Later, in December 2025–January 2026, this liquidity—or the range where buying had once occurred—served as support.
A sharp breakdown below the $81,900–$83,300 range marked the definitive collapse of the upward structure. This is a common development known as repositioning: support becomes resistance and vice versa.
Later, in late April 2026, the $81,900–$83,300 range was tested from below, followed by another drop and then a brief break below the bottom in the first ten days of May.
At the time, I, along with the market, assumed that the short move could continue because liquidity was accumulating below the $66,000–$72,000 range. And that is a very strong signal that the bearish scenario may continue.
At that point, only time—heh-heh—could affect the shift in priority. And as I showed above, it ultimately did.
The Current Auction Near the $81,900–$83,300 Range
Throughout the second half of August 2026, Bitcoin's price remained below the range under discussion.
The breakout week was genuinely strong—169,000 coins. Here and below, the figures are Binance statistics for the BTC-USDT instrument. Volume was at its highest since the first week of June, when nearly 232,000 BTC changed hands.
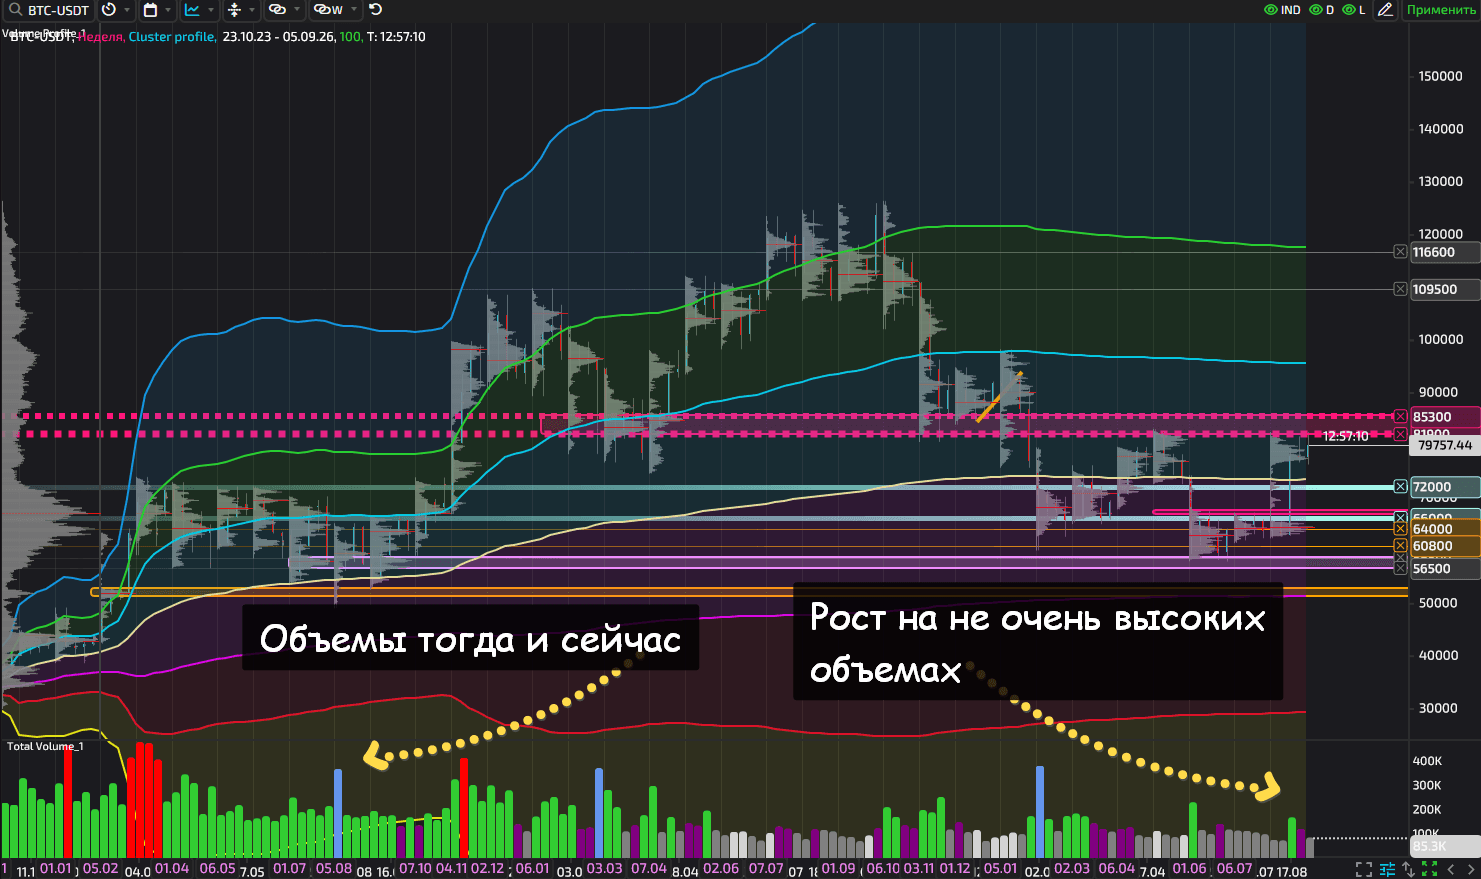
But weekly turnover of 169,000 BTC coins is not exceptionally strong. For example, in the first week of February alone, market participants turned over more than 384,000 coins.
Nor is there much excitement overall: let us attribute this to the lack of “hot money,” which I mentioned at the very beginning of the review. Just for comparison, weekly turnover in 2024–2025 was generally higher each week than it was in every week of the summer.
When Speculators May Begin Pushing the Price
I should note that a genuine increase in turnover under this model should occur above the 81,900–85,300 range, but we are not discussing that scenario today.
The first week of September is the third week since the impulse began. Turnover is fading.
Declining turnover during an impulse—a trend—is evidence of an imminent expansion. On the other hand, the same decline in turnover near the upper boundary of the range is a sign of an imminent reversal.
The expected time for any movement to begin is mid-September through the final ten days of September, around the Fed meeting.
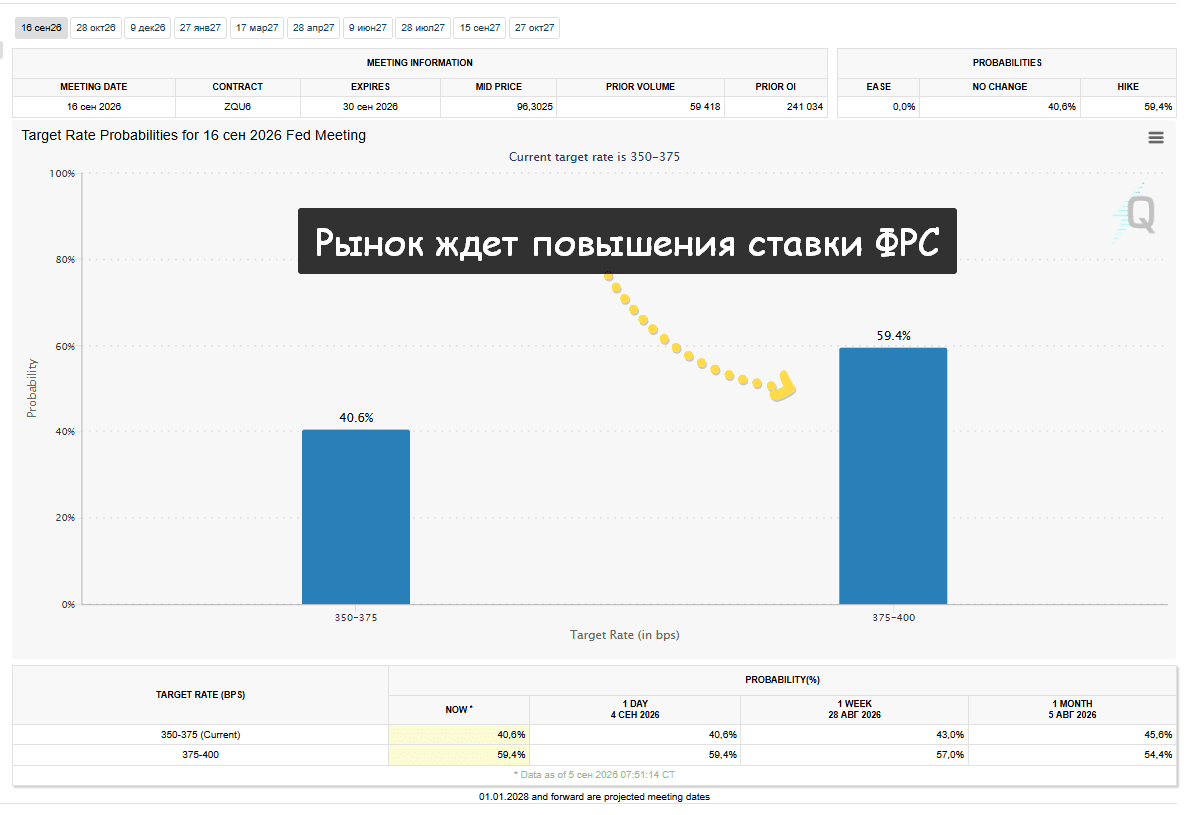
Speaking of the Fed rate, the market expects a rate hike. That does nothing to support growth in speculative assets. However, new Fed Chair Kevin Warsh has said that under his leadership, the Fed will place less emphasis on investor expectations.
Anyone can also verify the importance of mid-September through early October by looking at history. In 2024, Bitcoin began a growth cycle during this period, while in 2025 it began forming an all-time high and a selling model.
Trading Model Within the Balance Area (Consolidation)
Let me remind you that we are not currently discussing the upside scenario. Our task is to understand what the invalidation of the impulse would look like “here and now”: naturally, within the weekly timeframe—that is, over the next 2–3 months.
The formation of a reversal pattern may imply that the local high was reached as early as last week. But frankly, a second move upward is also quite common.
In our case, one target for such a maneuver is near 88,000 per coin. Such a move could prove to be a bull trap because a move above $83.5K would be a signal to buyers. But the real signal is consolidation on the relevant timeframe, not merely a move above the level.
In this scenario, bears trading futures need to wait for a sharp return below $79,000 and then look for an attractive short-entry setup.
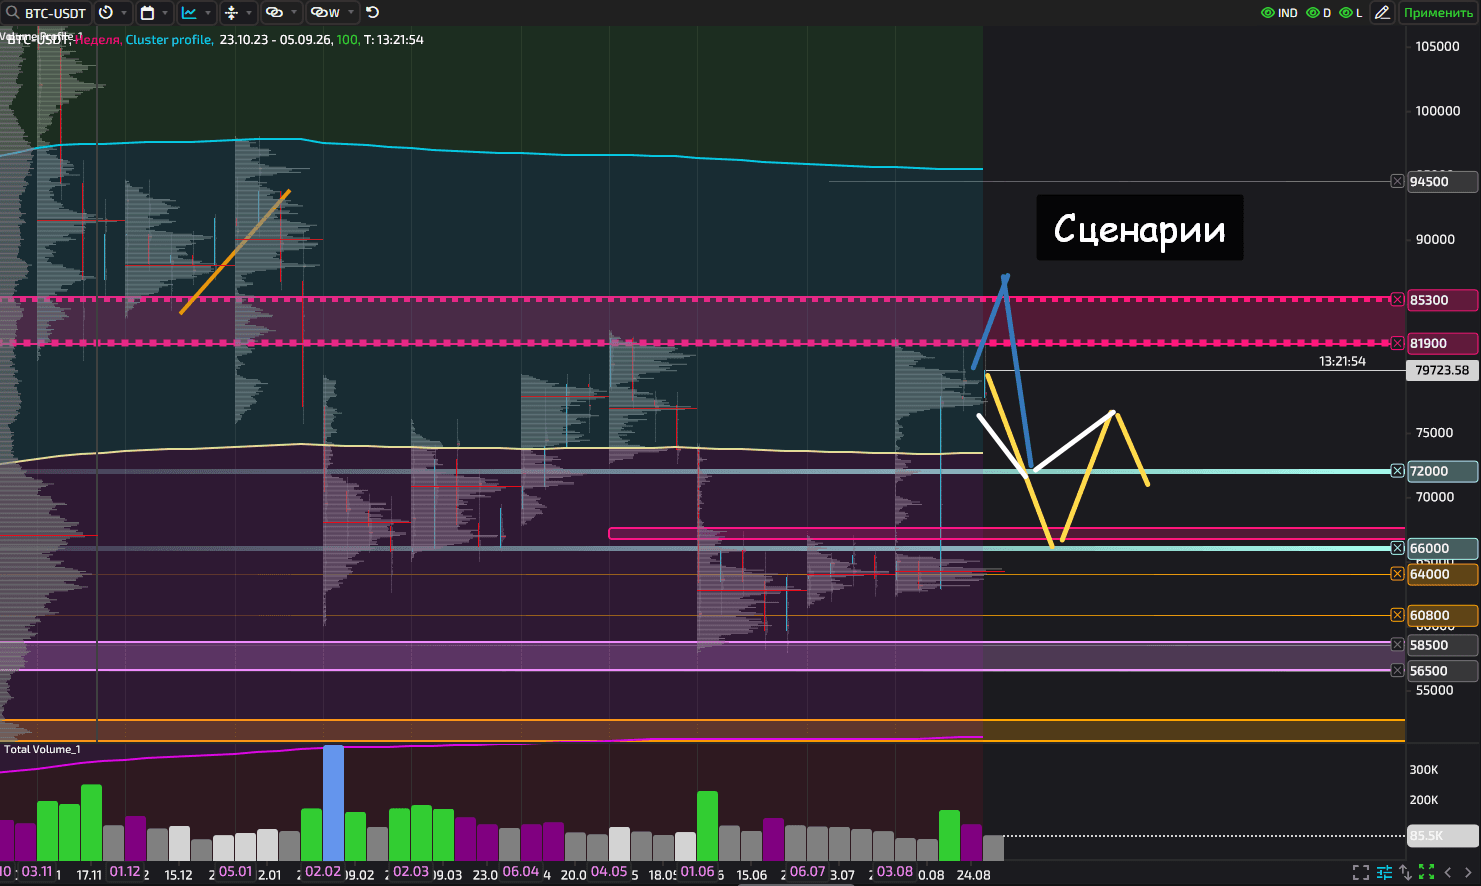
Whatever form the reversal takes, where might the price go afterward?
The first target is around $70,000, and the second is closer to $65K–$66K. Thus, I assume there is a nonzero probability that the imbalance within the balance area will be traded through.
And then? Let the market play out this scenario or another one, and then we will talk.
Conclusions: Arguments Against Aggressive Growth
It is time to sum up the article.
The current model is still not a fully formed bullish model. There remains a high probability of a return to the balance area from the first half of 2026.
From a fundamental perspective, we see declining ETF inflows amid expectations of a Fed rate hike. Everyone knows that the higher the rate, the less money flows into speculative assets.