
No TACO: How Americans Make a Billion a Day From Two Wars
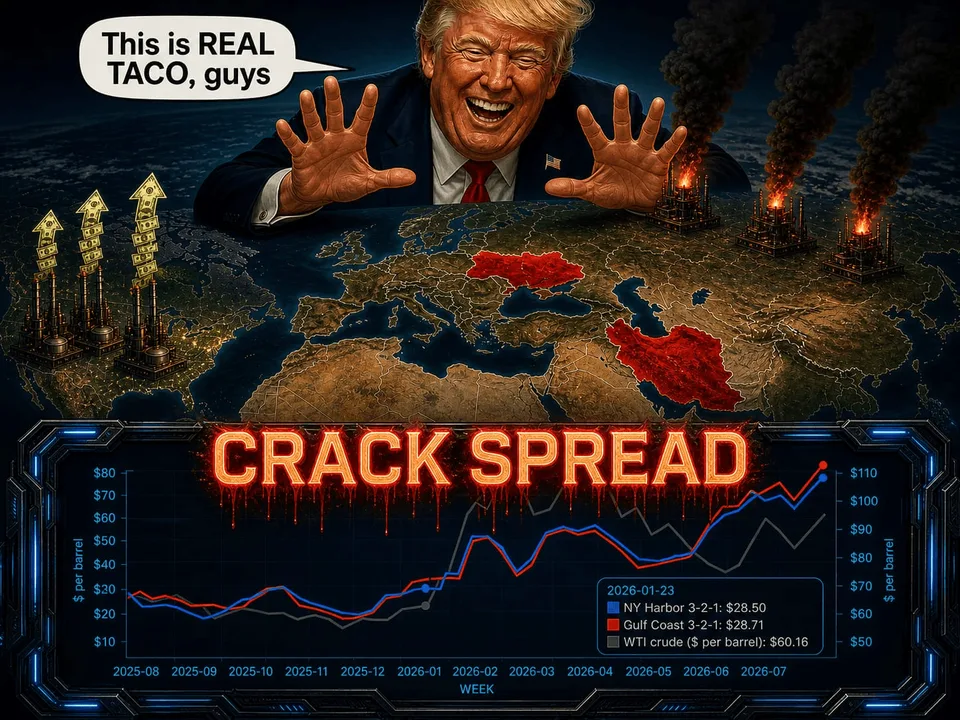
As you scroll through the news feed, you involuntarily begin looking for connections between events and asking questions—sometimes naive, sometimes silly, and sometimes not so silly. One such question is: who profits the most, and from what, when the Strait of Hormuz is blocked at the same time as Russian oil refining is attacked? And what does TACO ((Trump Always Chickens Out, meaning “Trump always backs down” or “Trump is always afraid”) have to do with it?
U.S. oil refineries profit the most from the two crises. They make their money on the crack spread—the difference between the price of crude oil (Brent, WTI, Arab Light, or Urals) and the value of refined products (gasoline, diesel, kerosene, etc.). In other words, the crack spread is a refinery’s profit.
The 3–2–1 crack spread (a refinery’s estimated margin) is calculated as follows: [(2 × gasoline price) + (1 × diesel price) − (3 × oil price)] / 3.
Since late February 2026, this difference has risen from an annual average of $25 to $70 by the end of August.
Below is a chart (courtesy of Data4ThePeople) showing the weekly dynamics of the U.S. 3–2–1 Crack Spread (NY Harbor and Gulf Coast).
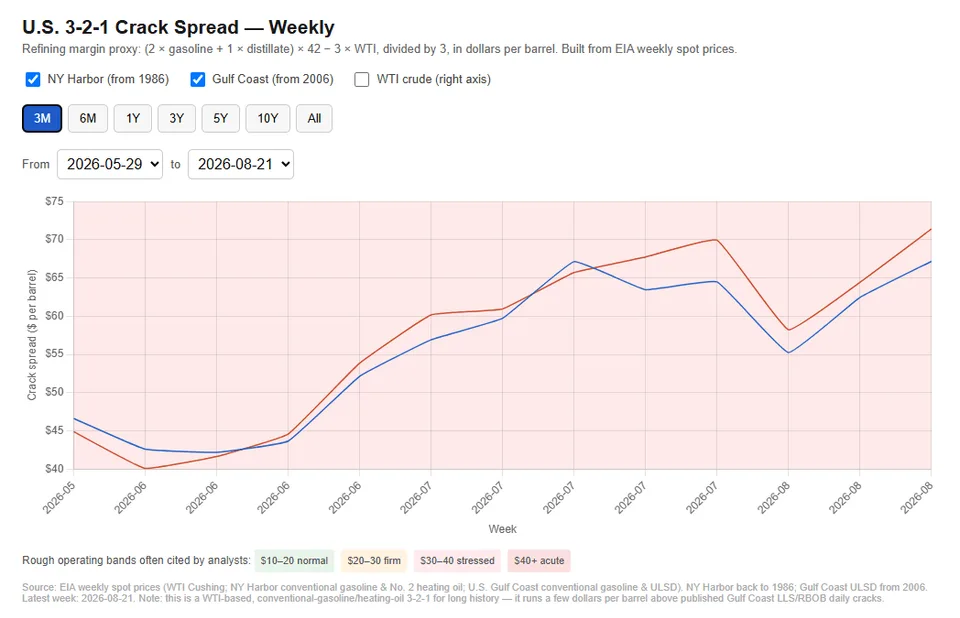
The left-hand scale shows the crack spread in dollars. The background is divided into four zones that help quickly assess the state of the industry:
$10–$20—normal margin (Normal);
$20–$30—solid profit (Firm);
$30–$40—stressed petroleum product market (Stressed);
above 40—an acute shortage of petroleum products and very high refinery profits (Acute).
“So what is unusual about that?” asks a practicing oil trader immersed in the market. “Refining margins always rise during a crisis. In 2022, when Russian oil was sanctioned, the crack spread reached similarly high levels but quickly returned to normal.” To support the point, the trader would attach a chart of the crack spread over 10 years.
Everything would seem clear. When there is a crisis, the crack spread rises. When tension in the oil markets subsides, the crack spread falls as well.
But let us look at the next image. It shows not only the Crack Spread (Gulf Coast), but also the WTI price.
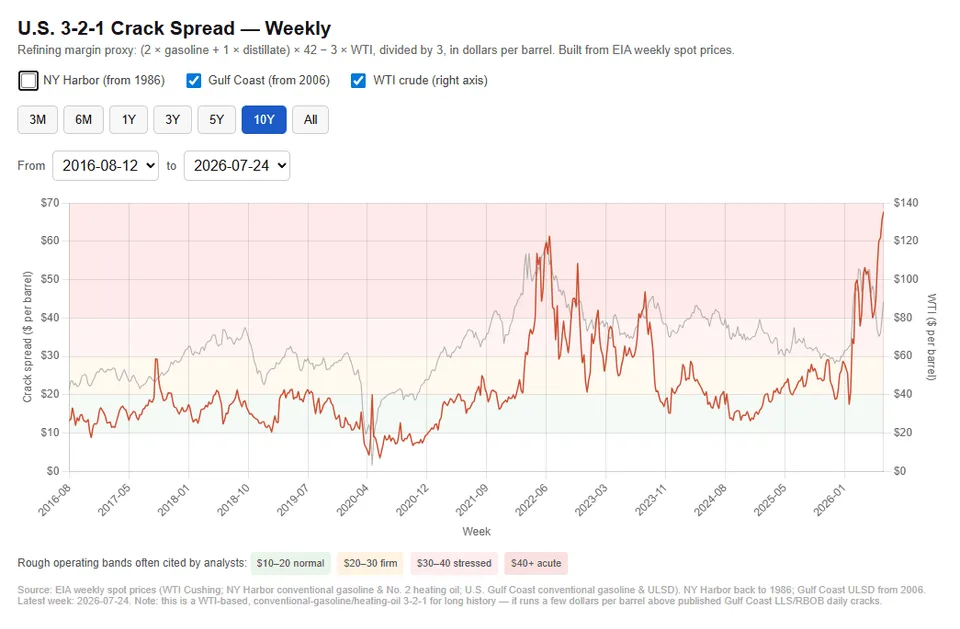
In 2016–2019, WTI rose steadily from approximately $45 to $75. During the same period, the Crack Spread remained virtually unchanged within the 12–20 range. Fuel prices rose together with oil prices, while refinery profits remained generally stable.
During COVID-19 in 2020, the WTI price collapsed, as did fuel prices. Refining profits fell almost to zero for several weeks.
In 2020–2022 (after lockdowns ended at the beginning of the period and after hostilities began in Ukraine in late February 2022), the rising WTI price was accompanied by a rising crack spread. By mid-2022, the oil price had risen from $20 to $120, while the crack spread increased from $10 to $60 (both oil and refinery revenue rose 6-fold).
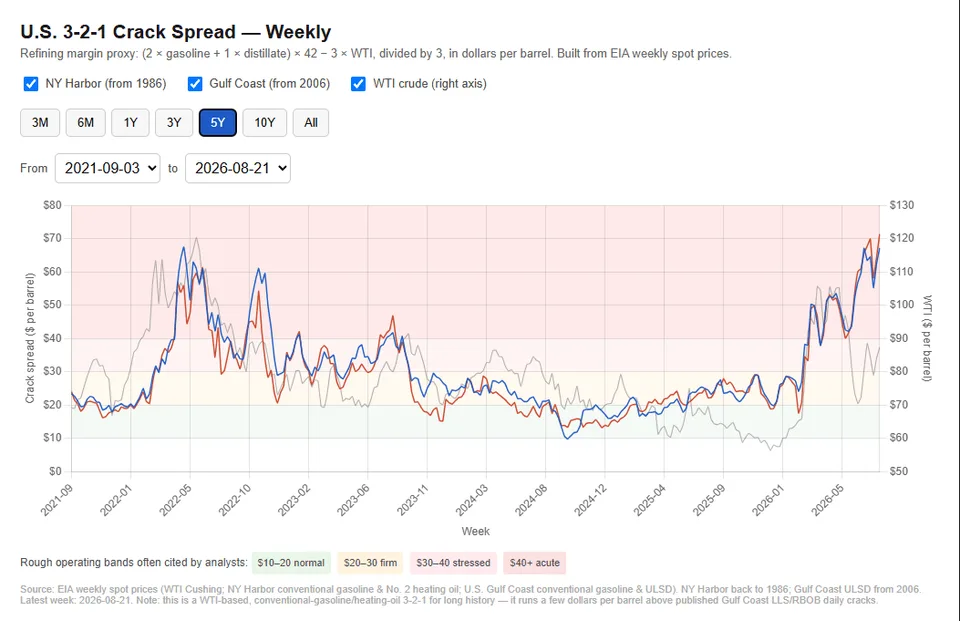
In any case, the chart clearly shows that the crack spread was generally more or less stable from the mid-2010s and remained in the $10–$20 zone. The special military operation caused both the oil price and the crack spread to rise sharply. But the crack spread generally followed oil.
The oil price began to decline in June 2022. Meanwhile, the crack spread fluctuated within a fairly wide range until November 2023. During this period, refinery revenue varied substantially from month to month but averaged $50–$60.
After the market stabilized, when a new mechanism for supplying Russian oil to global markets had generally been established, the crack spread settled within the $15–$30 range, although oil itself traded within the $60–$80 range.
So, let us note once again that the oil price declined steadily from mid-2022 through early 2026.
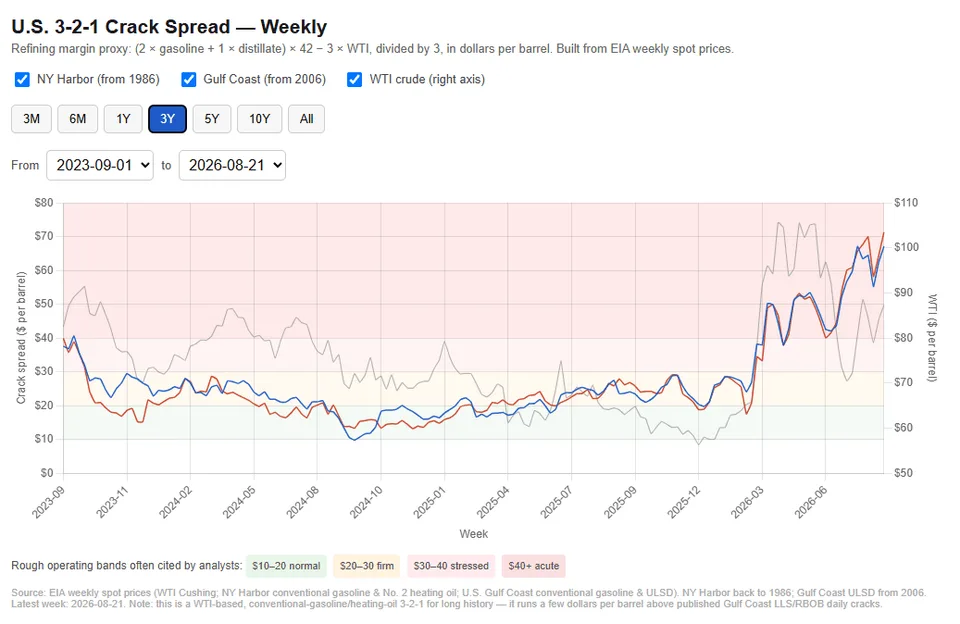
But from late 2024 to early 2025, the crack spread “decoupled” from the oil price and became entirely dependent on sanctions packages and difficulties exporting Russian oil and petroleum products.
In other words, oil was relatively cheap while fuel became slightly more expensive. This significantly helped the world’s key refineries increase their revenue in both domestic and foreign markets.
Below is a list of the largest petroleum product exporters in 2025 (according to EIA data, million metric tons).
United States—273.6
Russia—114.8
UAE—85.8
India—81.5
Singapore—75.2
China—54.5
Saudi Arabia—53.4
Kuwait—43.3
Canada—35.2
Iraq—25.5
Japan—10.6
A total of 853.4 million metric tons of petroleum products were supplied to global markets in 2025.
What immediately stands out is that the United States became the main beneficiary of anti-Russian sanctions, accounting for 32% of global supplies. But there is still never enough money, as in that joke:
A rabbi is walking down the street. He finds a wallet. He picks it up, counts the money, and realizes that some is missing.
Then March 2026 arrives: the United States begins a conflict with Iran. Oil and the crack spread soar. The latter rises more sharply and aggressively.
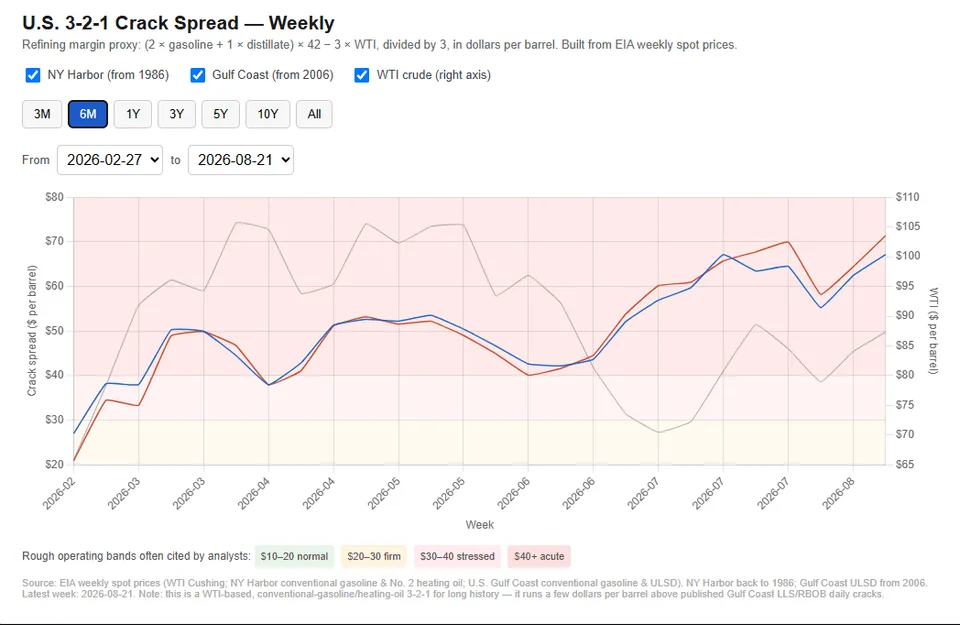
In late May 2026, exchange-traded oil begins to decline. For an entire month, the crack spread falls slightly along with oil.
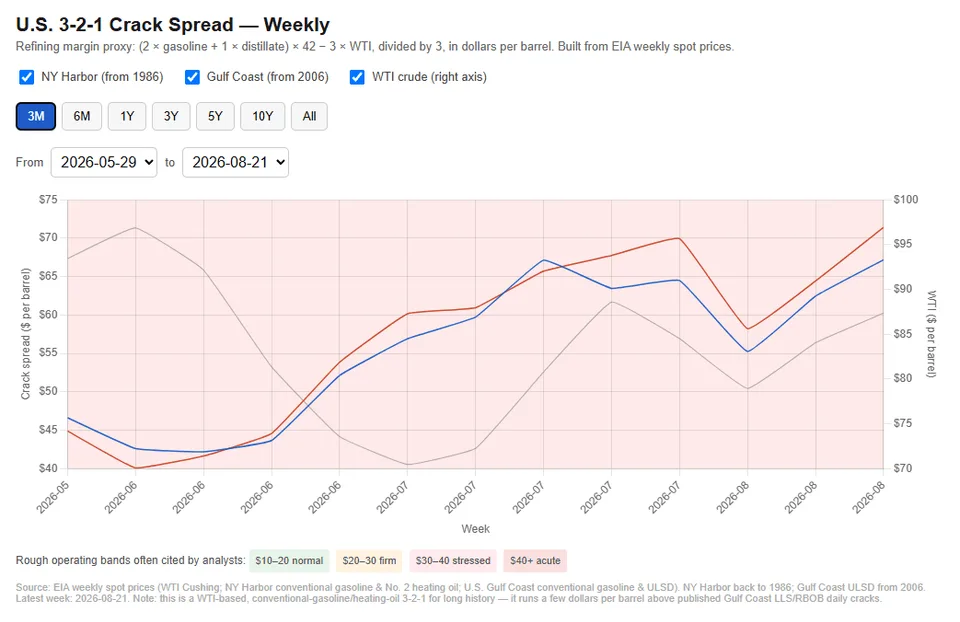
In early June, the crack spread stopped declining while oil continued to become cheaper. Moreover, for several consecutive weeks, the crack spread rose while oil fell. In other words, the main pattern of all previous decades was broken.
What caused this? The obvious reason is a real oil shortage. But there is something else as well. That “something” is the disappearance of Russian distillates from the global market, although we will not discuss it in depth in this article.
Some Statistics
Thus, the war in Iran led to a sharp decline in oil exports from the Persian Gulf.
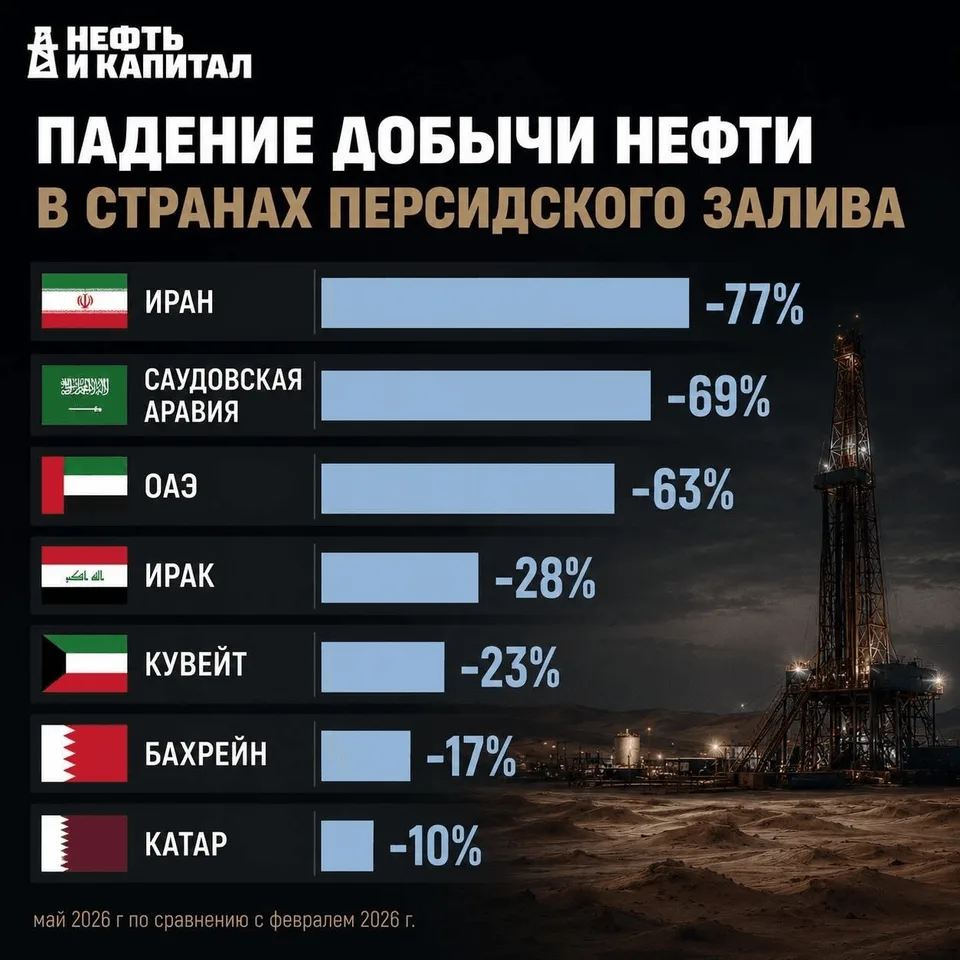
Before the crisis, Persian Gulf countries produced approximately 25.2 million barrels per day. Then a sharp decline began:
March: −8.89 million barrels per day;
April: −10.52 million barrels per day;
May: −11.25 million barrels per day.
Follow closely: the start of the war in Iran sharply reduced the supply of oil and fuel on global markets. Strikes on Russian export facilities in the Black Sea (Novorossiysk) and Baltic Sea (Ust-Luga) briefly reduced oil exports.
At the same time, sales of oil from U.S. reserves accelerated with unprecedented force. Thus, some reduction in physical volumes on global markets merely prolonged the period of high exchange prices, during which the United States actively sold off its reserves.
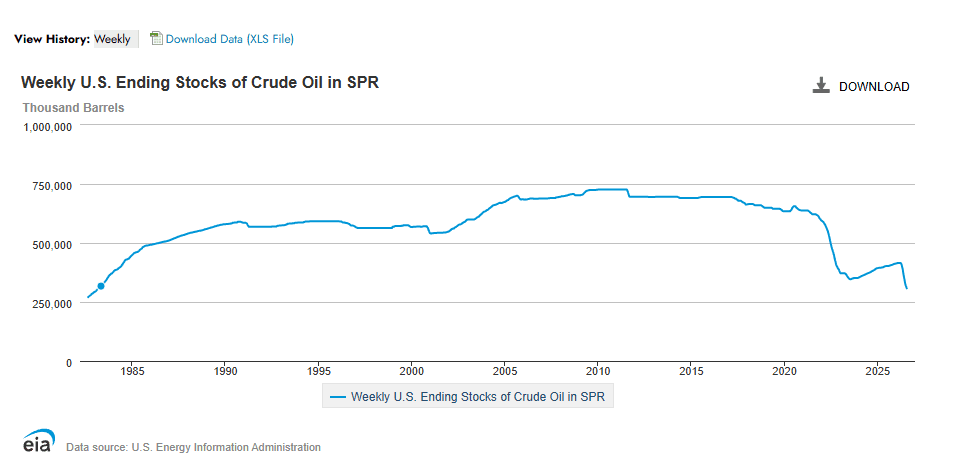
It should be noted separately that reserve selloffs began during Trump’s first term, but they were less pronounced.
The decline in U.S. oil inventories accelerated sharply in early 2022 (the special military operation and sanctions causing a temporary shortage of Russian oil on global markets), reaching a low in mid-2023. By then, so-called “shadow” oil exports from Russia had been established, allowing the United States to halt the inventory decline and even accumulate a little oil.
Reserves were shrinking and continue to shrink not only in the United States but also in other countries. In one form or another, this contributed slightly to a temporary stabilization of the oil supply.
The temporary ceasefire in July returned some oil to global markets, but this was more of a rebound than a return to normal.
By April–May, Russian oil exports had stabilized. For U.S. exports, however, a record May was followed by a July slump, with oil volumes falling to 3.66 million barrels per day:
Asian buyers reduced the share of U.S. oil in their imports from 52% in June to 40% in July;
Japan’s purchases collapsed by 67% from their May peak to 324,000 barrels per day;
South Korea’s purchases fell by 39% to 474,000 barrels per day;
European imports fell by almost half from their peak, from 2.5 million to 1.7 million barrels per day.
Thus, the July ceasefire with Iran drove U.S. oil exports down to an eight-month low.
By the same time, oil exports from the region had been partially restored: Arab countries partly redirected flows along other routes and, without much publicity, also began paying tribute to Iran for passage through the Persian Gulf.
Meanwhile, U.S. refineries increased utilization to 96.3%—the highest level since 2018. Naturally, the plants needed more feedstock. That feedstock had just become available, allowing them to boost profits sharply by keeping the crack spread at high levels.
Let us look again at the leading petroleum product exporters in 2025.
United States—273.6
Russia—114.8
UAE—85.8
India—81.5
Singapore—75.2
China—54.5
Saudi Arabia—53.4
Kuwait—43.3
Canada—35.2
Iraq—25.5
Japan—10.6
Countries whose exports are directly affected by the conflict in the Middle East are shown in bold. Countries on which the Middle Eastern conflict has a notable indirect impact are shown in italics.
By mid-2026, net U.S. petroleum product exports had risen from 5 million to 6.3 million barrels per day due to higher refinery utilization, which reached 92% nationwide and 95% on the Gulf Coast in May. The July figures are even higher.
Exports of jet fuel (3-fold) and distillates (+27%) rose especially strongly.
Before the crisis, the largest refining regions were:
Region
Capacity, million barrels per day
China
~18–19
United States
~18–19
Europe
~15
India
~5–6
Middle East
~10
Russia
~7
Back to Russia
Before the attacks on refineries began, Russia was one of the world’s largest exporters of petroleum products, supplying more than one-third of its petroleum products to the global market. The decline in Russian production led to a ban on gasoline and distillate exports through the end of January 2027.
ChatGPT estimated the impact of restrictions on Russian petroleum product exports on the global market at 20–30%.
Factor
Estimated contribution
War involving Iran and Hormuz
50–60%
Russian refineries and export restrictions
20–30%
Low commercial inventories
10–15%
Seasonal summer demand
5–10%
Calculating U.S. Refinery Profits
Let us calculate the profit earned by U.S. refineries from the war in Iran and the complete disappearance of Russian distillates from global markets.
Assume throughput of 18 million barrels per day. The additional margin is $45. This gives us 18 × 45 = $810 million in additional daily gross profit. For a quarter, 810 × 90 = $72.9 billion in additional gross profit.
Yes, this is not net profit. The cost of energy, higher labor costs, transportation expenses, repairs, depreciation, and taxes must be deducted from it.
However, even after accounting for these factors, the increase in operating profit for the largest U.S. refiners could amount to tens of billions of dollars.
Company
Additional gross profit, $ million per day*
Valero
~145
Marathon Petroleum
~135
Phillips 66
~90
ExxonMobil (Refining)
~80
Chevron (Refining)
~45
*The calculation assumes full capacity utilization and an average $45-per-barrel increase in the crack spread. This is a model estimate, not published financial reporting.
But the fact remains: the United States makes the most money. It started the war. An additional billion dollars goes into private pockets every day. The state bears the expense; private hands receive the income. It is a story as old as time.
Let me give you the result immediately in a simple table so there is “less text,” although there is already a great deal of it.
Russian oil flows to global markets, but Russian gasoline does not. And that is pure American profit.
What
Middle East
Russian Federation
Result
Oil
-
+
easing the shortage and supporting prices
Petroleum products
-
-
growth in the crack spread and U.S. refinery revenue
Thus, the war involving Iran became a rare example of a crisis in which:
oil producers worldwide earned additional profit thanks to higher oil prices;
U.S. refiners achieved an even greater increase in profit thanks to record growth in crack spreads;
countries with major export-oriented refineries (primarily the United States, as well as India and South Korea) were able to partially replace the lost volumes and significantly strengthen their positions in the global petroleum product market.
What About the Exchanges?
On the exchanges, everything is as usual. A classic FVG played out. The summer ceasefire sent oil down. The very imbalance that occurred in March was traded through.
Incidentally, oil began to rise shortly before the war. Someone clearly knew something. It is visible in the volume model: positions were accumulated from January through late February within the $58–$66 range. We will not discuss what happened earlier.
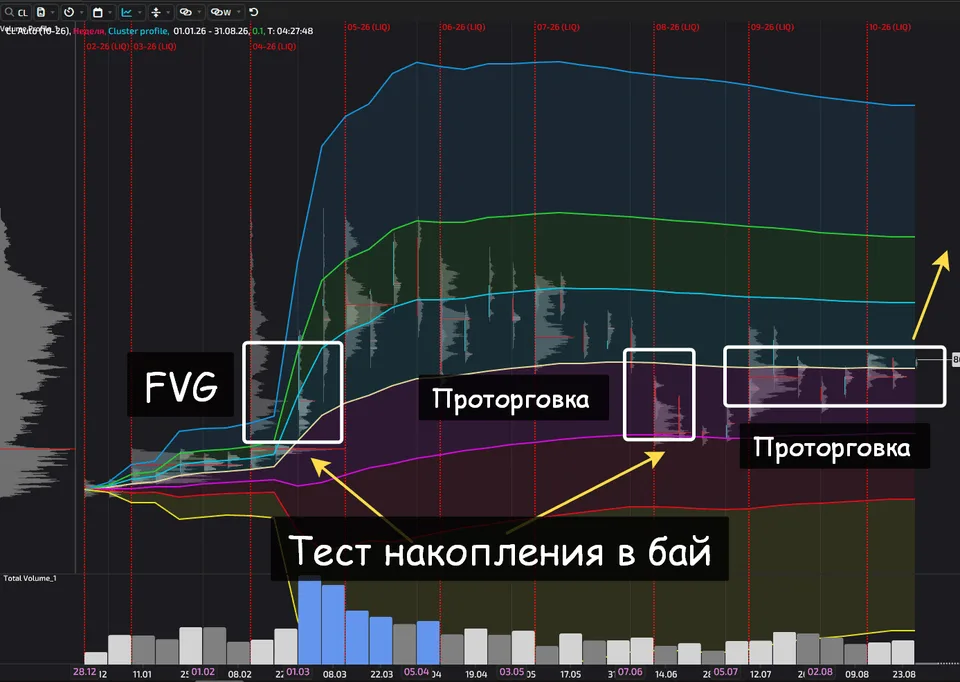
From there, the model follows a classic pattern.
Trading takes place within a certain range (say, $85–$115 per barrel of WTI). Then comes a ceasefire, and oil moves to trade through the FVG imbalance. By late July, oil tests the lower boundary of the March–June value area and turns north amid a new escalation.
In late July, Trump “backs down” again. Oil heads lower again “on the news.” But in essence, it is simply trading through the FVG.
The model implies a greater than 80% probability of a further move north. Moreover, it could fly through the $86.5–$93.5 range in 1–2 weeks during the first half of September.
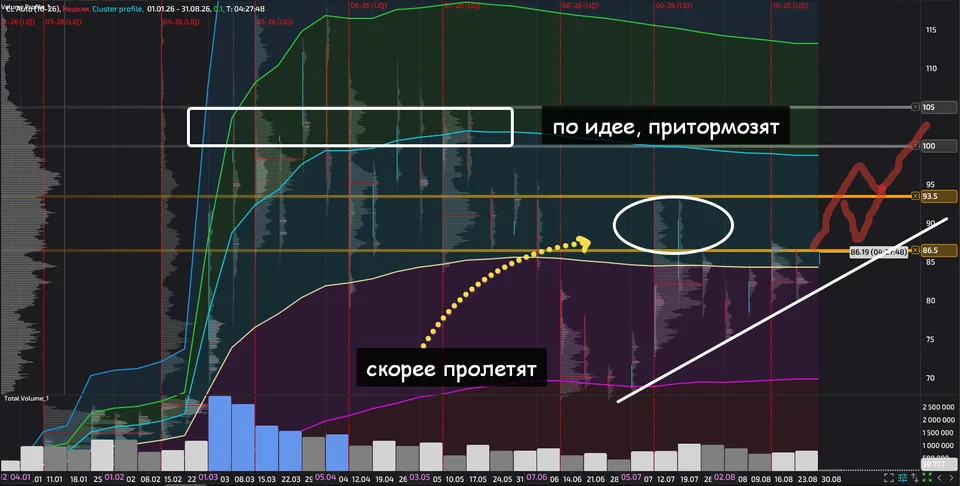
Right now, it is carefully breaking through the annual average VWAP. A break above the average VWAP means a target at +1 deviation and beyond. This implies a move into the $100–$105 range, where the upper boundary of the annual value area is also located.
The price’s subsequent fate will be decided there. However, the real structural oil shortage is not going anywhere, and a continued move north can be expected. Unless U.S. banks intervene again with their limits to restrain the exchange price.
But, frankly speaking, the real oil price decoupled from the exchange price in March 2026, and there are still no signs that the connection between the real and exchange prices is being restored.
Instead of a Conclusion
During the ceasefire, the United States spends approximately $0.5 billion every day in the Persian Gulf to maintain combat readiness. During the active phase, the expenditure doubles and triples.
On that same day, U.S. refiners earn approximately an ADDITIONAL $1 billion.
I think Trump’s actions are now clear: he once promised to support the U.S. oil industry. He was simply referring more to oil refiners than to oil producers. But who cares?
It also becomes clear that there is no TACO (Trump Always Chickens Out, meaning “Trump always backs down” or “Trump is always afraid”). Instead, there is cold calculation. And pure profit. Lots and lots of profit.
Far more than from the innocent crypto games of Trump’s children.