
Arrow Indicators in the Forex Market – Are They Useful?

The active development of algorithmic trading in forex has not eliminated manual trading based on signals from indicators. Many of us still enter the market after visually analyzing curves on the chart, histograms in the lower pane, moments when curves cross, reversals in overbought/oversold zones, or changes in the color of histogram bars.
There is nothing difficult about entrusting these signals to an expert advisor; as they say, to each their own. However, it is always possible to make the visually manual trading process more psychologically comfortable, more precise and ensure adherence to trade discipline.
In today’s material, we will talk about a series of indicators that supplement signals with arrows indicating the place and direction of entry. Let us see whether an ordinary currency speculator can get any benefit from arrow indicators.
Why Are Arrow Indicators Needed in Forex?

This material is aimed at “manual traders,” most of whom are day traders, that is, they make trades within the day.
Currency pairs are a fairly volatile instrument that causes high emotional and physical strain, which leads to distraction, especially on days filled with economic news. At such moments, a trader may miss the signal of one of the filter indicators, but it is impossible not to notice an arrow on the chart.
Forex arrow indicators will reduce the number of missed entries, which is very important for an intraday strategy, where the mathematical expectancy is quite low and the costs of the spread are high.
For a beginner trader, arrows will help to better understand the mechanism of signal formation in a trading system during step-by-step testing. The appearing entry-direction icons will make it possible to test indicators in the strategy tester in accelerated visualization mode.
Below are five fairly simple and effective indicators designed for intraday trading in Forex.
RSX–arrows: the Simplest Forex Arrow Indicator

RSI has become the basis of many strategies; a separate article on our website is devoted to ways of using this oscillator. The RSX–arrows trading system is an attempt to use the indicator curve in conjunction with the widespread crossover strategy: trading on crossing signals of moving averages Moving Average (MA). The most popular MA trading strategies are described in this article.
The developers of RSX–arrows added a shorter-period moving average to RSI, assigning it the role of a fast signal line, while achieving the following advantages:
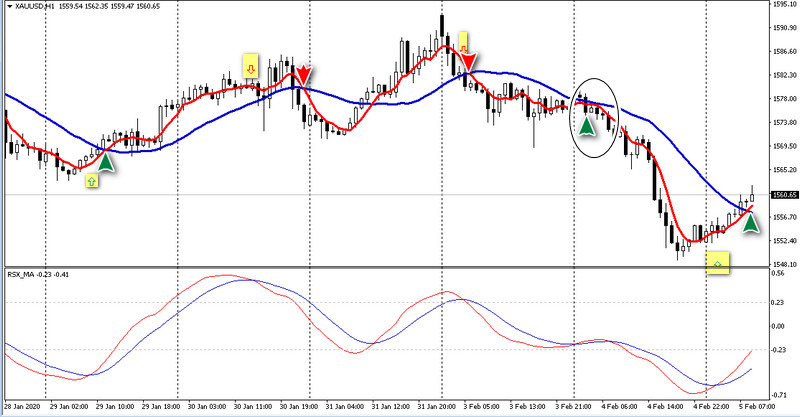
The figure below shows how much the RSX–arrows signals lead the crossing signals of two MAs with similar periods, and in some places they also skip false entries.
Indicator Characteristics
Platform: MetaTrader4
Currency pairs: majors and crosses EURJPY, AUDJPY, EURGBP
Timeframe: H1-H4
Trading time: any
Indicator type: arrow
Recommended brokers: Alpari, Roboforex, Amarkets
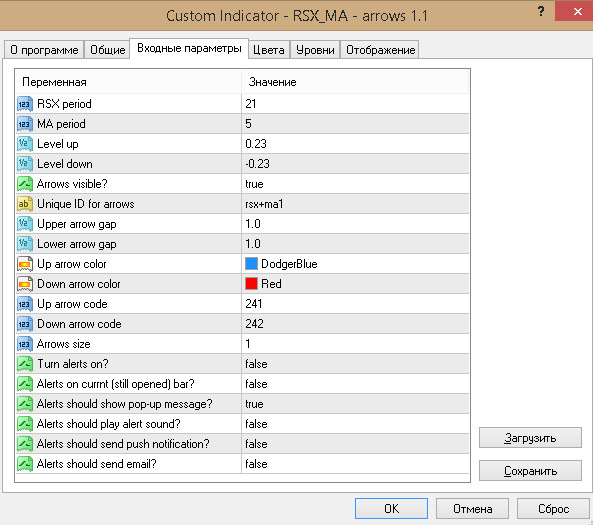
When the Forex arrow indicator is first installed on a chart, a window with 19 configurable input parameters will open:
Below are the fields for setting the size and appearance of the arrows and the types of alerts; on the other tabs of the menu window, you can choose suitable colors and line thickness for the indicator.
How the arrow indicator works
After a candle forms and closes, an arrow appears on the chart; its direction and color will indicate the type of trade. A Trader must manually open market orders:
Trading system is a reversal one, that is, the opposite position will simultaneously be a new entry and the closing of the previous order at a profit or a loss. This configuration does not provide for pre-set stop-loss and take-profit.
Examples of how the RSX–arrows MA indicator works
In the figure below, on January 6, the MA line, moving with the XAUUSD rate, crosses RSI downward, after which an arrow appears on the chart. A Trader should open a Sell despite the rise in the price of gold, and hold the trade until the opposite signal appears.
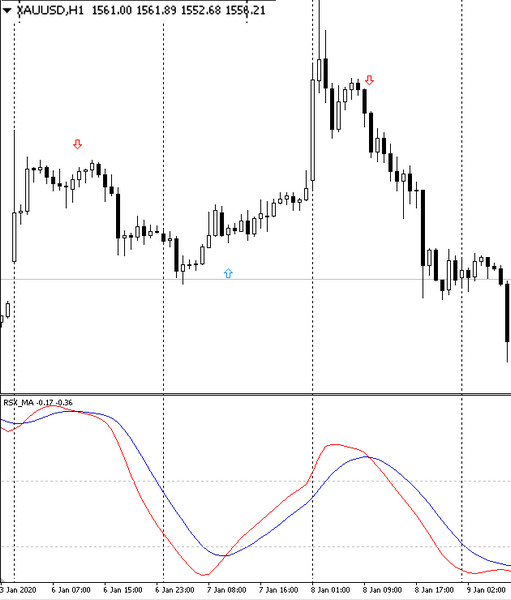
The subsequent fall in the XAUUSD rate brings the indicator into the oversold zone, where the reverse crossing of the RSI signal moving-average line gives a Buy signal at the market price and closes the previous Sell order with a profit of 113 points. The surge in gold brings one more gain: the Buy order is closed after the indicators reverse in the overbought zone.
Advantages and disadvantages of the indicator
The crossover strategy, one of the earliest market trading tactics, is still effective. The use of RSI gives more accurate signals with additional filtering in the form of overbought and oversold zones.
The mechanism behind the appearance of the arrows is quite clear, and the combination of a moving average and an oscillator guarantees that the signals do not repaint; this is easy to verify by visualizing the intersections of the two curves in the lower panel of the chart.
Among the drawbacks, one can note the standard set of crossover ailments: a large number of false signals in a flat and the need to select parameters for each currency pair. Despite the developers' claim about the self-sufficiency of the trading system, it is better to use it in conjunction with other indicators.
Scalping Arrows: Trend Master

The Forex arrow indicator Trend Master from the developers of Prodigy SMART Pro is another tool for intraday trading with a convenient display of signals. The appearance of arrows of different types and sizes is accompanied by sound and visual alerts.
The indicator is based on weighted moving averages combined into a single line that changes color together with the direction of the trend. It is combined with an oscillator that gives signals in overbought/oversold zones and when quotes reverse.
Indicator Characteristics
Platform: MetaTrader4
Currency pairs: any
Timeframe: M5-M15
Trading time: any
Indicator type: arrow
Recommended brokers: Alpari, NPBFX, Instaforex
The folder with the indicator contains one ex4 file, which must be installed according to the standard instructions into the MQL/Indicators folder. The Trend Master settings window will open after the first launch from the "Navigator" window or from the menu via Insert/Indicators/Custom.
The developers left the trader only one settings item for trading:
When selecting mode 1, more arrows will appear on the chart; type 2 will designate only large trends. Below are fields for adjusting the size, color, style of the arrows, and alert types. On the "Colors" tab you can choose suitable colors and the thickness of the indicator lines.
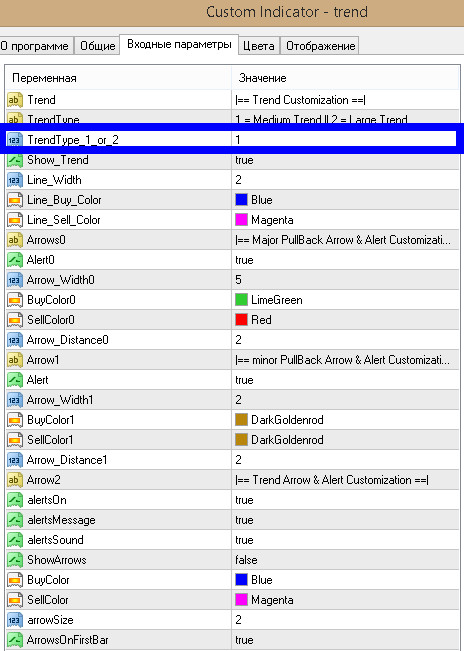
The practice of using the indicator shows that it is better to set type 1. If a trader wants to trade major moves, they can use the large-size arrows. Theoretically, they determine the moments of reversal and the start of a new long-term trend.
How the arrow indicator works
The indicator gives four types of signals after the candle closes:
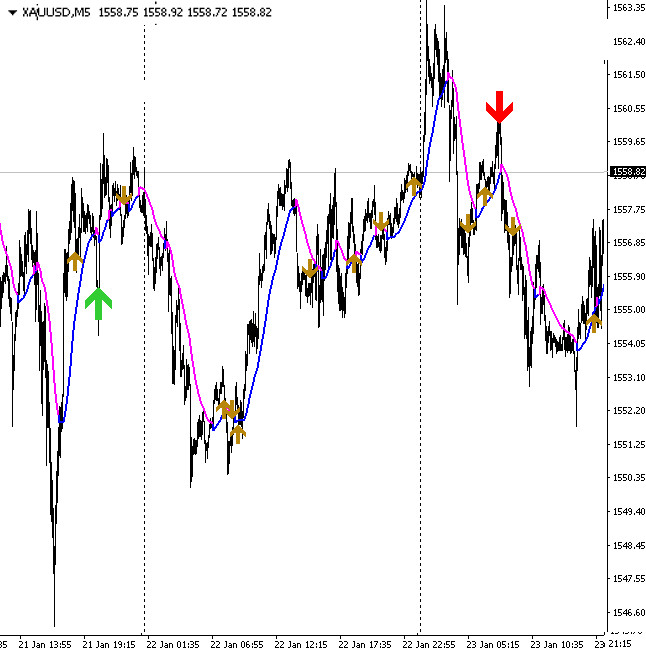
Trend Master trading strategy
Regardless of the size of the arrows, the trader is advised to follow the same trading strategy rules:
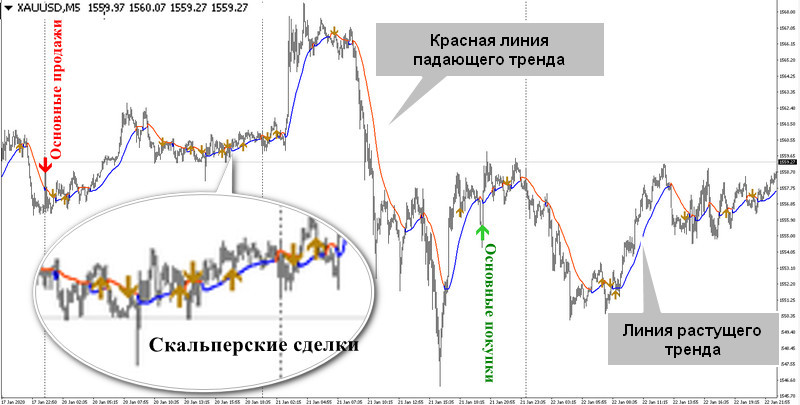
Examples of trading with the Trend Master strategy
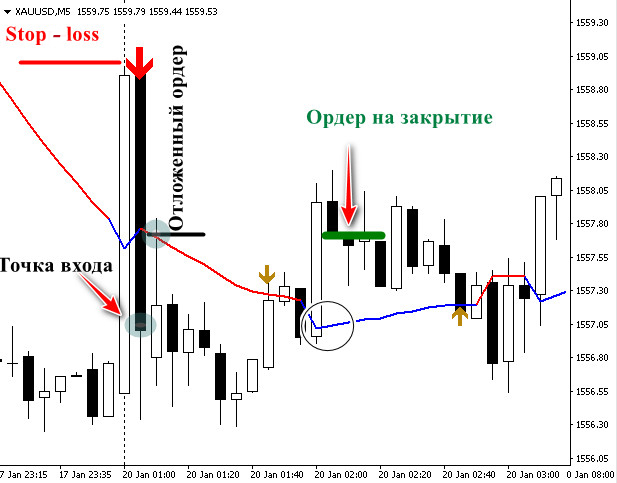
A large red arrow from the indicator gave a signal to go short, but the quotes fell below the Trend Master line, so one can enter from the resistance line by placing a pending order to sell. As soon as it is triggered, the trader sets a stop loss beyond the nearest high.
The correction leads to the line changing color to blue (this is an upward trend). The decline signal did not materialize, and to avoid a loss from the triggering of the stop loss, the trader places an order to close at the entry price.
The Trend Master indicator allows trades to be held for the long term even in scalping mode if a strong trend emerges in the market. In the example above, the trader sells gold, setting the Stop-loss at the same level as in the first case.
As soon as an opposite signal appears, the previous short is closed and a long is opened. The stop loss is placed at the lows immediately after entering the market. As long as there is no opposite signal, the trade is held and protected by a trailing stop, moved along the lows after each new price high while they remain below the Trend Master line.
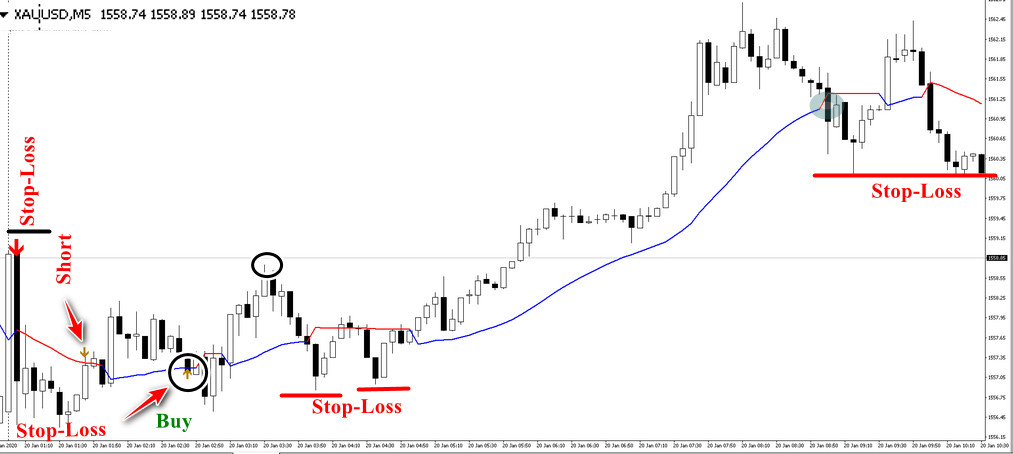
The trader closes the trade either when the line crosses and changes color, or with the help of a stop loss set at the first extremum after a prolonged trend.
Vulkan Profit: an arrow implementation of the Sidus method

Another trend arrow Forex indicator whose algorithm is based on two pairs of moving averages of different types. These are EMA and WMA of different periods; an arrow appears when one pair crosses the other according to the Sidus method.
It is believed that numerous tests made it possible to select the ideal ratio of periods for the two pairs of moving averages: EMA - 18 and 28, WMA - 3 and 8. The settings work intraday, reflecting changes in the balance of supply and demand between Sellers and Buyers.
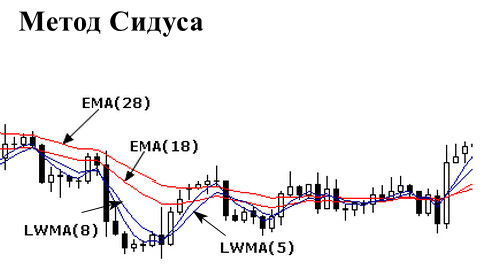
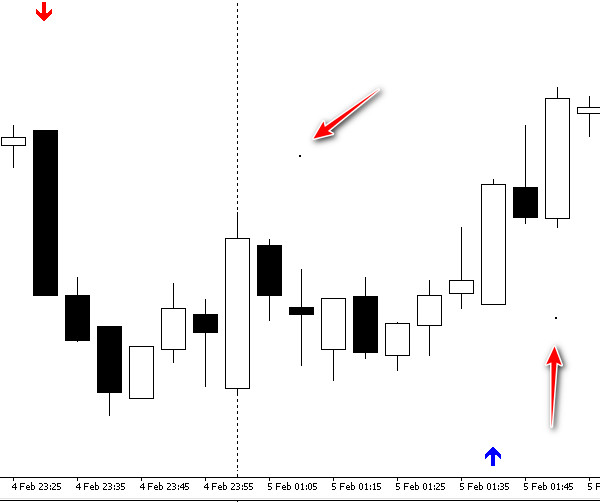
Vulkan Profit saves the trader from watching the moment when four lines cross, showing an entry arrow and the stop-loss level.
Indicator Characteristics
Platform: MetaTrader4
Currency pairs: any
Timeframe: M15-H1
Trading time: any
Indicator type: arrow
Recommended brokers: Alpari, Forex4you, Tickmill
The developers made it possible for traders to customize all parameters of the four types of moving averages, they are reflected in the following items:
The remaining settings relate to the number of bars on which arrows are displayed in the chart history (VP_Bars), and to various types of alerts; the "Colors" tab is responsible for the color scheme.
How the arrow indicator works
The trader executes market trades as soon as a signal appears after the candle closes:
The strategy sets the stop-loss level with a delay, after several candles have formed from the start of the entry. Later, a point appears, and its numerical value gives a specific loss-limiting level.
The trade exit is reversal-based, the position is held until the protective order is triggered or until an exit occurs on the opposite signal.
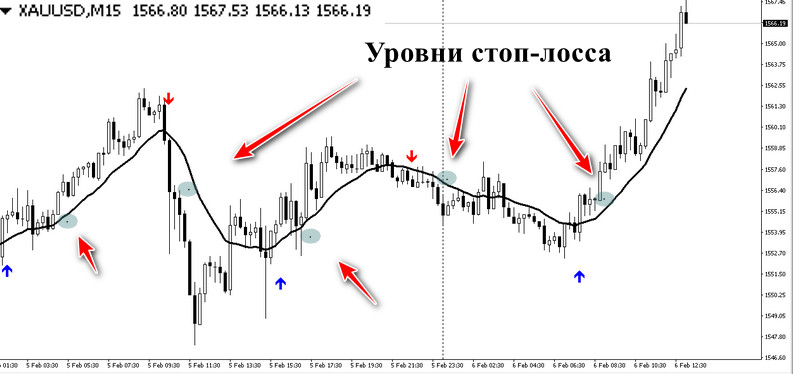
Skdon trend signal

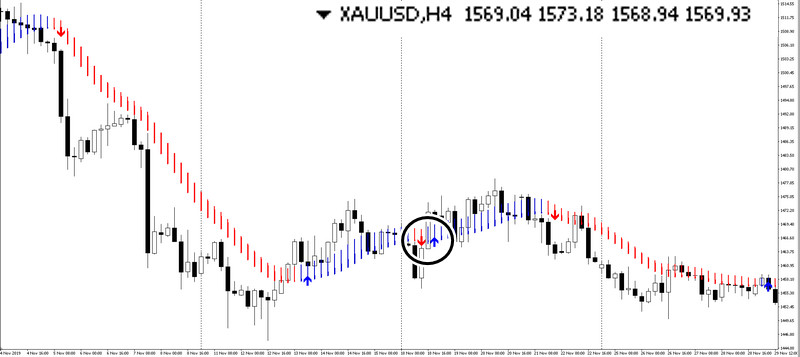
The Skdon trend signal indicator generates signals based on the analysis of moving average lines (MA). In addition to displaying arrows, a two-color series of candles is shown on the chart, resembling the Heiken Ashi pattern, but having nothing to do with it.
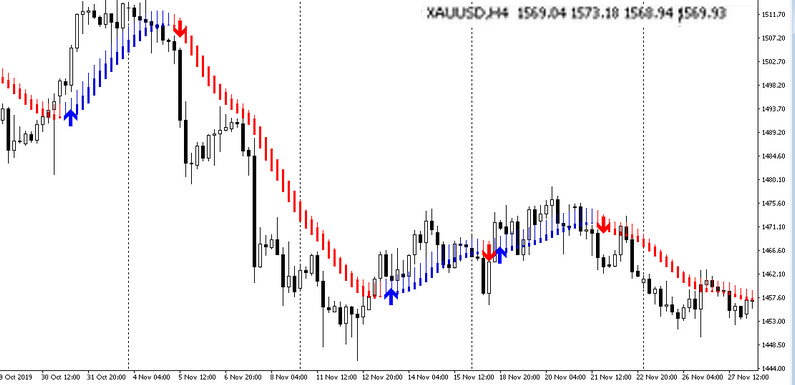
Indicator Characteristics
Platform: MetaTrader4
Currency pairs: any
Timeframe: H4-D1
Trading time: any
Indicator type: arrow
Recommended brokers: Alpari, Roboforex, Tickmill
The indicator settings window appears after it is installed in the MQL/Indicators folder. The user only needs to drag Skdon trend signal onto any chart from the "Navigator" panel of the Metatrader 4 terminal or add the "arrow indicator" through the "Insert/Indicators/Custom" menu.
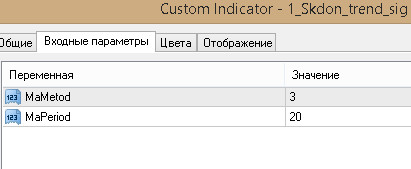
The "Input Parameters" tab contains two lines of settings:
How the arrow indicator works
Moving averages track the trend, a change of which leads to the appearance of an arrow on the chart. Further development of the move is accompanied by the color of same-type candles. They serve not only as visualization: trailing stops can be placed behind the candle wicks.
The trade exit is reversal-based, that is, the system assumes orders are constantly in the market. As soon as the signal changes to the opposite one, the trader must close the previous position and open a new trade.
Among the indicator's advantages, one can note confident tracking of long-term trends; the disadvantages are many consecutive false signals in a flat. The latter circumstance predetermined the working timeframe: it is unprofitable to use Skdon trend signal on intervals shorter than 4 hours.
SOLOMON Trading System: a Popular Forex Arrow Indicator

The SOLOMON indicator is a full-fledged trading system assembled from the standard oscillators RVI and Stochastic, combined with two moving averages (MA).
The task of the moving averages (MA) is to determine the trend in the classic way using a crossover signal that arrives with a lag. This problem is solved by the stochastic, which determines the start of the move in advance when the trend reverses in the overbought or oversold zone.
The oscillator's readings are not without problems either, so the erroneous determination of the end of the trend is resolved by applying RVI, the so-called "market vigor index." The indicator is used to determine the probability of trend continuation, canceling reversal signals.
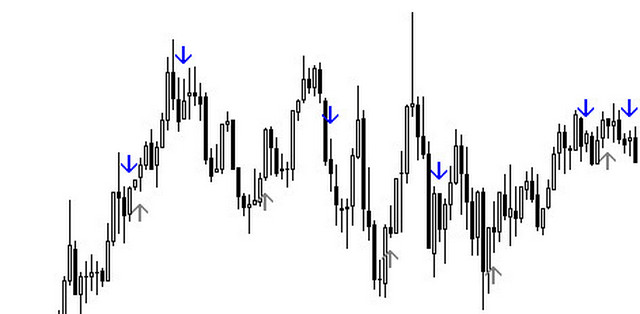
The above-mentioned curves are not displayed on the instrument chart, the trader sees only the arrow signals, which save them from having to compare at least five signs to open a trade.
Indicator Characteristics
Platform: MetaTrader4
Currency pairs: any
Timeframe: M5-M30
Trading time: any
Indicator type: arrow
Recommended brokers: Alpari, Wforex, AMarkets
The developers of the SOLOMON trading system gave users the ability to configure the oscillators included in the trading system. The description in Russian will not cause problems with understanding the meanings of the parameter fields for traders familiar with Stochastic and RVI; the rest should definitely familiarize themselves with the operating principles of these indicators.
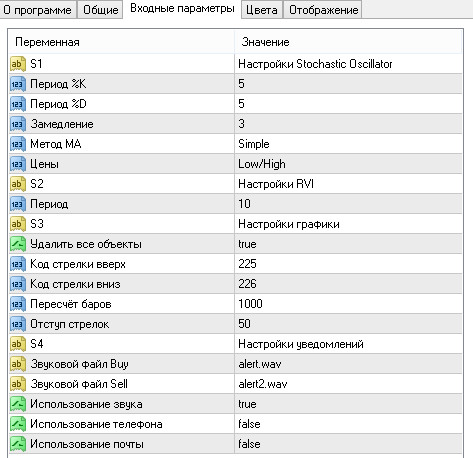
The default presets assume a scalping style of trading on small timeframes with a large number of trades. The trader can configure alerts for convenience and determine the size of the historical segment on which the arrow signals will be saved.
Principle of operation of the indicator
At the core of the SOLOMON strategy's money management lies a reverse trade system - losing or profitable positions are closed only after an opposite signal (arrow) appears. This allows the trader to avoid stop triggering during a surge in volatility, but imposes the obligation not to trade at the time of news releases and during inactive sessions periods (the so-called night trading - the transition period between the American and European sessions).
Positions are opened with market orders immediately after the arrow appears - it determines the direction and type of trade. Positions are not carried overnight if the trader is not present at the terminal.
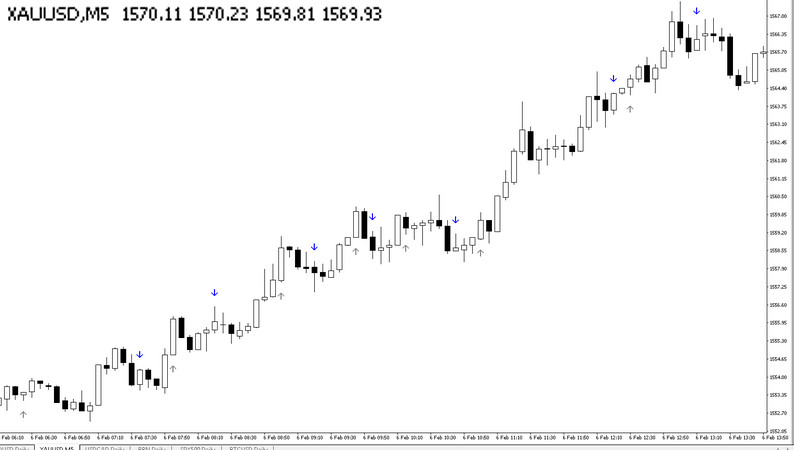
Conclusion

Most of the popular Forex arrow indicators presented in the article are used on small timeframes. This points to two facts:
These features consist in choosing certain time intervals for intraday trading, ignoring news, using a variable lot tactic, manually limiting losses, emotional resilience during a series of losses, and trading discipline.
The formation of arrows is based on moving averages, which on flat sections are capable of giving one losing signal after another, which are then covered by one trending move. The trader may miss it or take profit too early if they give in to emotions.
Download a selection of arrow indicators
Respectfully, Alexey Vergunov
Tlap.io
