
A Trader's Arsenal - From Beginner to Professional
 Hello, ladies and gentlemen forex traders!
In the difficult business of trading, every little detail matters, and today we will try to optimize routine processes. Someone will say it is a small thing, but agree, is there a difference between machining a part on an ancient machine and on the most modern one? The result may be the same, but for some reason it is more convenient and easier for the worker to work on modern equipment. It is the same with trading. We will look at how trading can be made more convenient, and you will not have to buy a new computer.
In today's review we will touch on information indicators. All traders use them in one way or another, from M1 scalpers to long-term traders working on daily charts. From time to time some kind of spread indicator or a convenient and practical info panel with all the necessary data is needed, but where can you find them? The search across the web begins, browsing topics on specialized forums, attempts to compile an MQL file in a new terminal build, which does not always work out. Now you will not have any questions about where to get info indicators, we have solved this issue for you.
What Info Indicators Are and What Types There Are

Information indicators are a separate group of technical forex indicators; they do not directly help make a decision to buy, sell an asset, or exit a trade. They have a somewhat different task. Info indicators provide the trader with all the necessary information on the trading instrument, account status (profit or loss in points, percentages, deposit currency, drawdown), the opening and closing times of trading sessions, the time until the current candle closes, data on spread, swap, and so on. In a word, everything necessary for comfortable work in the financial markets. Processing this, without exaggeration, colossal informational flow of various data in your head is inconvenient, and unnecessary, since there are a huge number of helpers. We will get acquainted with them today.
This review covers the following types of info indicators:
- Time indicators;
- News indicators;
- Profit indicators;
- Lot calculation indicators;
- Spread and swap indicators;
- Higher timeframe candle indicators;
- Information panels;
- Other useful indicators.
All of them are relevant for the MetaTrader4 terminal and are installed according to the standard instructions. Most files are presented with open source code, especially for programmers and everyone who likes to see how indicators are written. You can download all indicators via the link at the end of the article; the attachments are in one folder, and there are hundreds of items there. And in fact, it is simply physically impossible to write and tell about every single info indicator, so be sure to look at the forum topic as well (the link is at the end of the article): there are far more pictures and descriptions there for all kinds of useful little things for MT4.
Time Indicators

"Time is money," Benjamin Franklin, one of the founding fathers of the United States, once said. Time is one of the most valuable resources: there is always not enough of it, it cannot be replenished, it can only be used. In trading, time is one of the most fundamental things, because after opening a position, regardless of the working timeframe and strategy, you need to wait for the result: either the position will close by stop order, or the price will move in our direction and you will make a profit. Moreover, the wait can range from several minutes, if you are a scalper, to several months, if you work on D1 or a higher timeframe.
There is a huge number of indicators that show or count time, from various time bars that count the time until the candle closes to session indicators. The latter will be relevant for intraday traders: as a rule, most strategies are designed for certain trend movements, and they do not occur around the clock, but usually when the London and American sessions are underway. In turn, the time of the Asian session, when market movements are minimal, is used for other trading strategies as well as for a great many expert advisors, namely night scalpers. Below are several examples of such indicators.
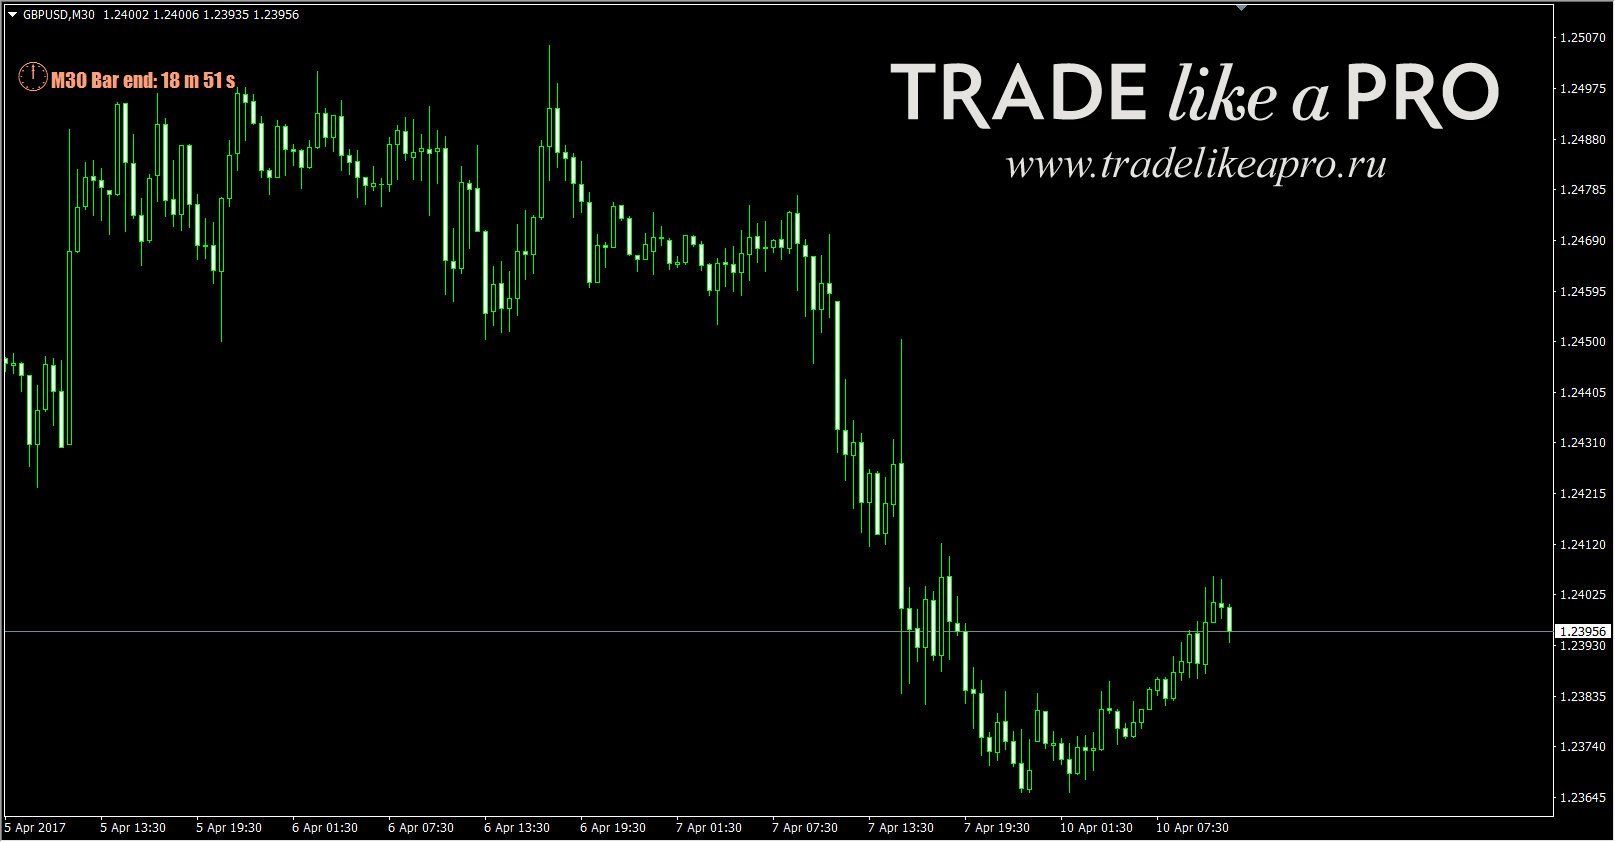
b-clock_TRO_MODIFIED_VERSION is a simple indicator that shows the time until the candle closes.
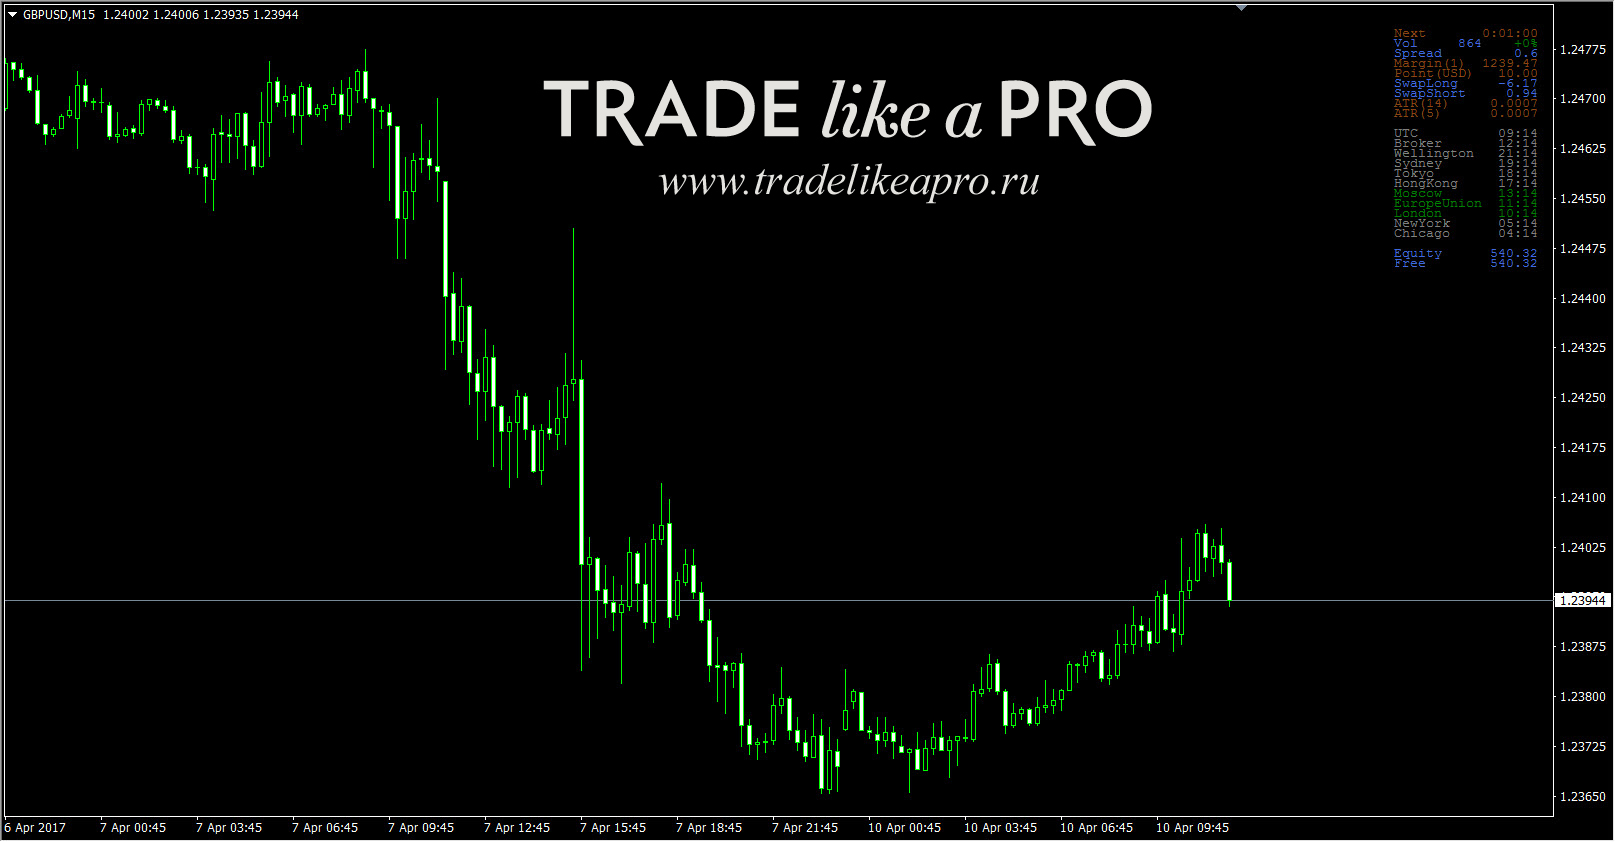
 iStockTimes_v1_5 is a whole panel with not only time, but also spread, swap, and ATR.
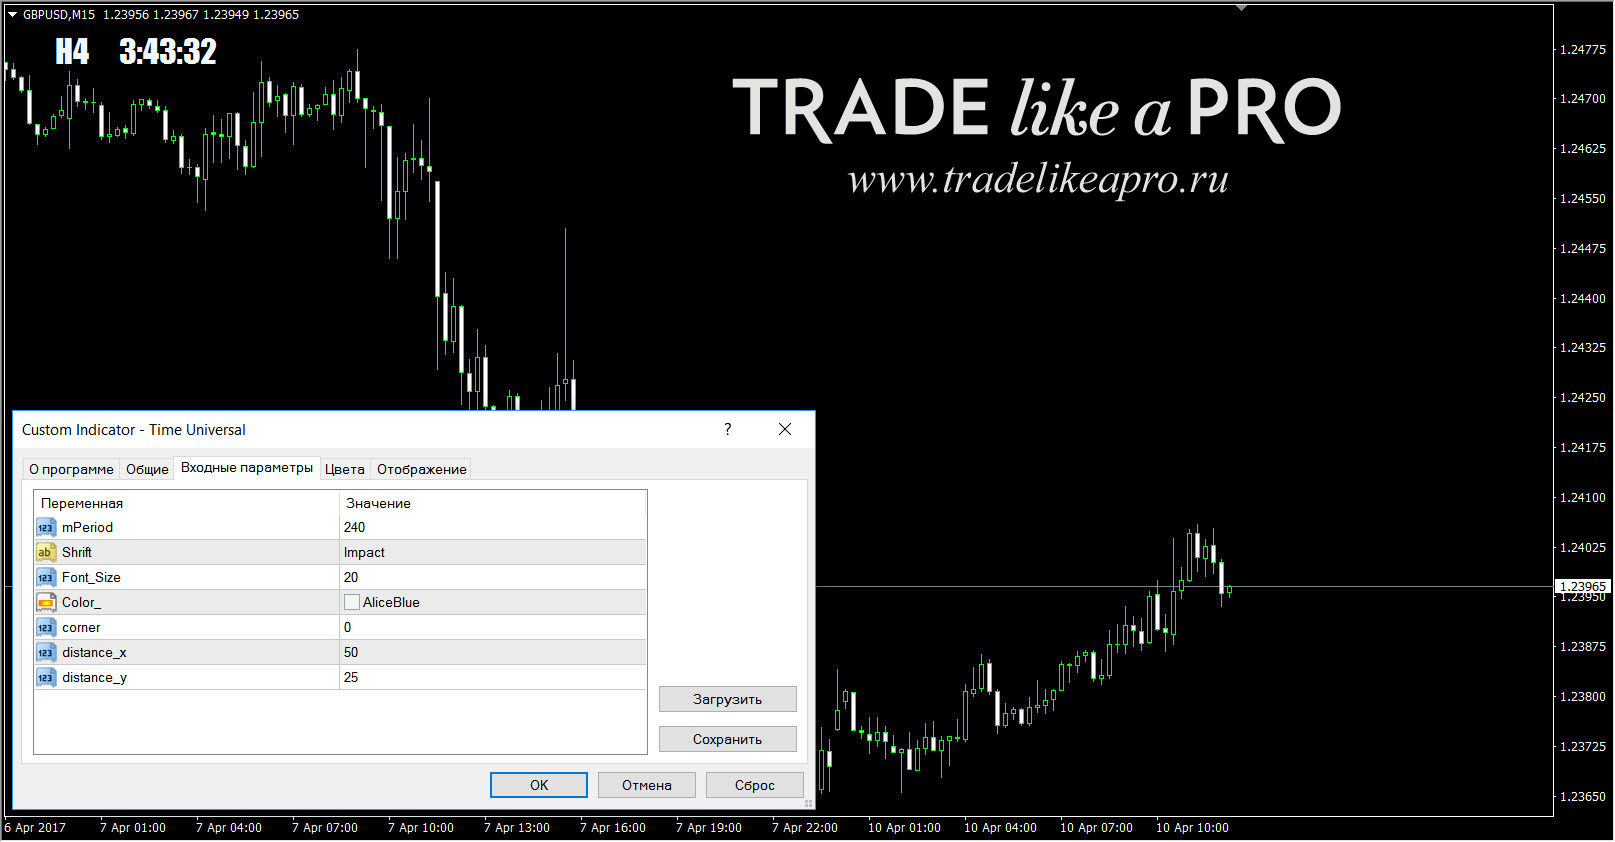
 Time Universal (Time Universal_fix) is an indicator that shows the closing time of whichever candle you need; it will not change the data when switching timeframes. In addition, the font, color, and size are chosen by the user. The Time Universal_fix mod has all the same features, only it is installed in the subwindow of any other indicator.
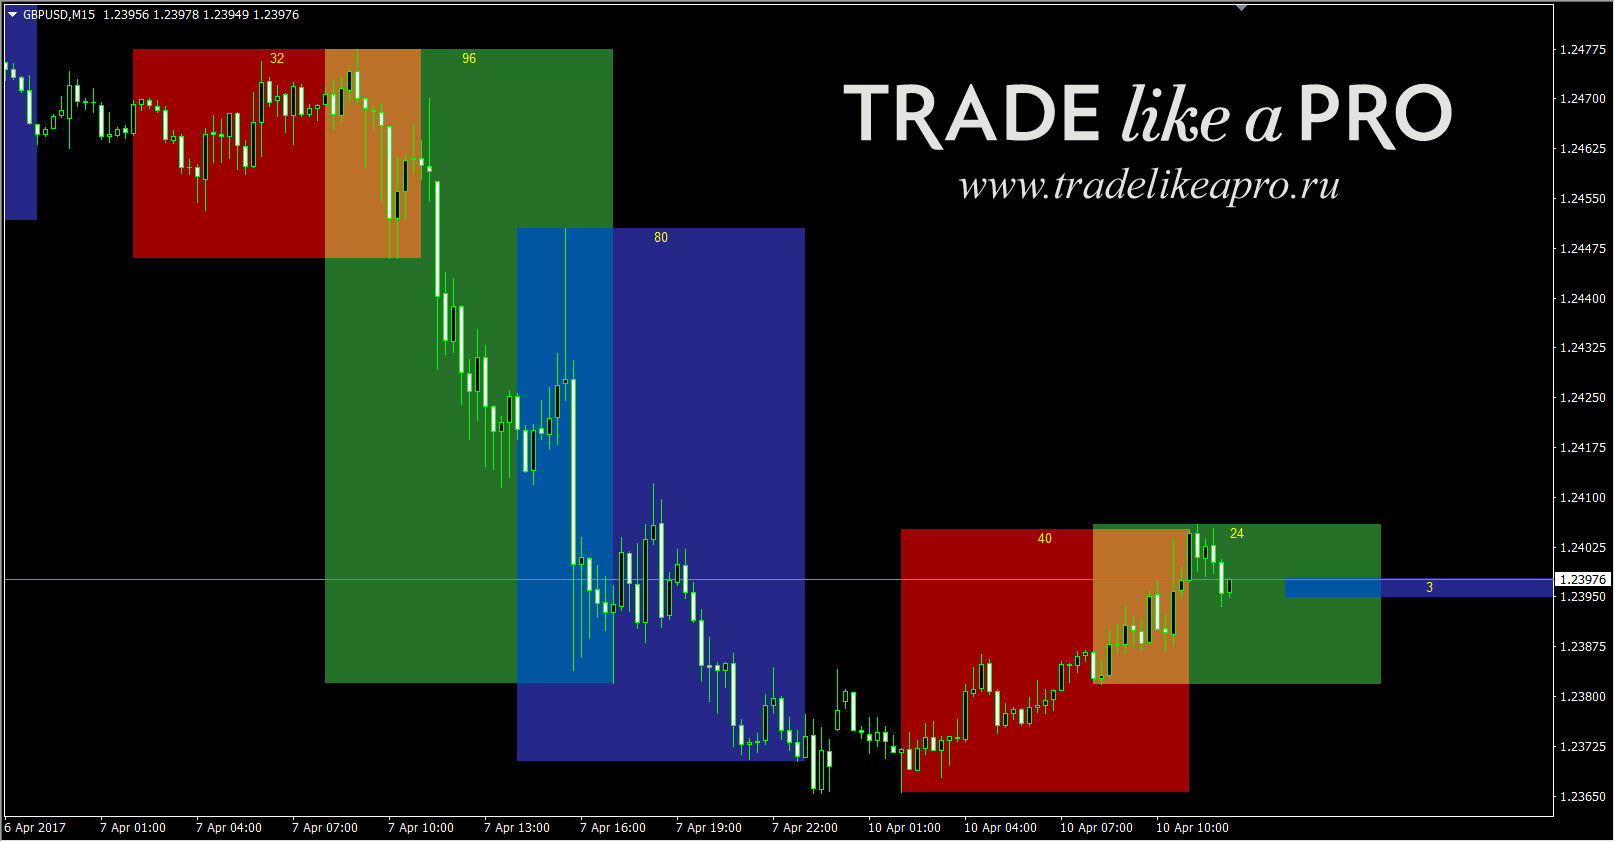
 i-Sessions-A is one of many session indicators. Each new version gets additional functions, for example, this one tracks movement in points for each session.
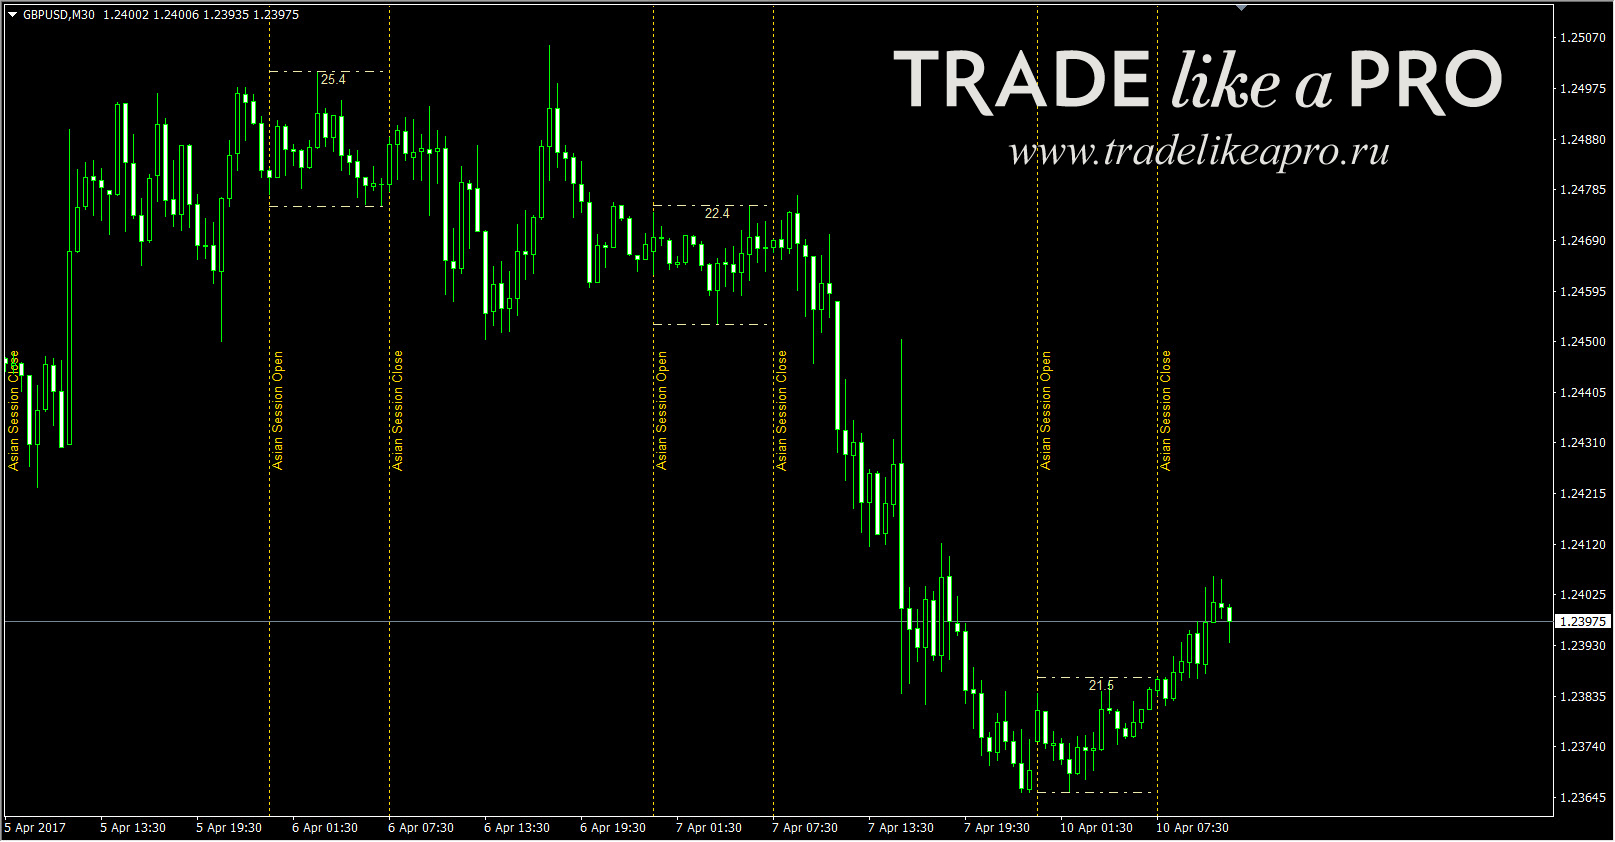
 Xi-AsianSession is an indicator specializing in displaying only the Asian session, when market movements are minimal, a paradise for all kinds of night scalpers. I will only say that there are quite a few such modifications; there are also indicators for the London and American sessions.
 The best-known indicators of this type are: Candle Time and Spread, Forex Market Hours GMT, i-Sessions, Market Hours, Xi-AsianSession.
News Indicators

"A certain amount of time remains until the news release," this is the kind of information you can see on many brokers' websites. Indeed, sometimes very important news is released such that the instrument's movement reverses and that trend lasts for months. For those who trade intraday, tracking the news using economic calendars or special indicators is fundamentally important. Agree, opening a trade five minutes before a Federal Reserve or ECB rate decision with a tight 10-point stop is foolish: even if you guess the direction of the news impulse, the widening spread will most likely close your position where there will be no price.
FFCal is undoubtedly one of the most famous news indicators, and there is a review of it on the site. In general, there are more than a dozen modifications of this indicator, and other news indicators have also been written on its basis, which can be downloaded via the link at the end of the article.
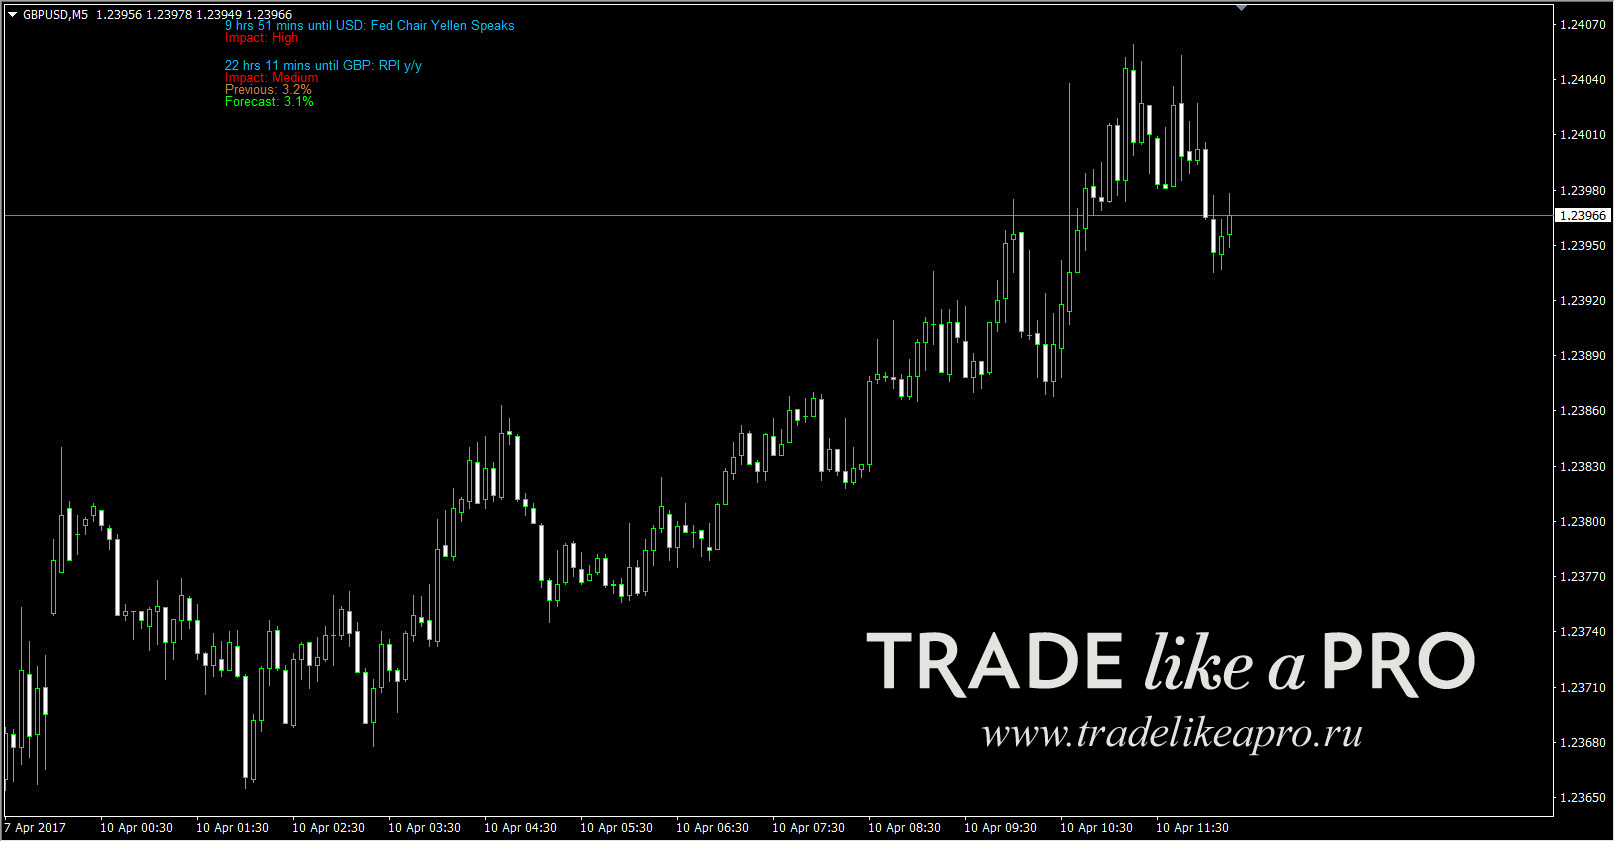 NewsInfo is a very substantial and multifunctional news indicator. In one of the versions there is an option to choose one of four (!) forex news provider websites. Another recent trend can also be seen: news indicators do not merely show news, but also have extra functionality for disabling expert advisors whose work may be harmed by news volatility.
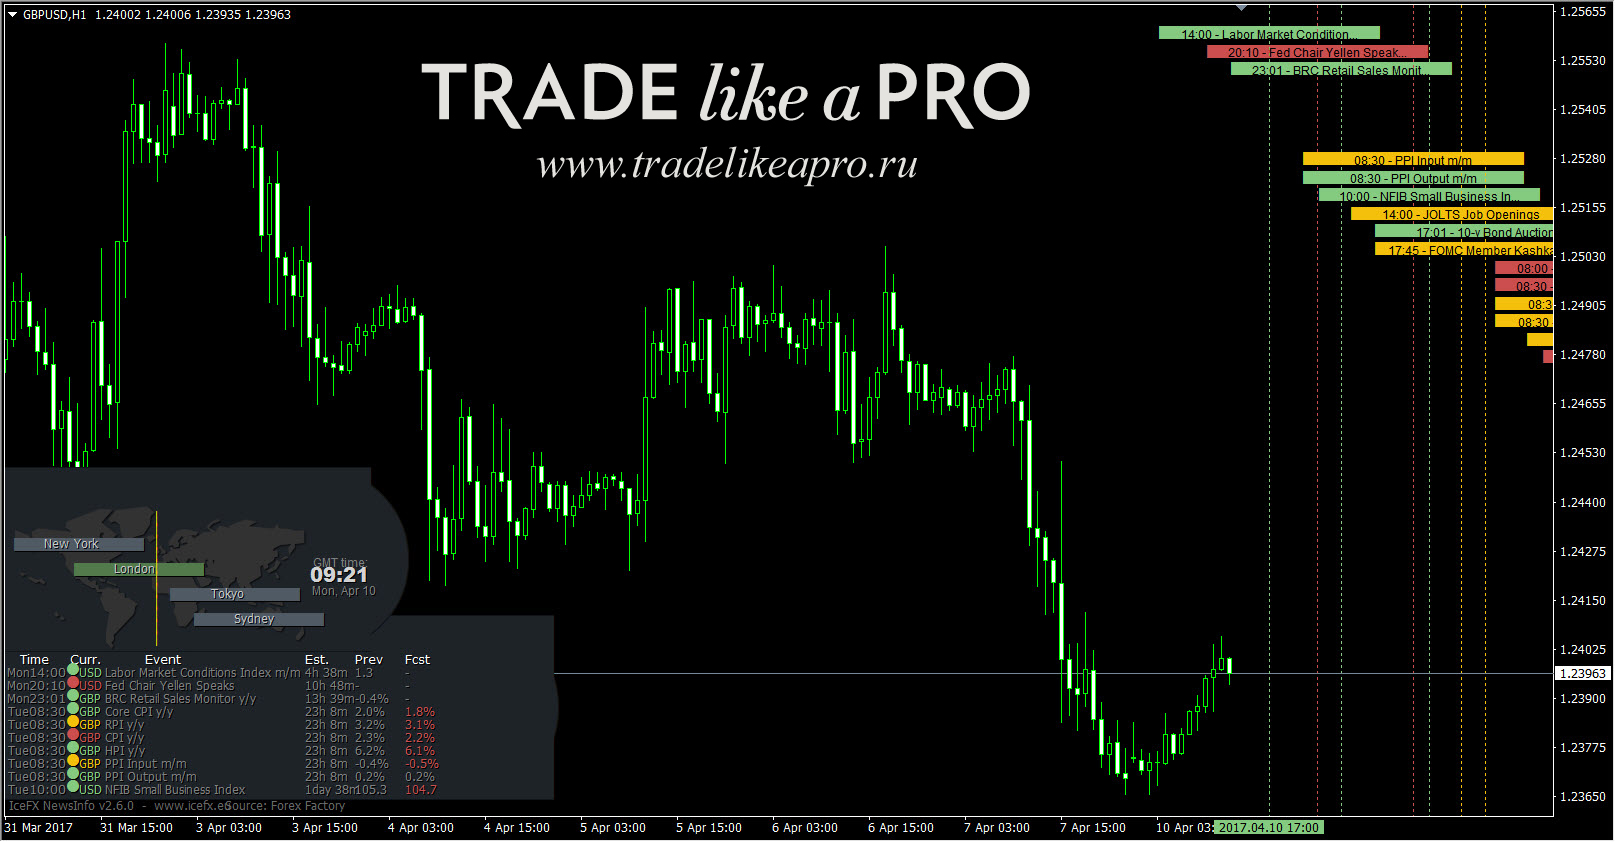 Truly News Indicator has the feature that you can choose to display news for specific currencies, that is, if you trade GBPJPY, then news on USDCNH is of no use to you, and you can also choose the news importance level, high, medium, or low, that will be displayed on the information board. In addition, news candles are marked with flags on the chart, which is very convenient. There is a detailed review of the indicator on our site.
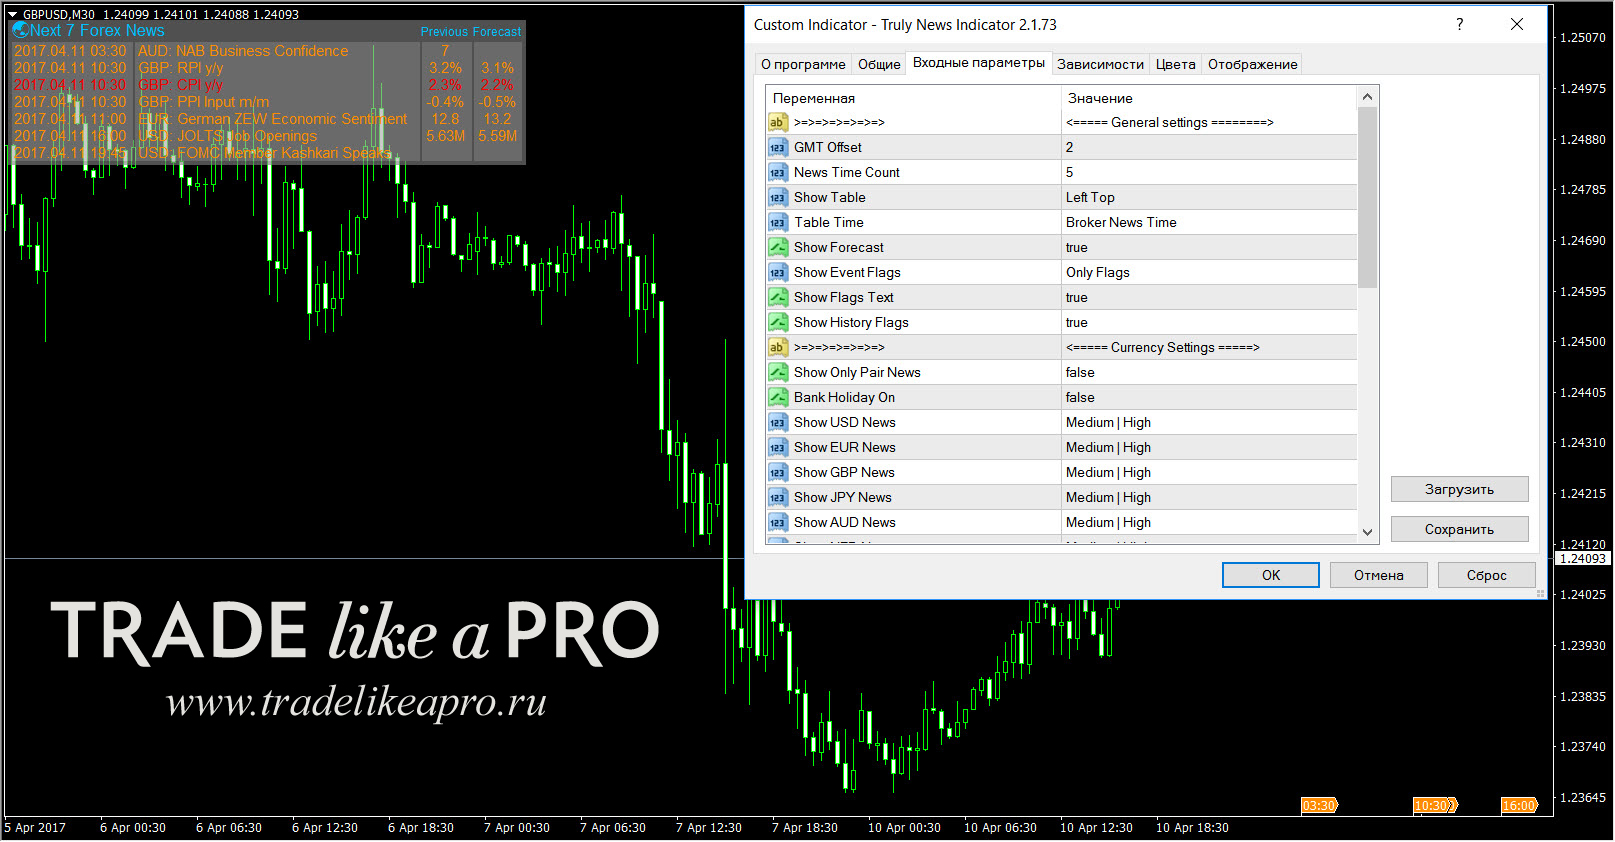 One more nuance in setting up news indicators.
a). Usually a trader learns about upcoming news from the economic calendar. Since everyone lives in different corners of the planet and every place has its own time, you need to determine the correct local time of the news release, because the news appears only once. As a rule, all calendars have a time zone setting, both in the popular English-language calendar from ForexFactory and in the calendar from our site.
b). Next we need to check whether the news time is true or not. It is better to take important news, such as interest rate decisions or speeches by central bank heads, when some significant movement may occur in the market. We look at the time until the news in the calendar, we look at the time until the news in the indicator: the latter either show the release time or count down the time until the news, and they can also mark the release point directly on the chart with arrows, flags, lines, labels, lines with labels, whatever settings the trader wants are available here. Everything is regulated and chosen.
c). And at the moment the news is released you will see an unusually large M1 candle on the chart, if you were watching the one-minute timeframe, you will see a strong spread widening, if you have an account with a floating spread, which most traders do, and all the more so with a special spread indicator you will be able to measure and record what your broker pulled on the Non-Farm Employment Change. And when everything matches up, the economic calendar, your news indicator, and the fact of the news release by local time, you did everything correctly. Remember these settings, or better yet save the corresponding template. Most indicators determine everything correctly automatically, but you should not rely only on the indicator, it does not hurt to check, so that by mistake you do not open five minutes before Non-Farm. If it turns out that the news has been released and the market has collapsed, but your indicator shows the event only an hour later, you need to change some parameters in the settings of the indicator itself, some kind of Offset Hours, it is called differently in different indicators, and everything will be fine.
The best-known indicators of this type are: FFCal, NewsInfo, Truly News Indicator, Urdala_News.
Profit Indicators

Based on the results of completed trades, it is fundamentally important to know your trading statistics: how many profitable trades there were, how many losing ones; profit/loss in points, percentages, deposit currency, and so on. Statistics in trading are everything. Of course, services like Myfxbook help traders a lot, but in that case you need to go to a third-party site, and sometimes they also freeze, and wait for the data to update. But with the use of statistical indicators, we get all the information we are interested in right in the terminal, here and now, quickly.
i-Profit is one of the most popular indicators for tracking profit/loss in points and percentages, and it is analyzed in detail on our site. In view of its popularity, there are quite a lot of its modifications, they can all be downloaded from the link at the end of the article.
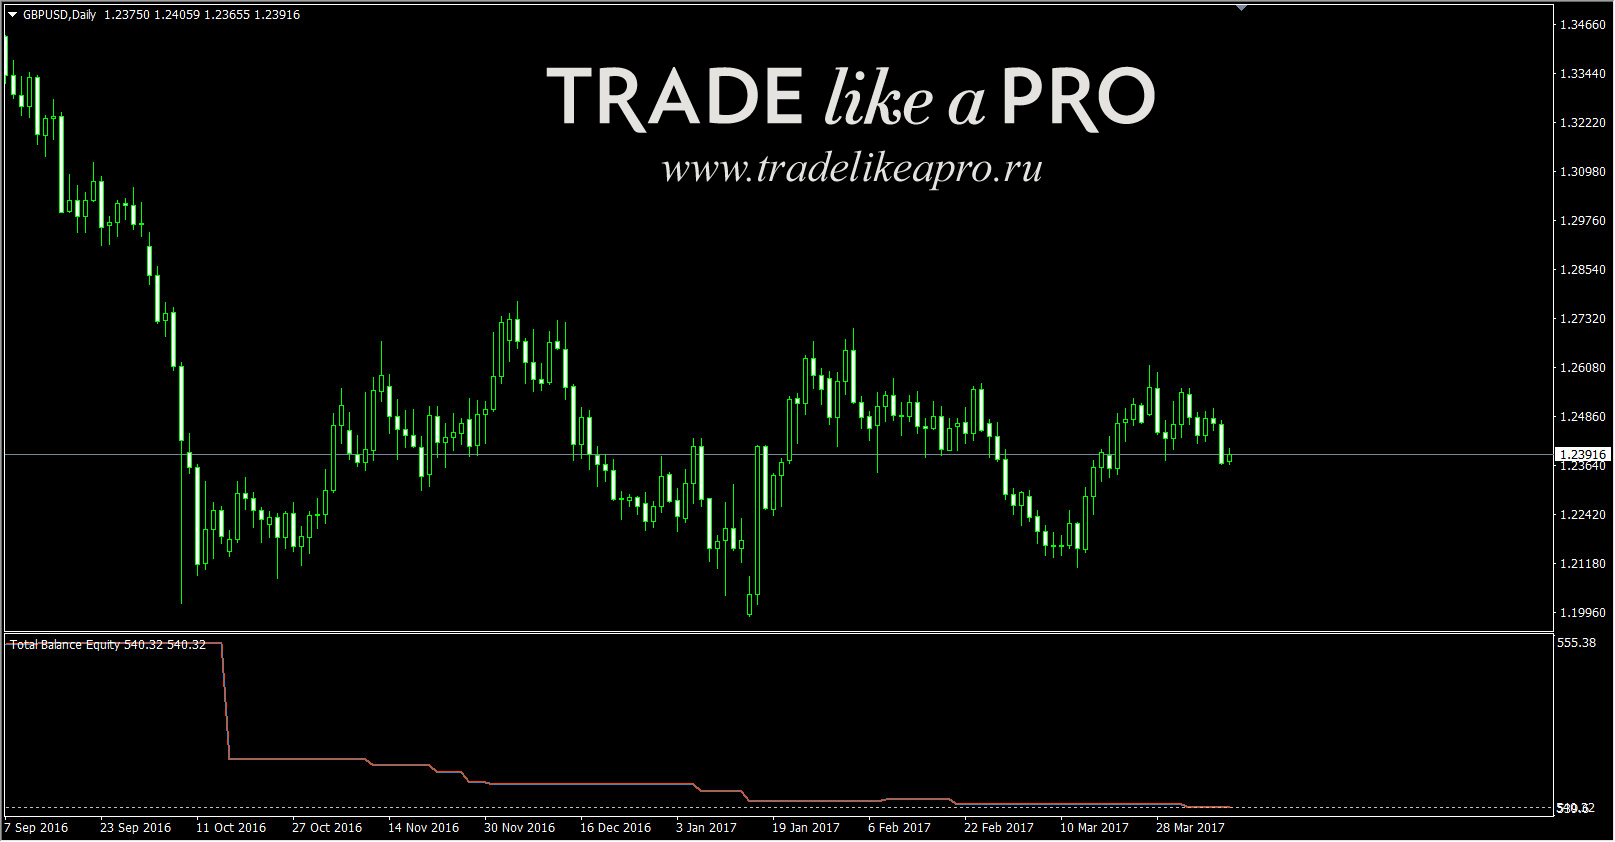
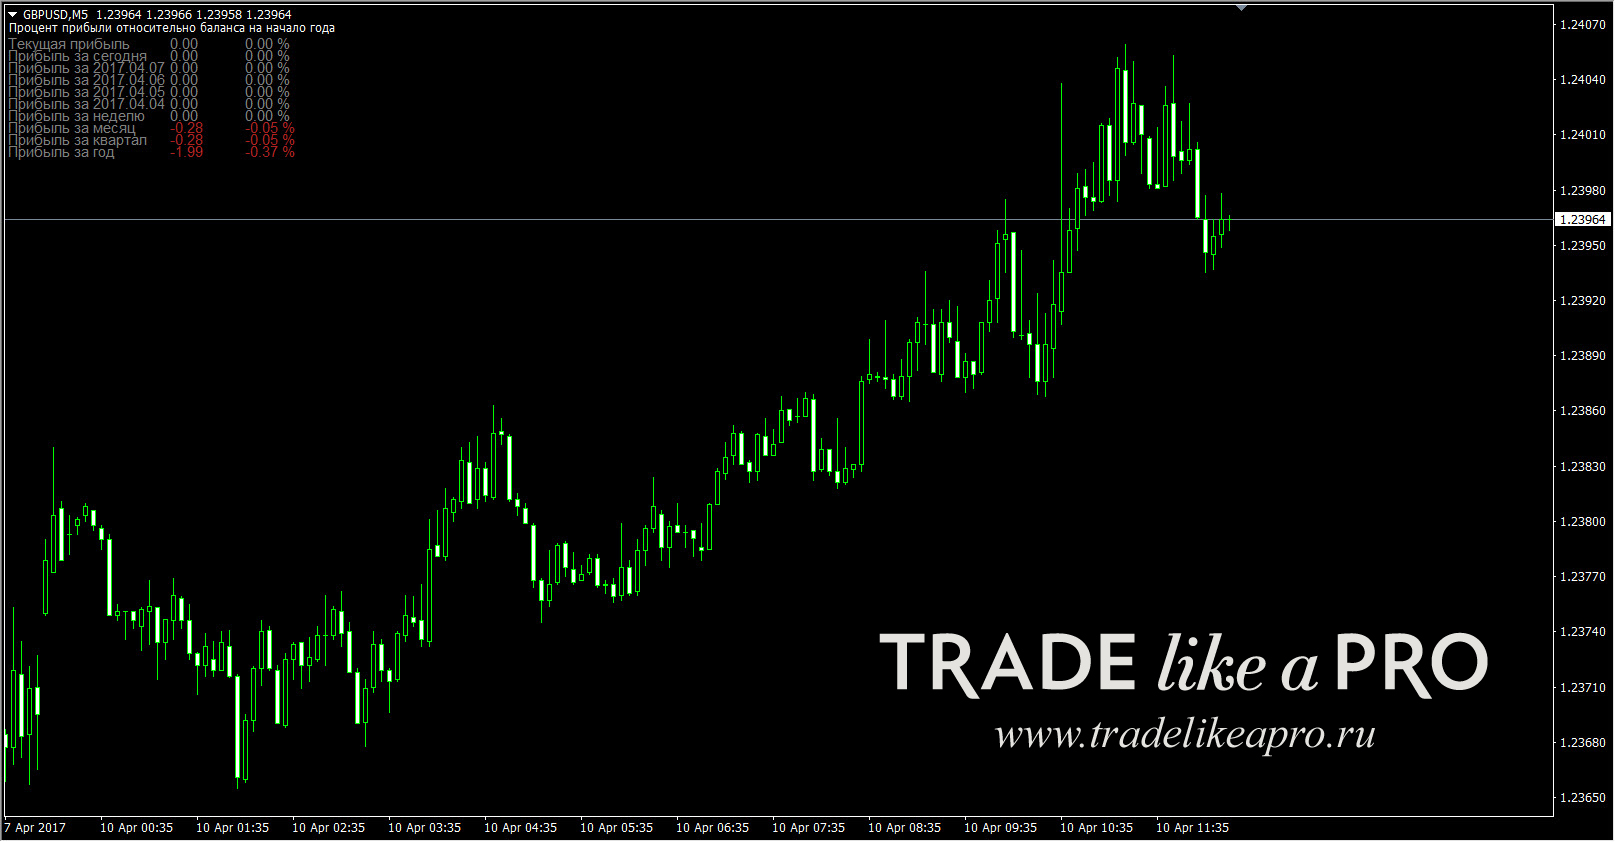 Equity is an indicator that draws the deposit growth/decline line right in the lower pane of the instrument chart. In essence, everything there is the same as in Myfxbook monitoring. For example, if trading without stops and with averaging is used, here, just like on Myfxbook, we will see the divergence of the equity and balance lines, in traders' jargon, "snot".
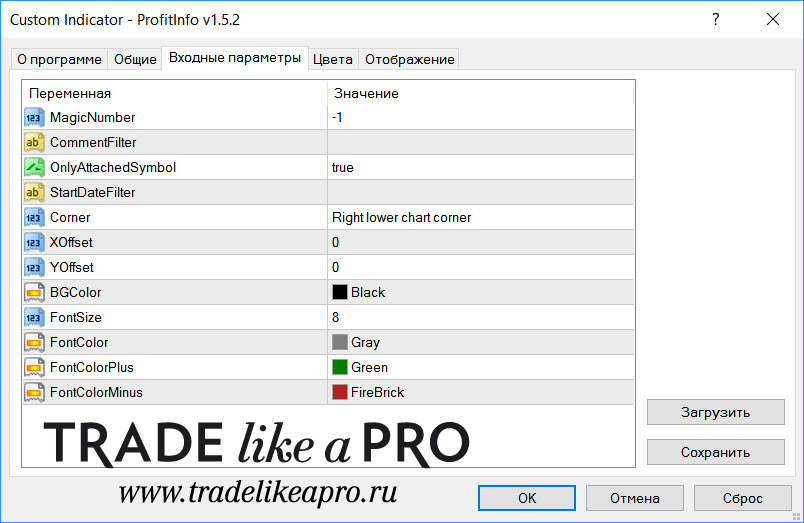
 Let us consider another case: trading on one account was carried out by an EA and manually. As a result, we have many trades and it is unclear who has what result, who traded better, the robot or the person. In that case, you need to count separately the orders opened manually and the expert's orders. This can be done in the following way: every order has a Magic Number, for those opened manually it is usually 0, zero, and for those opened by robots it is some number, for example 2222, which can be viewed in the EA settings. In an indicator, for example ProfitInfo v1.5.2 , in the screenshot below,
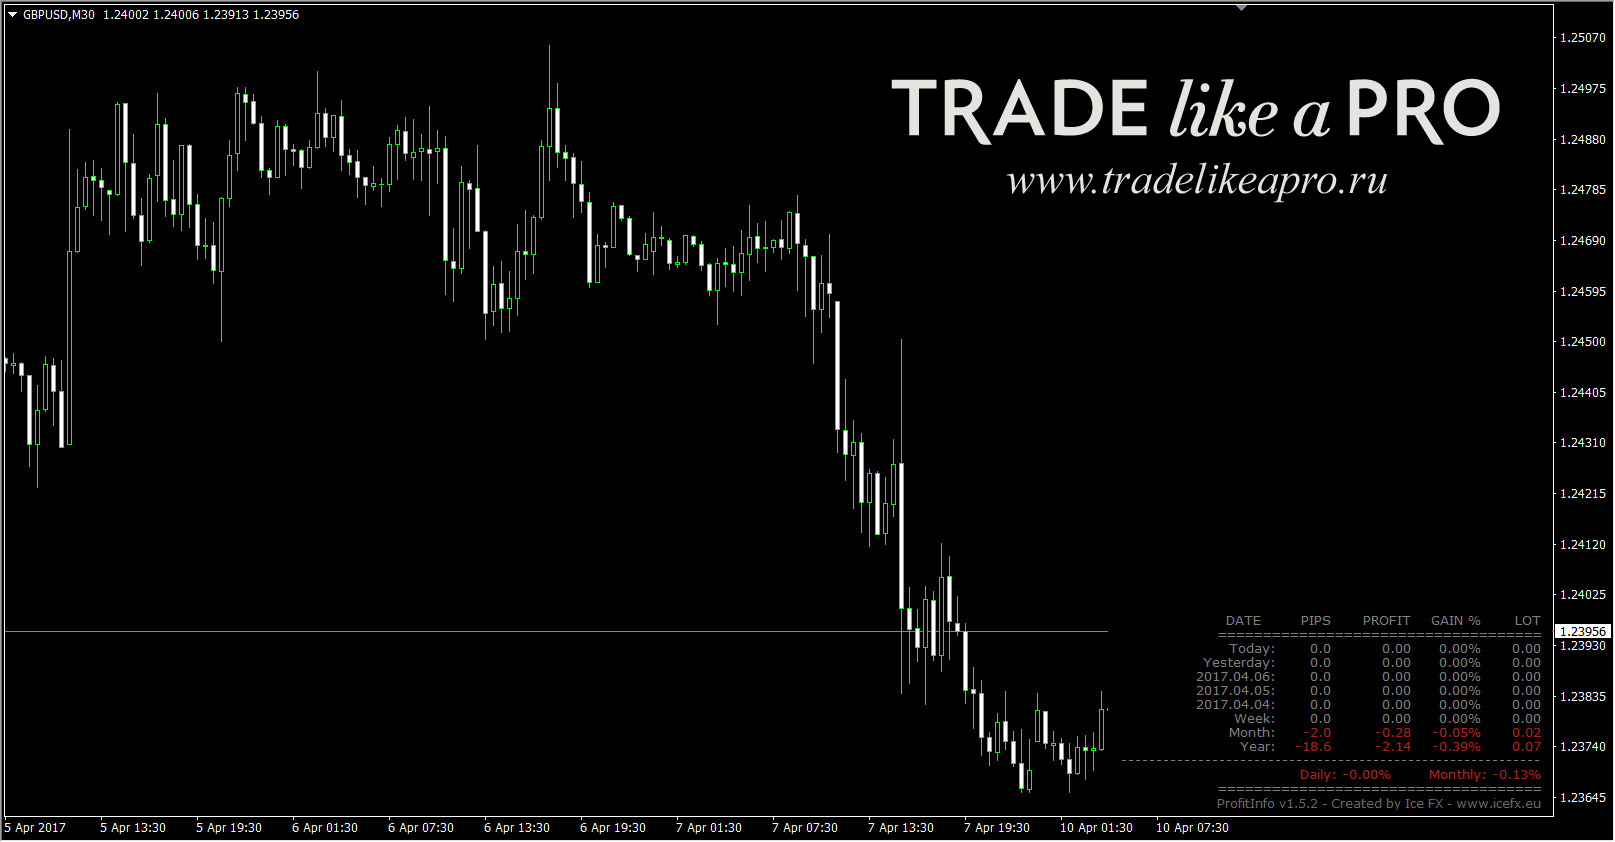 we choose a filter by magic number, the top settings line; a value of -1 means that the indicator takes absolutely all orders into account, and it will count only those orders that have the Magic we are interested in. Or you can look at and count orders by a specific comment, the second settings line from the top. When opening a position manually through the terminal tab "Open order" you can write your own comment, or you can choose not to. But EAs, as a rule, always write their own comment to orders. Again, the expert's comment can be viewed in the settings. In addition, all comments on orders can be seen in the account history; to do this, you need to right-click on any field and tick the box next to the word "Comment". Then we enter the comment we are interested in into the indicator, and it will show the result in points and percentages only for those orders that have the comment we are interested in.
 The best-known indicators of this type are: Equity, i-Profit, Stats_Indicator, TradeHistory.
Lot Size Calculation Indicators

As is well known, money management in forex is half the success. Despite the fact that hundreds of books and thousands of articles have been written on this subject, a great many market participants continue to lose deposits because of inadequate MM. Moreover, most quite understand that risks of 5-10-15 % per trade can easily deprive you of your deposit. Indicators for calculating lot size are designed to help the trader determine an adequate amount of risk relative to the size of the deposit and the size of the stop order. In addition to the percentage risk set, one should not forget such a phenomenon as slippage: stop orders may be executed a point or two worse, and you will lose a little more, and if your stop falls into a gap or news, it may be executed at 2-3 times more than you set. The market is unfair, remember that.
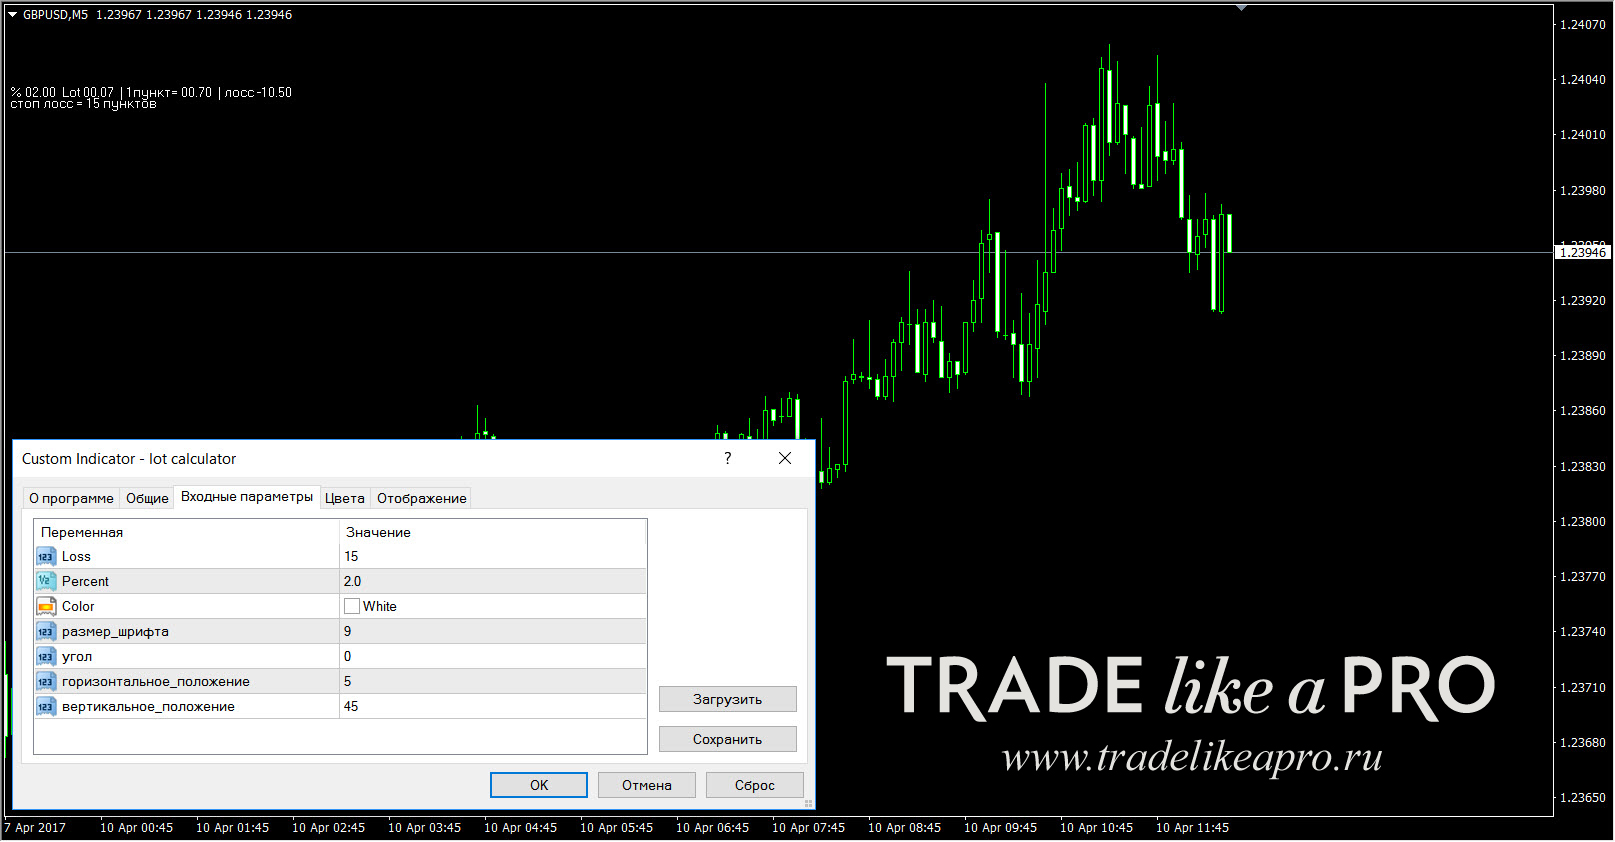
lot calculator is an indicator for calculating lot size relative to the stop order. Its position can be changed in the corners of the chart. In the settings we specify the stop size in points and the risk in percent, and the indicator does the calculation itself: it will calculate the lot size, indicate the price of one point for such a lot, and calculate the potential loss if the trade turns out unsuccessful. You can choose the color and font size.
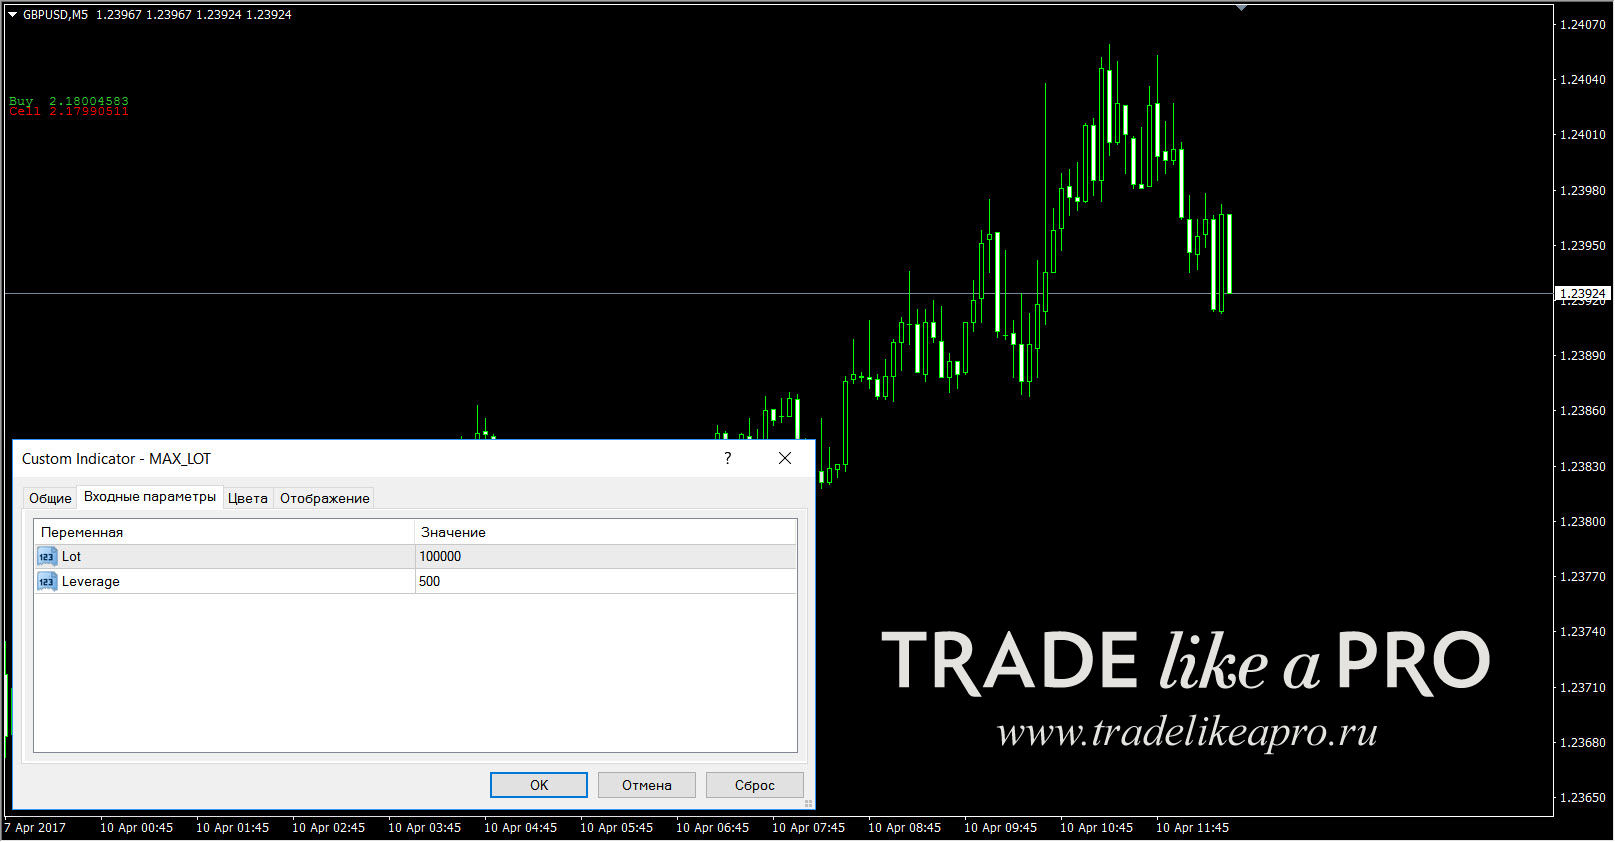
 MAX_LOT is an indicator that calculates the maximum lot for a single trade, as they joke on our forum, an all-in risk, taking the leverage size into account. The leverage setting can be set to any value and the data will be recalculated.
 The best-known indicators of this type are: # Lot, # Deposit Risk, lot calculator, MaxLot, MoneyManagement.
Spread and Swap Indicators

Keeping an eye on the size of the spread, the difference between the buy and sell price, is fundamentally important for intraday traders and for M1/M5 scalpers. For them, the smaller this value is, the better. The size of the spread, which may be fixed or floating, depends on the account type and the market situation. In general, it is worth knowing when spreads are especially large, and intraday traders should not enter the market at such moments; this does not apply to those traders who trade on D1, where stops and profits are measured in hundreds of points and there is no sense in worrying about a 2- or 8-point spread:
- on Monday in the first minutes after the market opens;
- on Friday in the last minutes before the market closes;
- during the transition from one day to the next, every day;
- important news, interest rate decisions by central banks, speeches by central bank heads and presidents of some countries, and so on;
- force majeure situations like Brexit or the fall of the Swissy.
At all other times, the spread, as brokers state in the trading conditions for ECN/NDD/STP accounts, can be almost zero, or within half a point (using the well-known EURUSD pair as an example).
IND Monitoring - the indicator displays the spread as a histogram. Here you can see, especially during the news, how the bid and ask prices diverge on a specific instrument.
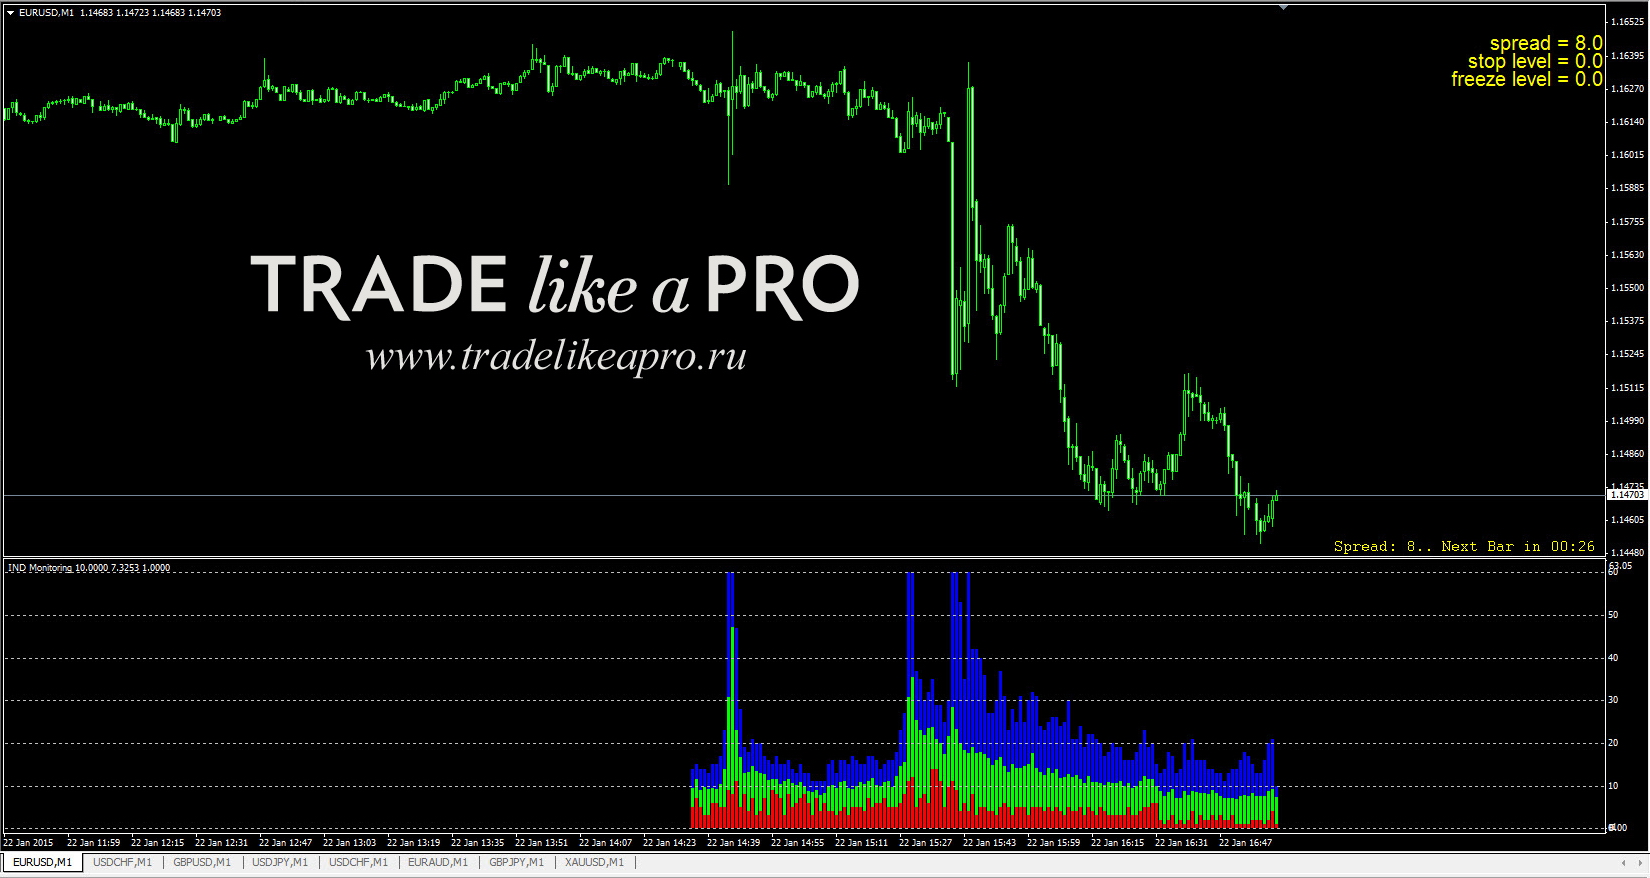 In the example above, besides the specified indicator (in the lower pane), two more spread indicators are installed as well, to measure it online. As can be seen from the histogram and the huge M1 candles, important news on the EURUSD pair was released and the spread was greatly widened by the broker.
CandleSpread_modern - besides the spread value, the indicator also shows the time until the candle closes. One of its features is that in the settings you can set a certain spread threshold (the top settings line), above which the indicator readings will be displayed in red (the color is also selectable) - a very useful function for intraday traders - a kind of red traffic light - the spread is large - it is not worth getting into the market (and sometimes that happens). Everything is configurable here - the size/color/font name.
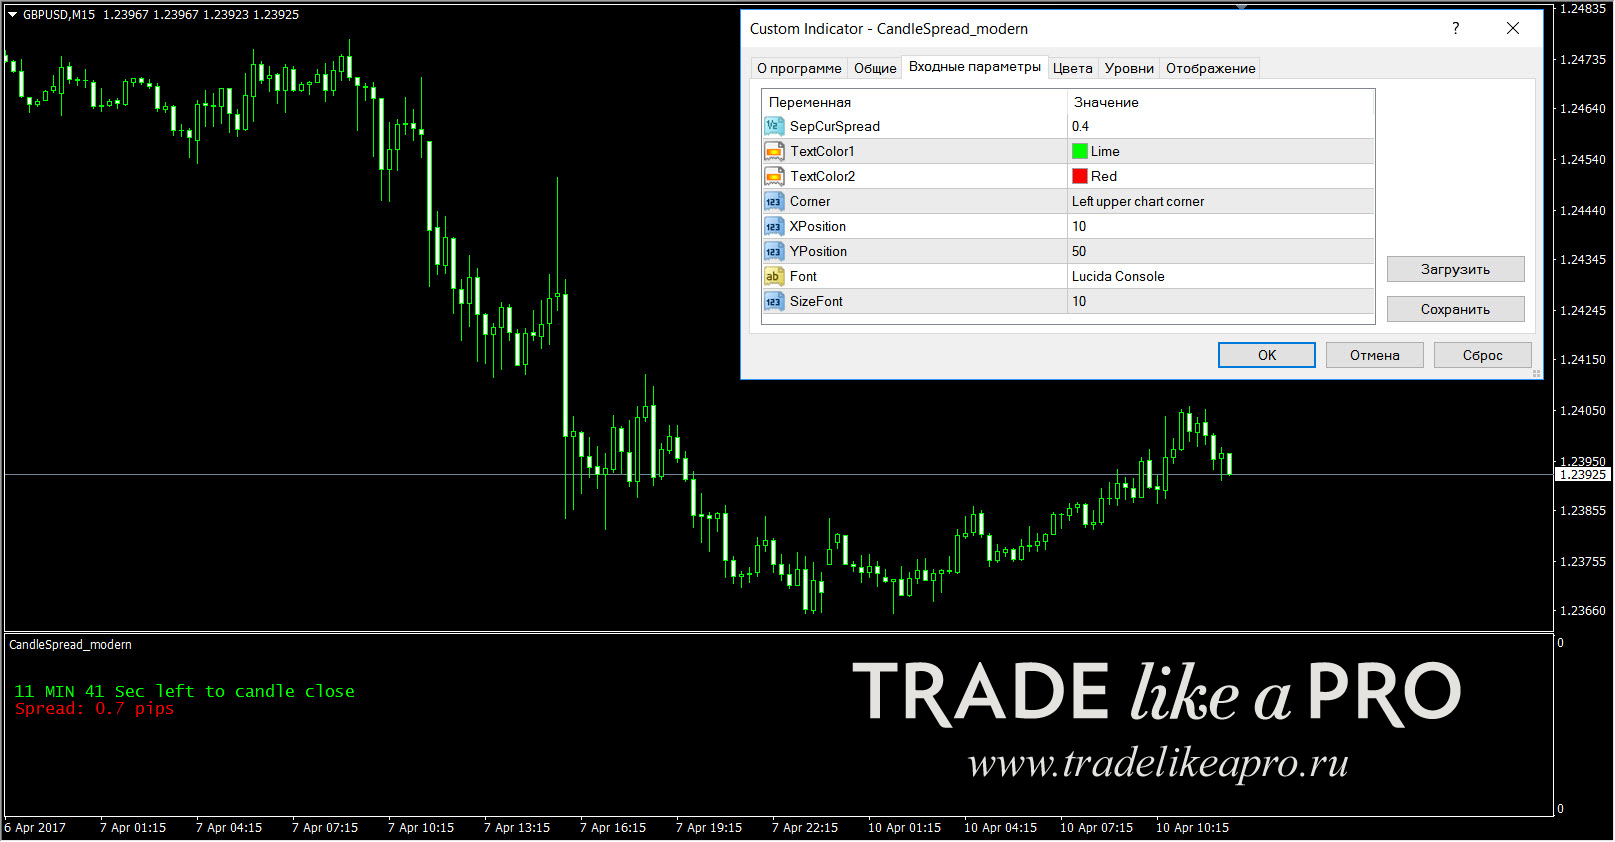 There are quite a lot of spread indicators. Some of them display a fixed numerical value online, others show the readings as a histogram in the lower pane - that way, you can look back through history to see what spreads the broker gives during the day, on different account types, on different instruments, and compare spreads across different brokers. I even put together a Spread Monitoring TS for this purpose. There are also indicators that write all this information to a file - it can be useful when testing some expert advisors.

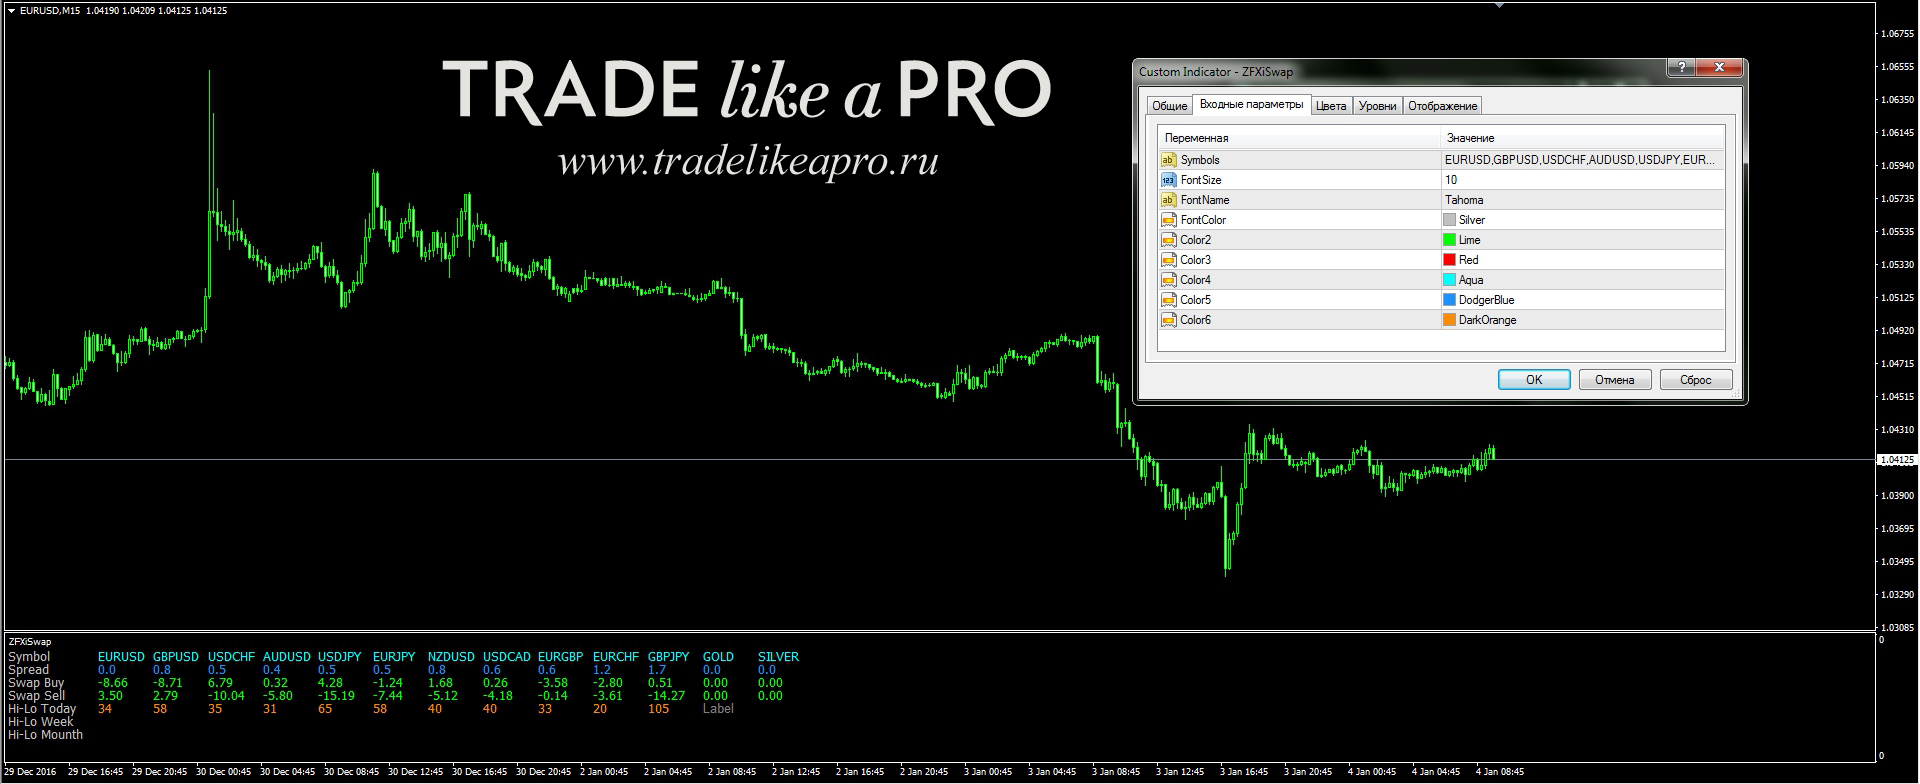
Swap is the fee for carrying a position overnight. First of all, such information may be relevant for long-term traders who hold a position for several days or weeks - in the end, the amount charged can be a pleasant addition to the trade amount (if it is positive for your position). A swap can be positive or negative; as a rule, in the middle of the week it is charged at triple size (for example, at Alpari the triple-swap day is Wednesday). Information about swaps can be found on the broker's website in the trading instrument specifications, or you can right-click the instrument in your MT4 terminal and select "Specifications" to look there. Or you can simply use a specialized indicator.
ZFXiSwap - the indicator shows swaps (and not only swaps) for several instruments at once.
 spread swap - spread and swap, simple and without frills.
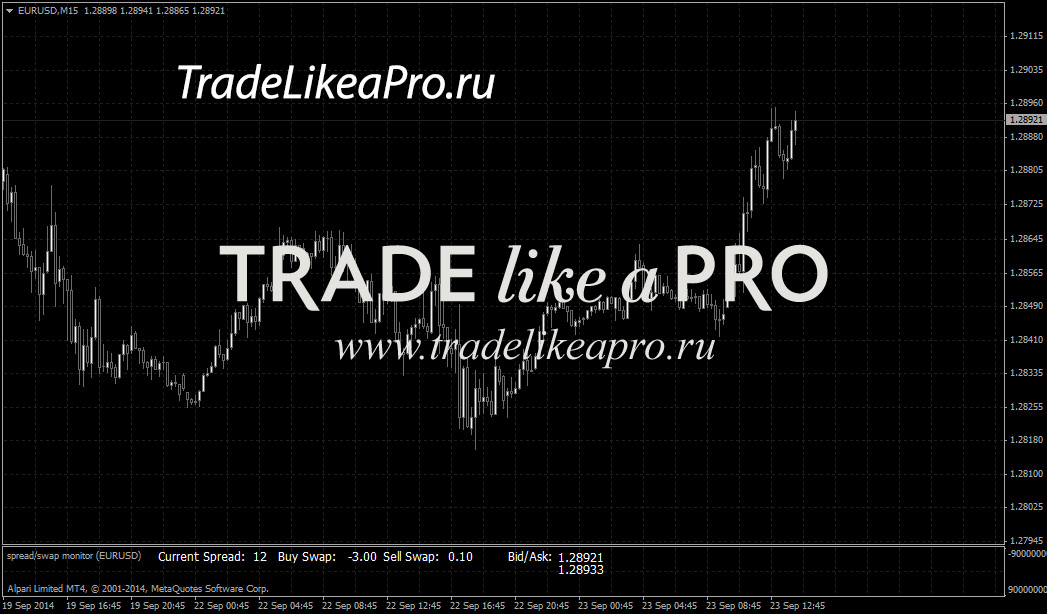 The best-known indicators of this type are: Candle Time & Spread, Candle_Spread, IND Monitoring, Spread History, spread swap.
Higher Timeframe Candlestick Indicators

In many strategies, before opening a trade you need to check the situation on a higher timeframe - as is well known, the larger the timeframe, the stronger and higher-quality the signal. And if you have several currency pairs in work, having to open two or even three charts with different time intervals and switch between them from time to time would be quite inconvenient. But there is a solution - indicators have long since been developed that can show candlestick and bar charts from different instruments and timeframes on the main working chart - the one where you open positions.
stratman-minichart - one of the most well-known, covered in detail on our site. I can only say that the indicator is quite popular and there are many different modifications of it - but they are similar in functionality and control, and you will not have any problems with setup.
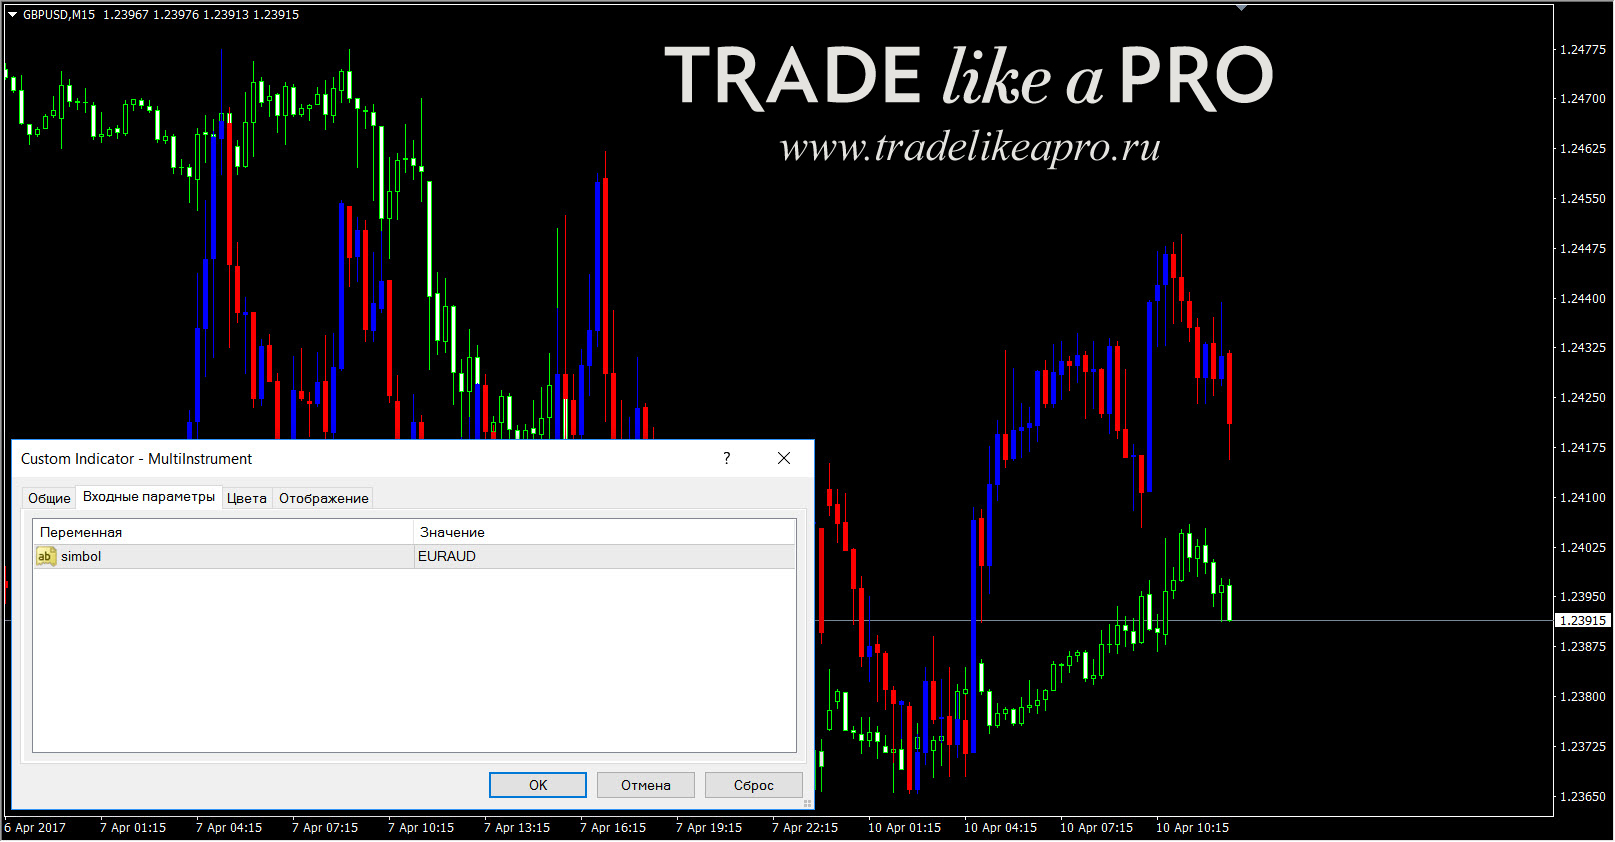
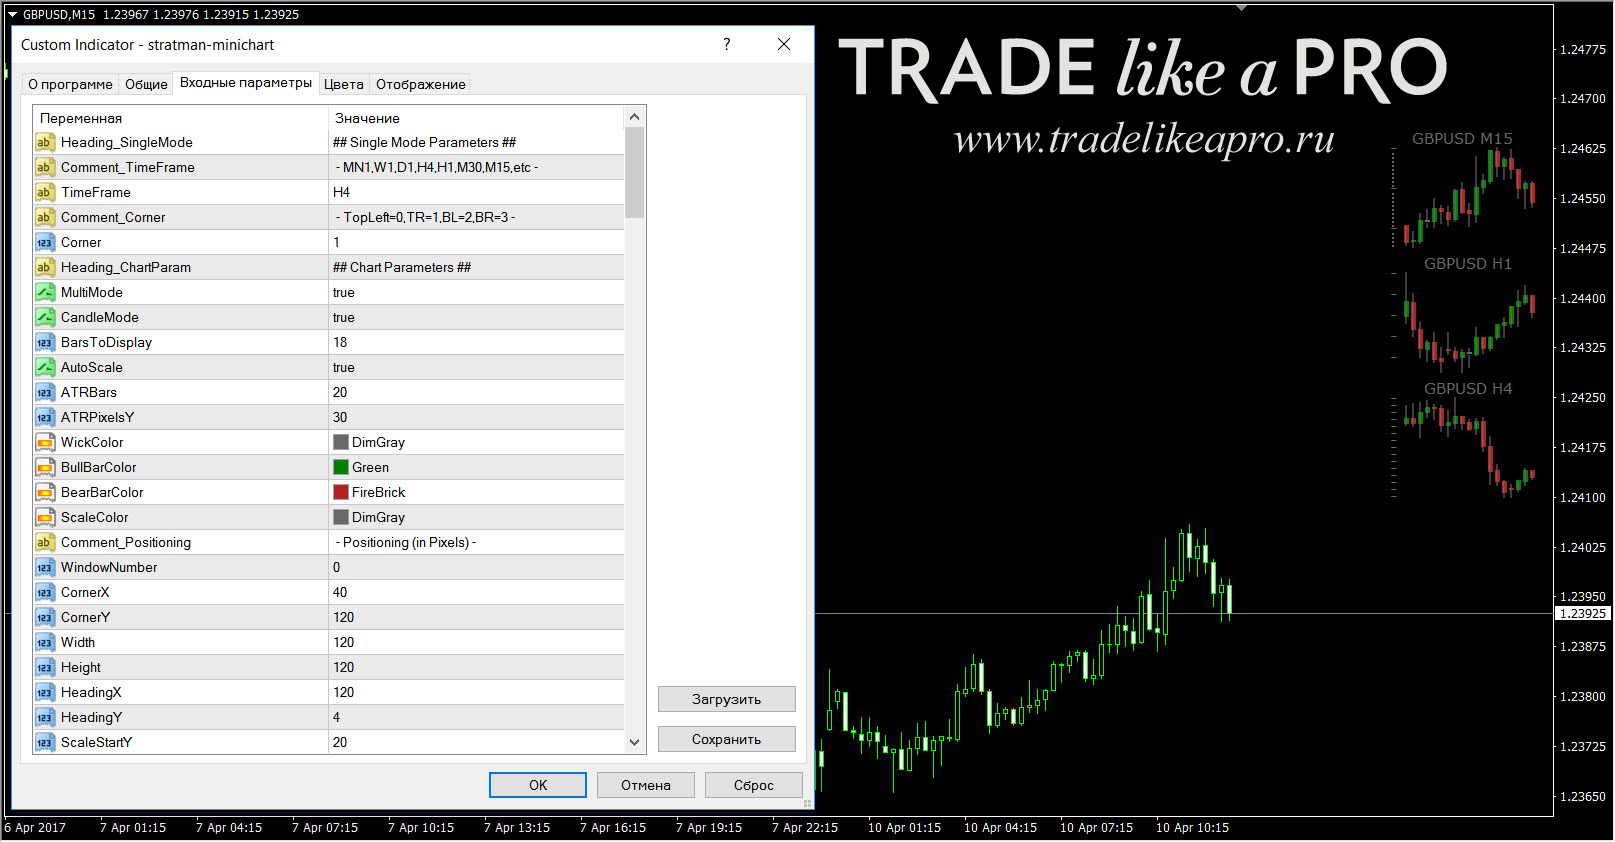 MultiInstrument - the indicator will show, right in the window of your instrument, the chart of the instrument that you type into the settings (in the example below, the EURAUD pair is shown on the GBPUSD chart). Convenient.
 MCP Multi Charts - this indicator will be located in the lower pane and show several charts of different currencies at once, indicating OHLC prices - open, high, low, close...
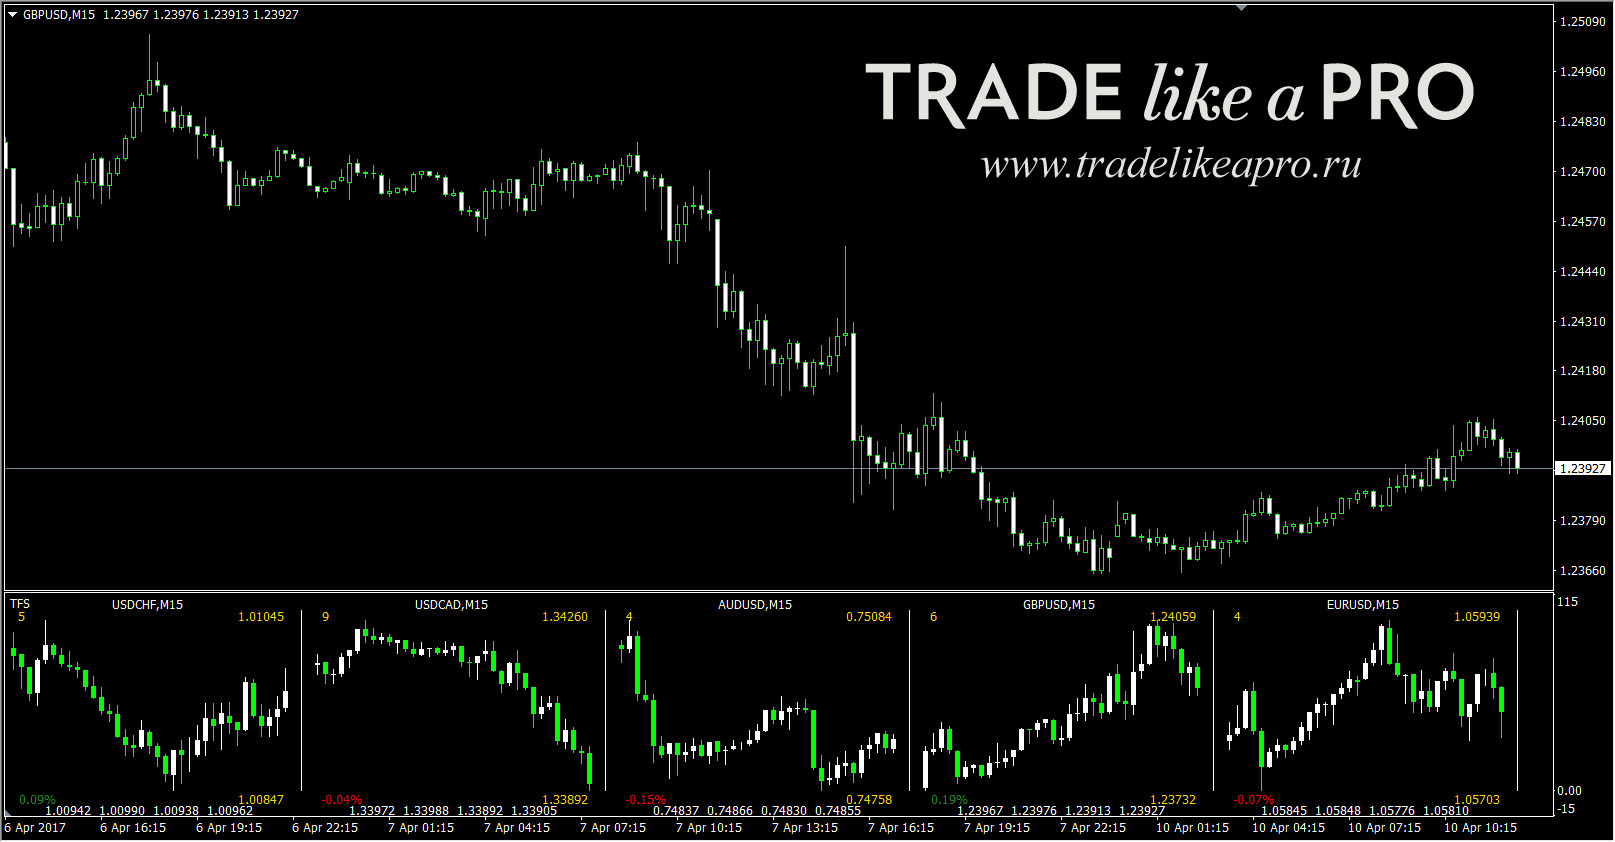 There are also modifications where, in addition to displaying other instruments, you can use some technical indicators - not just the USDJPY pair on the pound chart, but also framed by some moving averages or together with the Parabolic indicator. In a word, the trader's choice here is huge.
The best-known indicators of this type are: stratman-minichart, OverLayChart, MultiInstrument, MultiCharts.
Information Panels

For those who do not want to clutter the chart with several info indicators, information panels have been created - where all the necessary data for work is in one window, and everything can be adjusted and configured. Thus, one indicator replaces several at once. There is a huge number of info panels; we will look at a couple of them here.
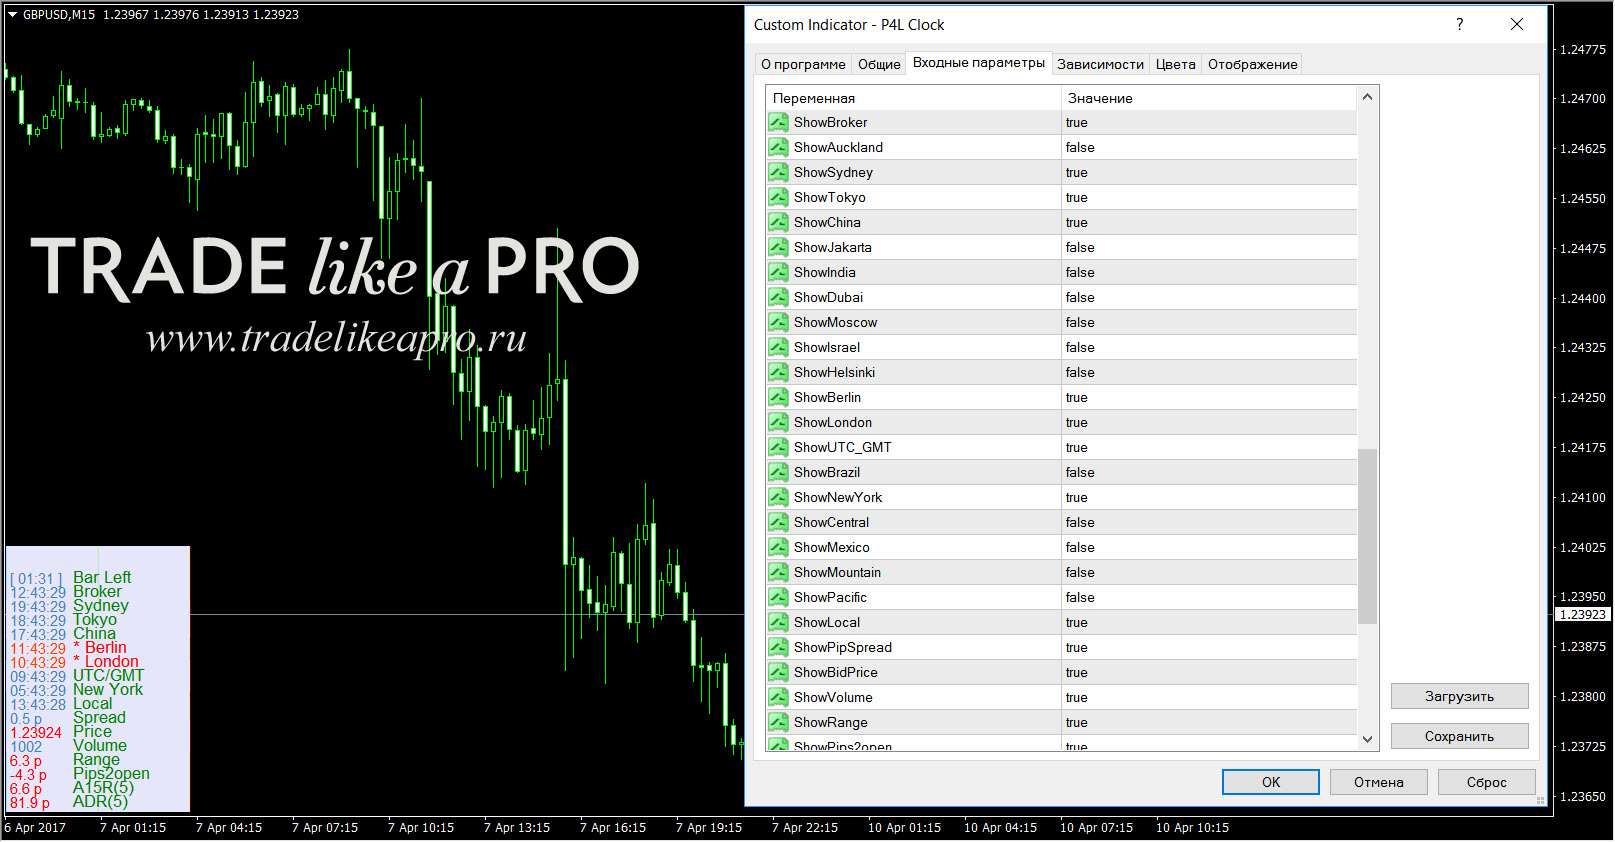
P4L Clock - this panel has time, spread, ADR, and much more. The special feature of the indicator is that literally every line can be turned on or off - this way we keep only what we need. There is no need to talk about placing it in any part of the chart or in any lower pane of another indicator - all that is implemented here.
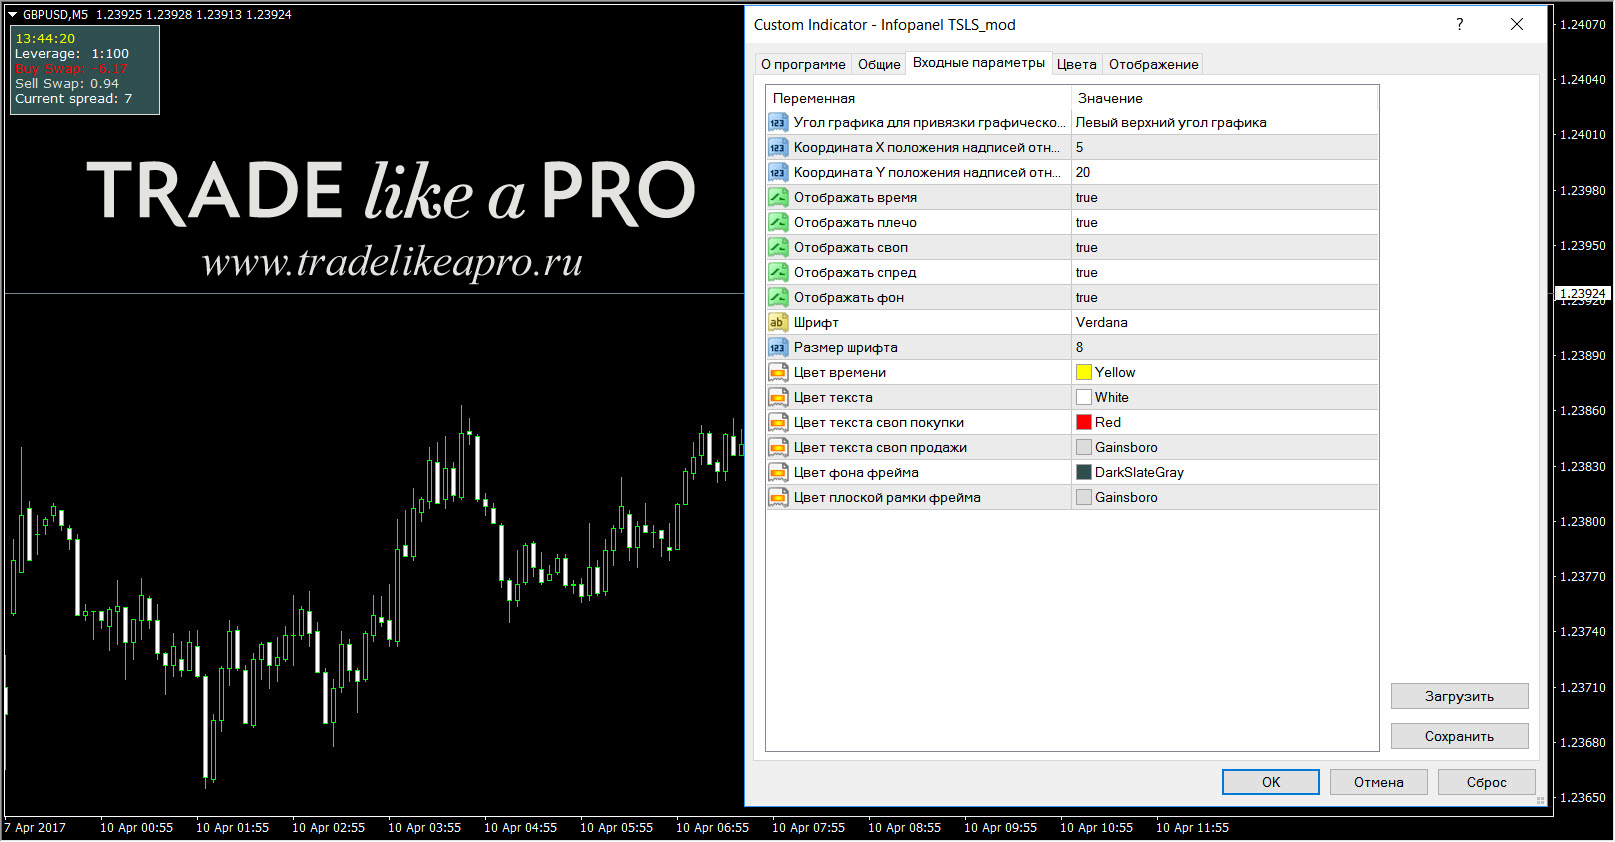
 Infopanel TSLS_mod - a very simple and unpretentious little panel - in one window we have the spread, swap, current time, and information about leverage.
 The best-known indicators of this type are: Bid_View2.0, i-NASA, infoboard, InfoPanel, Stat Informer.
Various Useful Indicators

Besides the indicators discussed above, there are quite a few useful goodies that may come in handy for a trader in one way or another. For example:
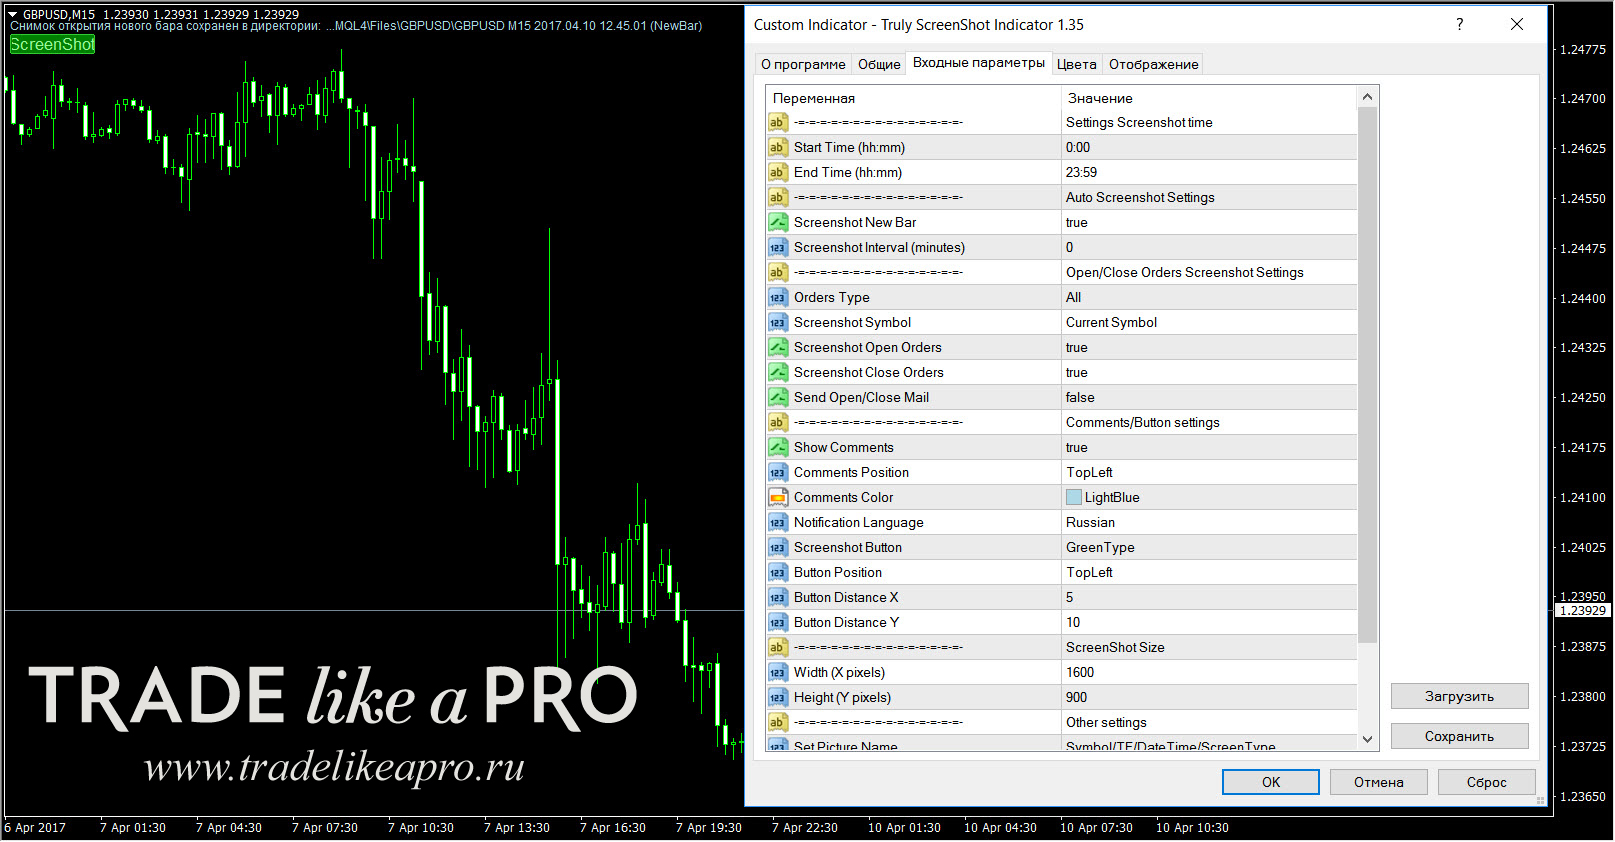
Truly ScreenShot Indicator 1.35 - a screenshot indicator that is covered in detail in one of the materials on the site. No one will argue that sometimes it is very important to take a screenshot of the screen - to capture your trade, perhaps record some kind of broker error caused by an excessively large spread, and so on. There can be many situations. Another plus is that there is no need to install third-party programs on your computer, configure them, or look for the folder where the screenshot was saved. Here, everything works just like with a regular indicator. In addition, this indicator can take screenshots automatically according to a specific algorithm set by the user - that is, even manual intervention will not be required; everything will be done as specified by the trader.
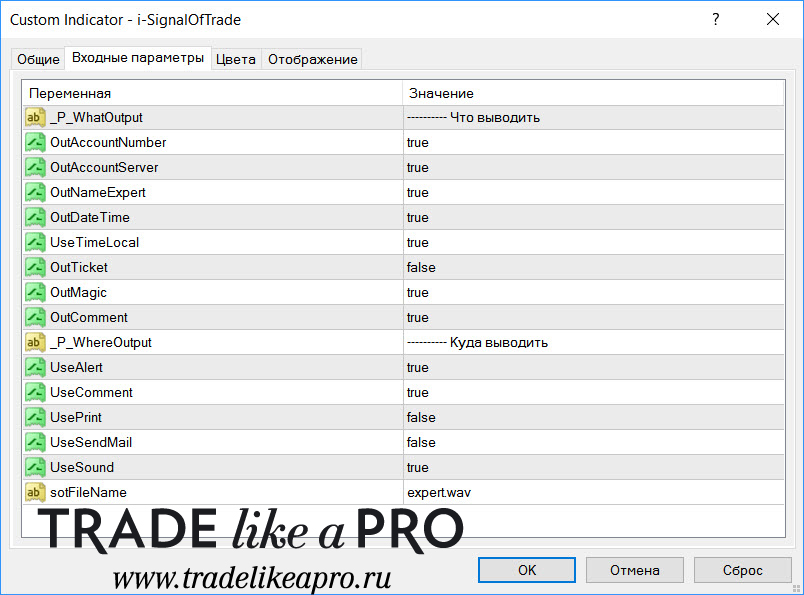
 i-SignalOfTrade - the indicator informs the trader about all events on the trading account (for example, you subscribed to signals and want to monitor the copying/trading process so that the manager does not blow your deposit). First, it catches any trading event, any trading operation on your account: opening positions, placing orders, modifying stops and takes, partial and full closing of positions, stop/take triggering. Second, the indicator outputs information about the event in five different ways.
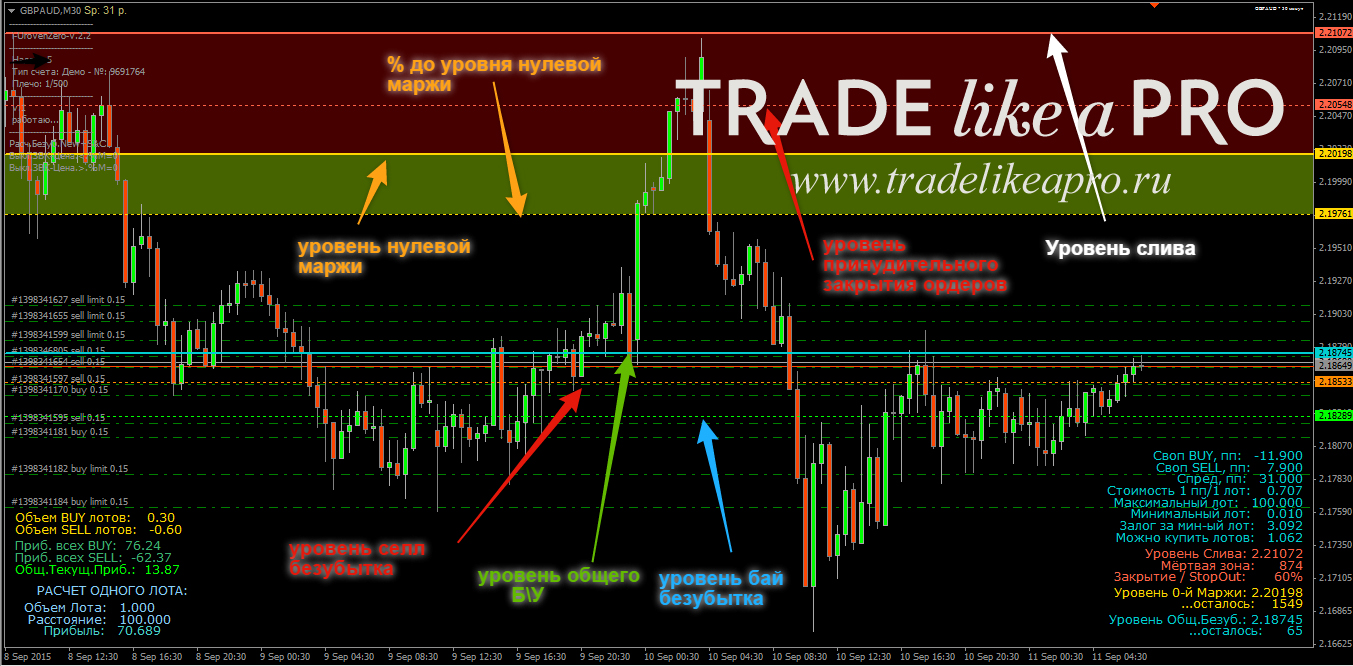
 i-UrovenZero (and various modifications) - a very useful indicator for those trading grids and locks manually; it shows all the necessary information on the account and open positions, breakeven levels, stop-out, and complete deposit wipeout. It may save someone from major losses.
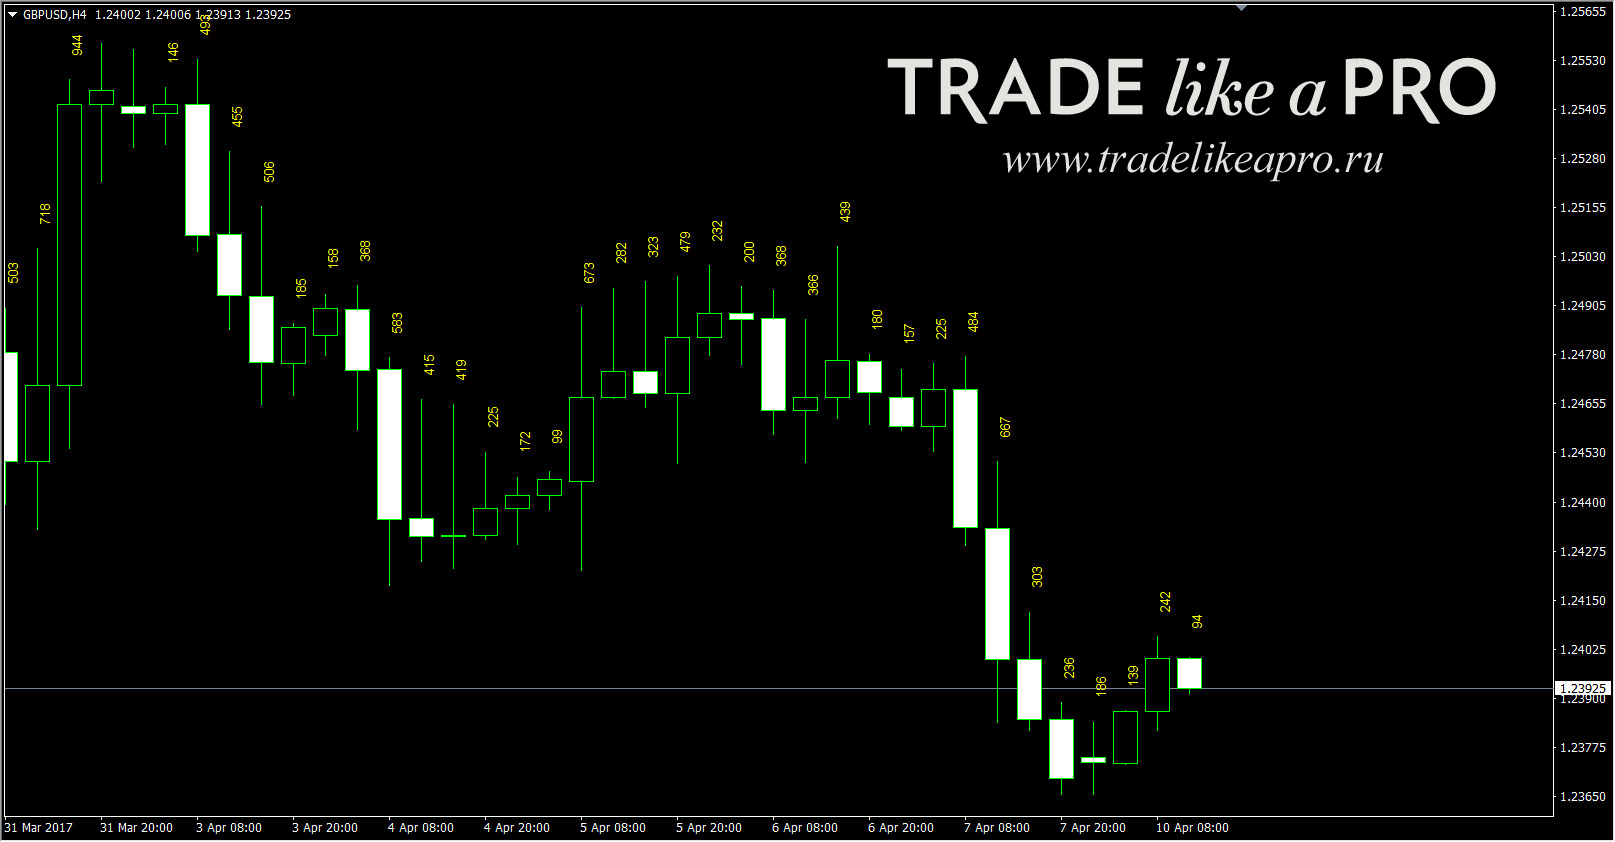
 CandleBodySize (and various modifications) - the indicator calculates the candle size in points. Due to its popularity in certain strategies, many mods have been made and various additional functions have been added.
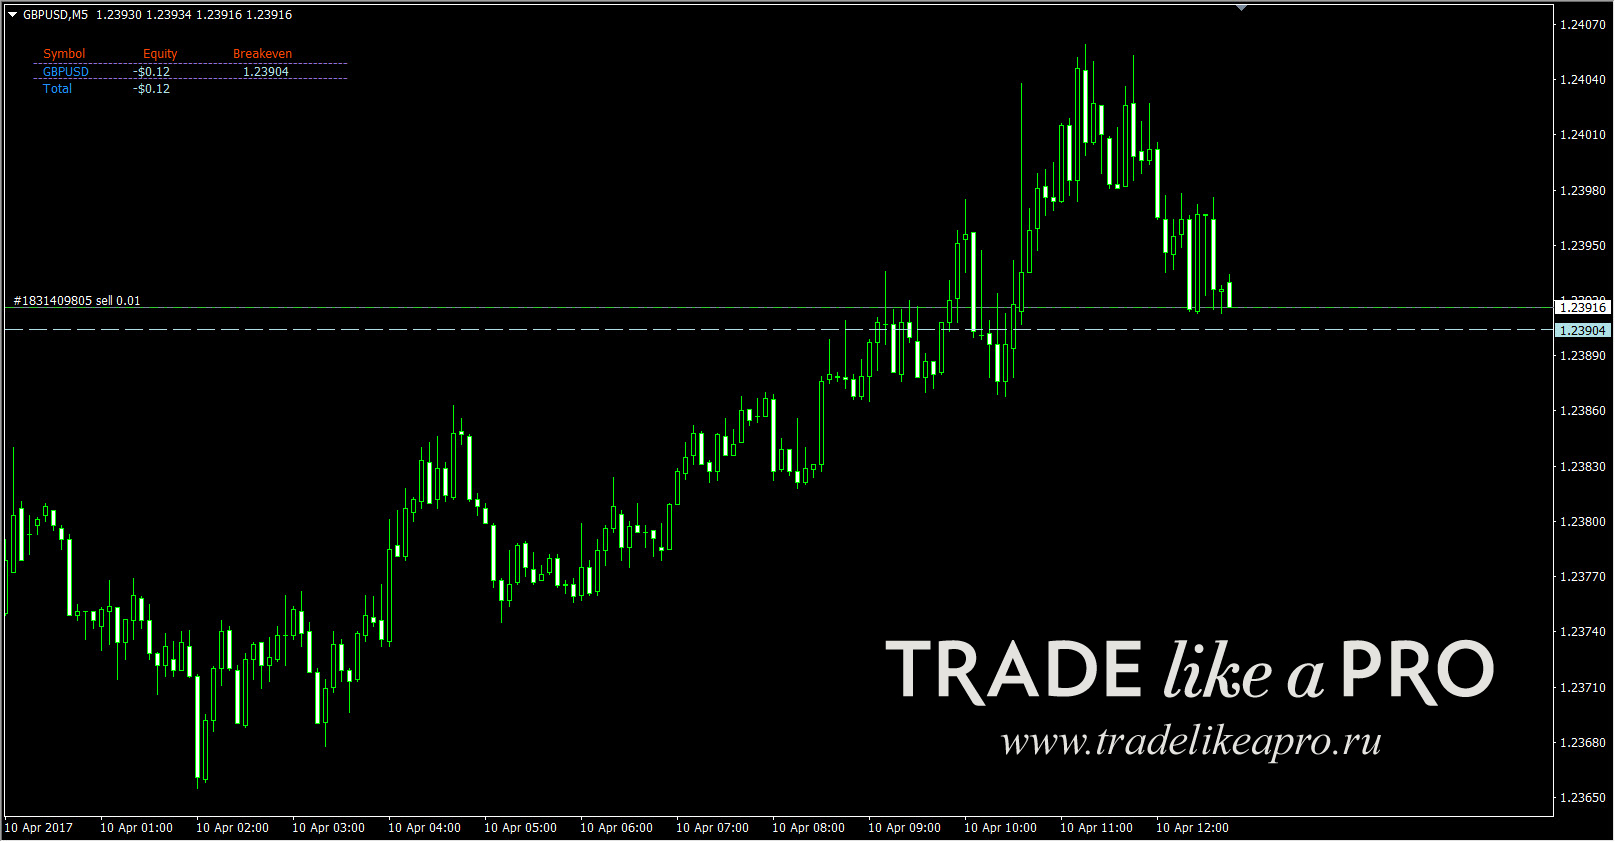
 i-Breakeven (and various modifications) - the indicator shows the breakeven level for an open order or a grid of orders. If you are too lazy to calculate it manually, this process has already been automated.
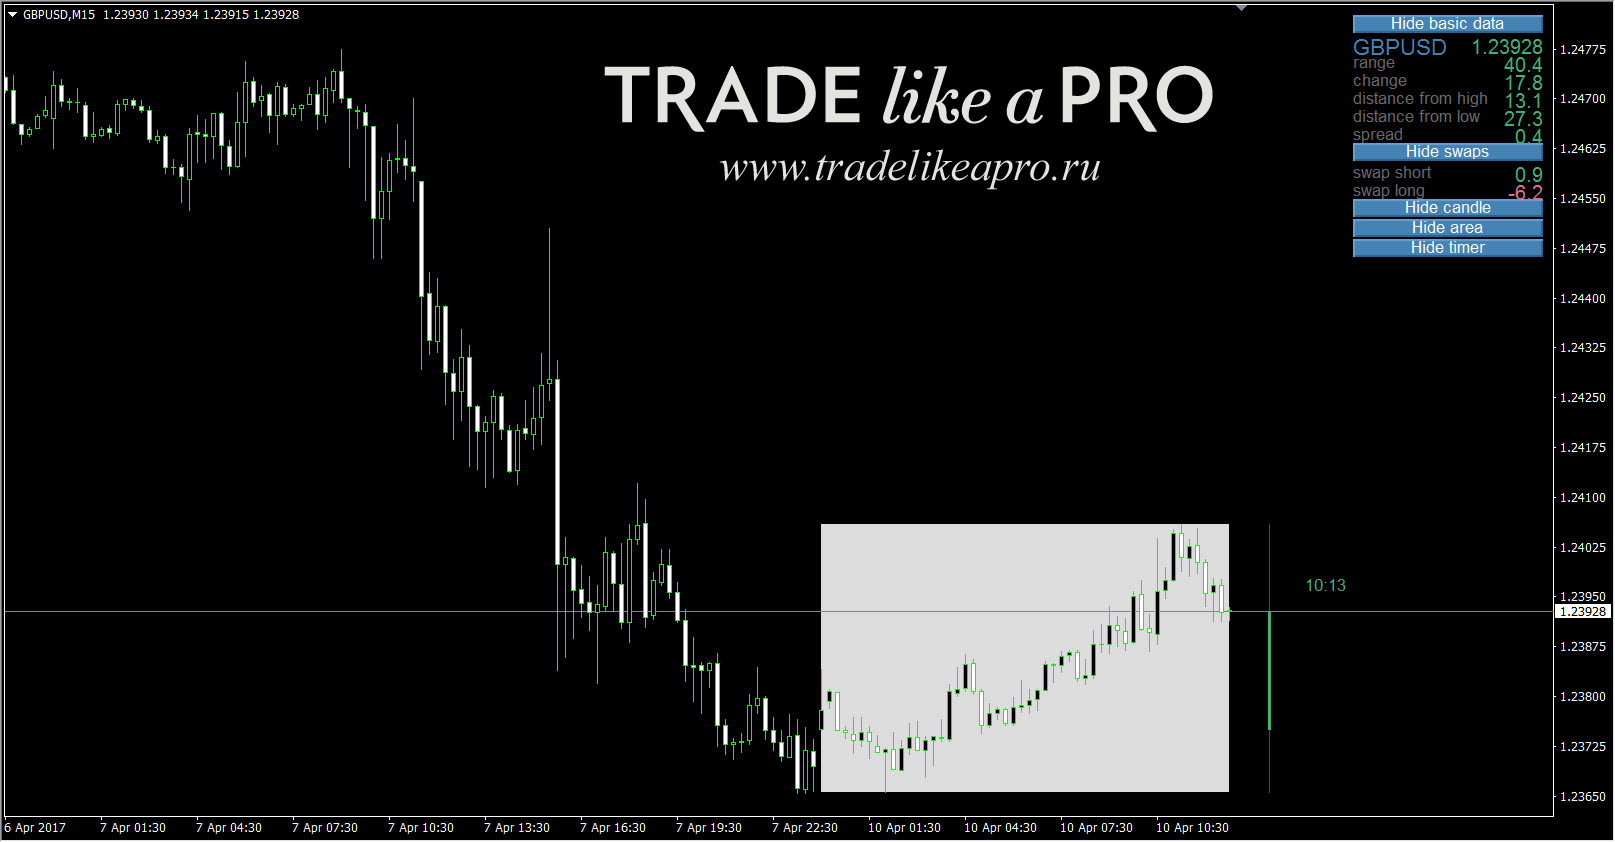
 DailyData - a legendary info indicator; it has many modifications, and all of them are included in the set. In the example below, all keys are clickable; we leave only what is necessary on the chart.
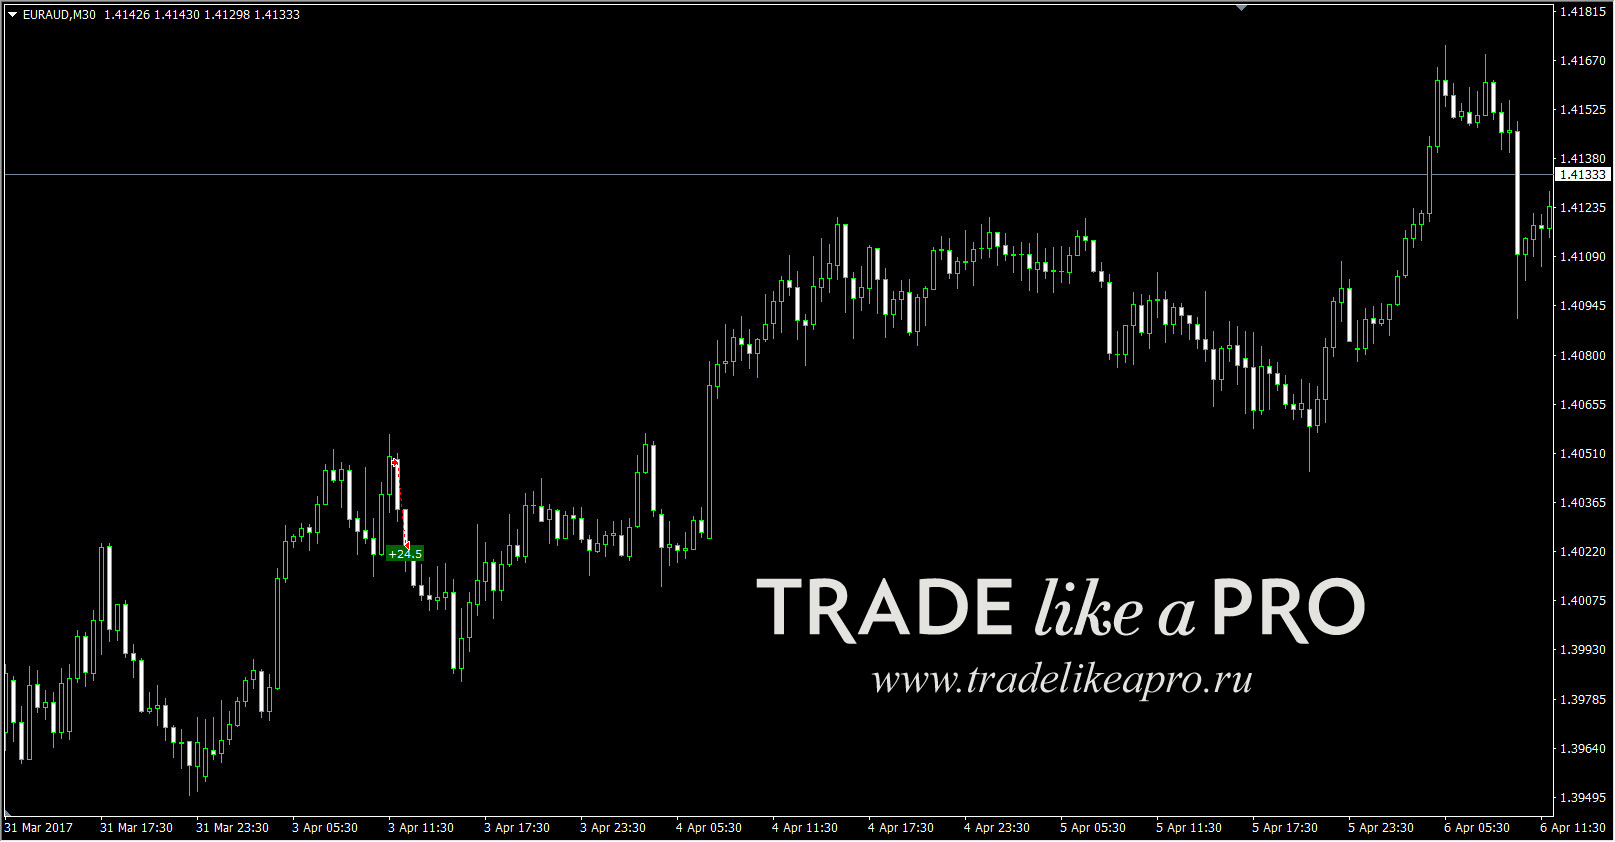
 DrawProfit v3.0.3 - the indicator displays closed trades on the chart; it can also show trade results: in points, in deposit currency, in points and currency; and also mark stop and take levels (this option is disabled in my screenshot). A very convenient feature.
 Unfortunately, it is impossible to talk here about all useful indicators, and there is no need to. In the forum topic on info indicators, everything is presented with pictures and a detailed description - the link is at the end of the article.
The most well-known indicators of this type: there are a great many of them.
Conclusion

As you already understood from the review, there are hundreds and hundreds of different helper indicators, and for the most popular and in-demand ones among traders there are dozens of different modifications. Thus, every trader will be able to choose the tool needed for work, customize it for themselves, for their goals and tasks, and work successfully in the market. I recommend periodically checking the forum topic, because in fact there are far more informational indicators than are described here in the article, and you will always be able to find some useful little thing for your terminal that you have long been looking for. And if the needed thing is not found, there is always something similar. Success and see you next time!
Download the set of informational indicators

Respectfully, Pavel aka Pavel888 TradeLikeaPro.ru
