
SuperTrend Indicator: A Smart Choice for Beginner Traders
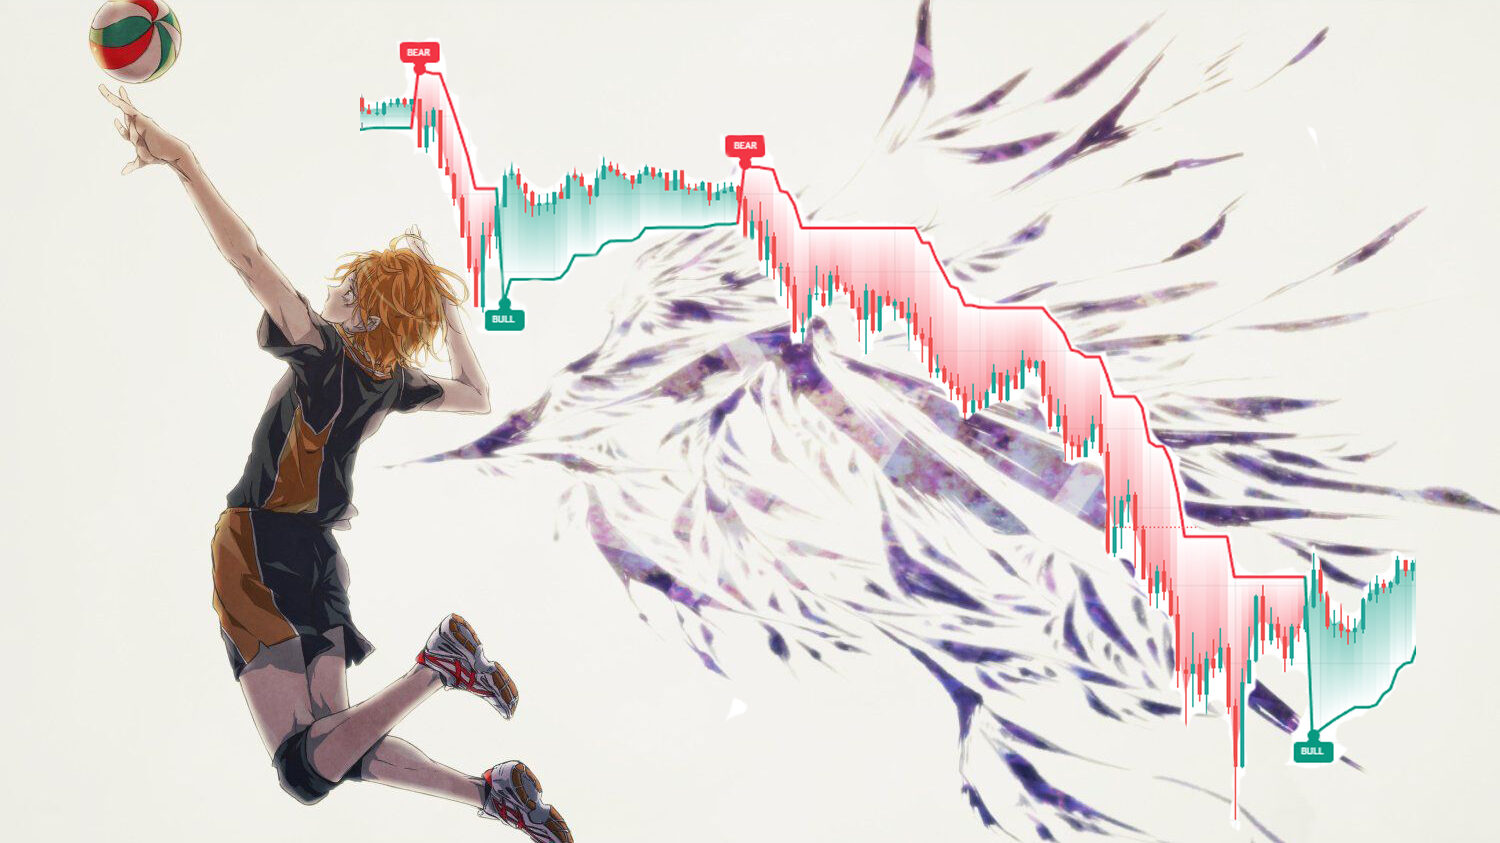
The SuperTrend indicator is a simple, visual, and effective tool for determining trend direction and possible entry and exit points.
The SuperTrend indicator works best in a trend, a strong impulsive move with minimal pullbacks, with signals showing 60-75% accuracy and an excellent risk/reward ratio.
The other side of the coin: SuperTrend works poorly during consolidation, that is, in sideways movement without a clearly defined direction. The number of false signals rises sharply, and profitability turns negative.
Read more about the indicator, the application strategy, and interesting implementation options on TradingView in our review.
The SuperTrend Indicator in Simple Terms
History of the Indicator's Creation
Despite its seeming "youth" compared to classic indicators like RSI or Moving Average, the history of SuperTrend already spans more than two decades.
The indicator was developed by French trader, author, and entrepreneur Olivier Seban (Olivier Seban) in 2009. He first described SuperTrend in detail in his book "Tout le monde mérite d'être riche" ("Everyone Deserves to Be Rich"), published on October 19, 2009.

The SuperTrend indicator became the result of the logical development of the average true volatility concept. The core indicator created within this concept is the Average True Range (ATR) indicator (author J. Welles Wilder, late 1970s of the 20th century).
Thus, the indicator created by Olivier Seban not only identifies the trend, but also takes trading volatility into account, making support/resistance lines more sensitive to current market conditions. This allows "SuperTrend" to combine direction of movement and risk management through volatility.
The first broad publications and discussions of the indicator in the community began around the same time, in particular on the MQL4.com forum, which contributed to its rapid rise in popularity among retail traders.
Almost immediately, the SuperTrend indicator became a standard, and today it is used by hundreds of thousands of traders around the world thanks to its simplicity and effectiveness in trending markets.
SuperTrend Calculation Features
The indicator is calculated in several stages and includes two key and, most importantly, adjustable parameters:
- ATR Period — the number of candles used to calculate the average true range (usually 10).
- Multiplier — the coefficient by which the ATR value is multiplied (usually 3.0).
First, the average price is calculated using the formula: HL2 = (High + Low) / 2.
After that comes the calculation of deviations:
- Upper deviation = (HIGH + LOW) / 2 + (Multiplier × ATR)
- Lower deviation = (HIGH + LOW) / 2 - (Multiplier × ATR)
Next, smoothing rules come into play to prevent sharp line jumps. The final SuperTrend line is either the upper or the lower band, depending on the current trend.
A buy position is held as long as the closing price remains above the final supertrend line. As soon as the price closes below it, the line switches to the upper band, signaling either a change or the end of the current trend.
Pros and Cons of the Indicator

Advantages
The Supertrend indicator is ideal for beginners because, thanks to its visual clarity, a single glance at the chart provides all the information about what is happening in the market right now. Investopedia emphasizes: "Its strength is its simplicity… effectively identifying market or asset trends".
SuperTrend is adaptive to volatility because ATR automatically expands/contracts the distance depending on what is happening in the market. Supertrend is an excellent trailing stop: it allows you to trade most of the trend without exiting too early.
Versatility is another important feature of the indicator. It works well in any markets (stocks, forex, crypto, commodities, etc.) and on the main timeframes (from M5 and above).
In addition to all of the above, it is worth noting that the indicator is free and available on all major platforms.
When SuperTrend Works Best
The indicator works perfectly in a trend, a strong impulsive move with minimal pullbacks (gold, NASDAQ in bullish phases, crypto during altseason). Here the indicator shows 60-75% accuracy and an excellent risk/reward ratio.
Backtest data on the QuantConnect platform also demonstrates impressive results: the compound annual growth rate (CAGR) was 31.2% with a Sharpe ratio of 1.3 on historical data.
Risks and Drawbacks
Despite its popularity, SuperTrend has serious limitations.
Among the indicator's main drawbacks: it does not distinguish between a strong and a weak trend, which means it does not show trend strength. In addition, lag is characteristic of it, which leads to the loss of 10 to 30% of the move: this is especially noticeable on lower timeframes.
At the same time, the indicator generates a series of false signals and losing trades in a range (flat). This leads, among other things, to overtrading and blowing the deposit.
The situation can be partially corrected by optimizing the multiplier for the asset. It is also worth listening to experts' recommendations: skip trades if ADX < 20–25 or Bollinger Bands are compressed.
But the main risk is psychological: the trader begins to "believe" the indicator and ignores market context (news, levels, volumes).
Thus, SuperTrend is not a standalone tool, and it absolutely must be combined with other indicators to determine trend strength and market phase.
SuperTrend Trading Strategy

The classic trading strategy based on the supertrend indicator is as follows:
Buy — the price closes above the red line (it turns green). The stop-loss is placed below the current SuperTrend line.
Sell — the price closes below the green line (it turns red). The stop is above the line.
Exit / trailing — hold the position until the color changes. The line itself "follows" the price, locking in profit.
Popular improvements to the Supertrend indicator:
- ADX filter (>25 means only a strong trend).
- RSI confirmation (do not enter in overbought/oversold conditions).
- Multi-timeframe: a signal on H1 is confirmed by the direction on D1.
- Combination with EMA(200): trade only in the direction of the long-term trend.
Backtest studies (Quantified Strategies, 2025) show that on trending assets (gold, indices, cryptocurrencies) the strategy has positive mathematical expectancy when proper risk management is observed (1-2% of the deposit per trade).
Trading Setups
Setup 1: Classic Trend Following (ideal for beginners)
- Timeframe: H4 and Daily. Assets: XAUUSD, NASDAQ, BTC/USD, AAPL, SPX.
- Parameters: ATR 10, Multiplier 3.
- Long: SuperTrend changes color to green + price is above EMA 200.
- Entry: opening of the next candle.
- Stop-loss: below the green line (dynamic).
- Exit: switch to red (trailing).
- R:R: 1:3–1:5 in trending conditions.
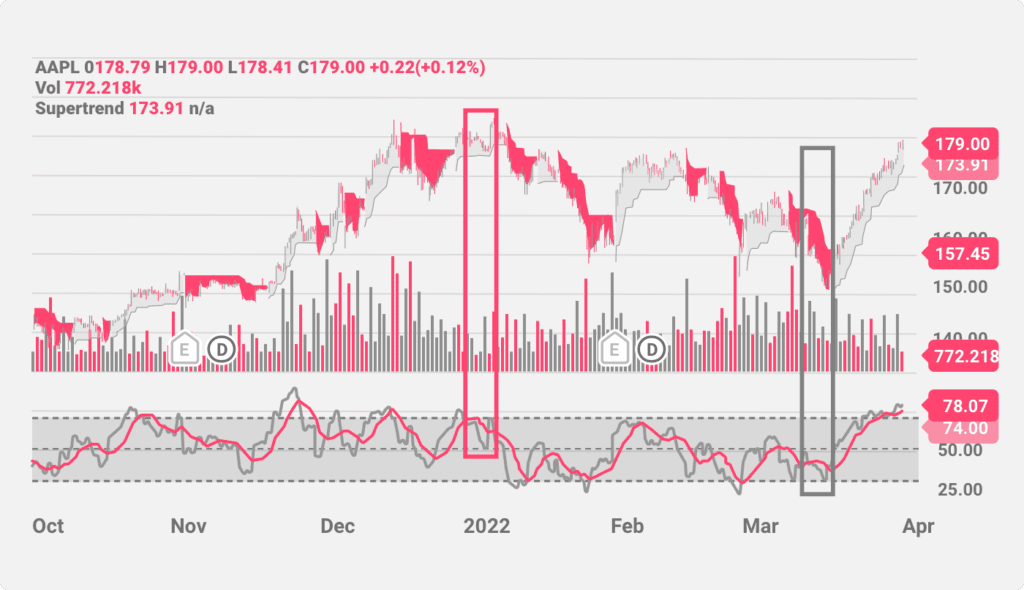
An example on the AAPL Daily stock chart, 2022.
Setup 2: Pullback to SuperTrend (pullback to the line) — the most profitable according to backtests
Timeframe: H1–H4.
Conditions:
- SuperTrend has already been green for 5+ candles.
- The price pulls back and touches/approaches the green line.
- Confirmation: a bullish candle (engulfing, pin bar) or RSI(14) > 50.
- Entry: close of the confirmation candle.
- Stop: 0.5–1 ATR below the line.
- Take: trailing by SuperTrend or the next level.
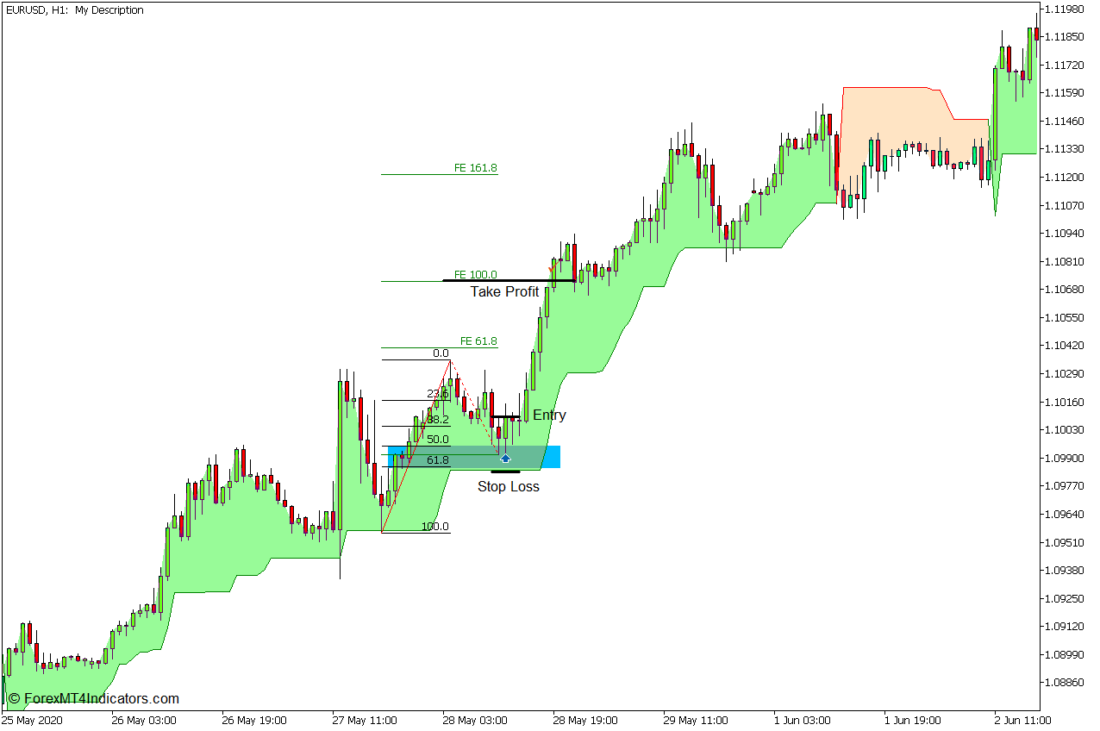
On the EURUSD H1 chart, a classic pullback with entry in the 61.8 Fibo zone and a stop below the line.
Setup 3: Multi-Timeframe Alignment + ADX D1.
Global direction by SuperTrend, H1/M30 signal in the same direction.
Filter: ADX(14) > 25 on the working TF.
Advantage: there are almost no false signals. The setup worked perfectly on BTC and gold in 2024–2025.
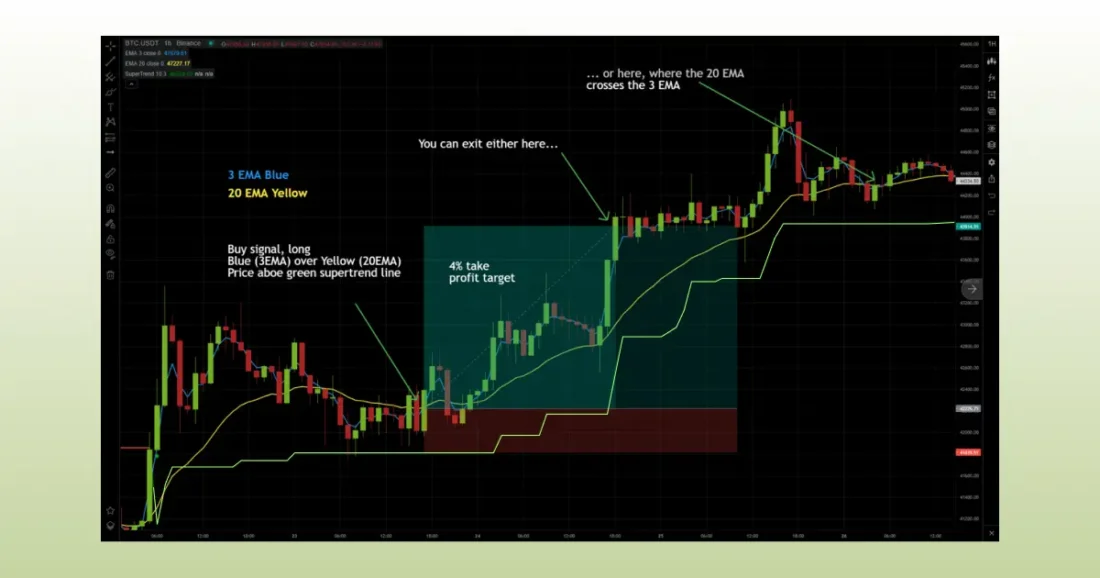
On the chart — BTCUSDT D1.
Setup 4: Intraday Scalping/Day Trading (M15–M30)
Works excellently on volatile crypto pairs and indices during the American session.
- Parameters: ATR 7–10, Multiplier 2.5 (more sensitive).
- Long: green SuperTrend + ADX > 25 + RSI > 50 (not > 70).
- Entry: line retest or impulse candle.
- Stop: below the line or swing low.
- Exit: opposite signal or R:R — 1:2–1:3.
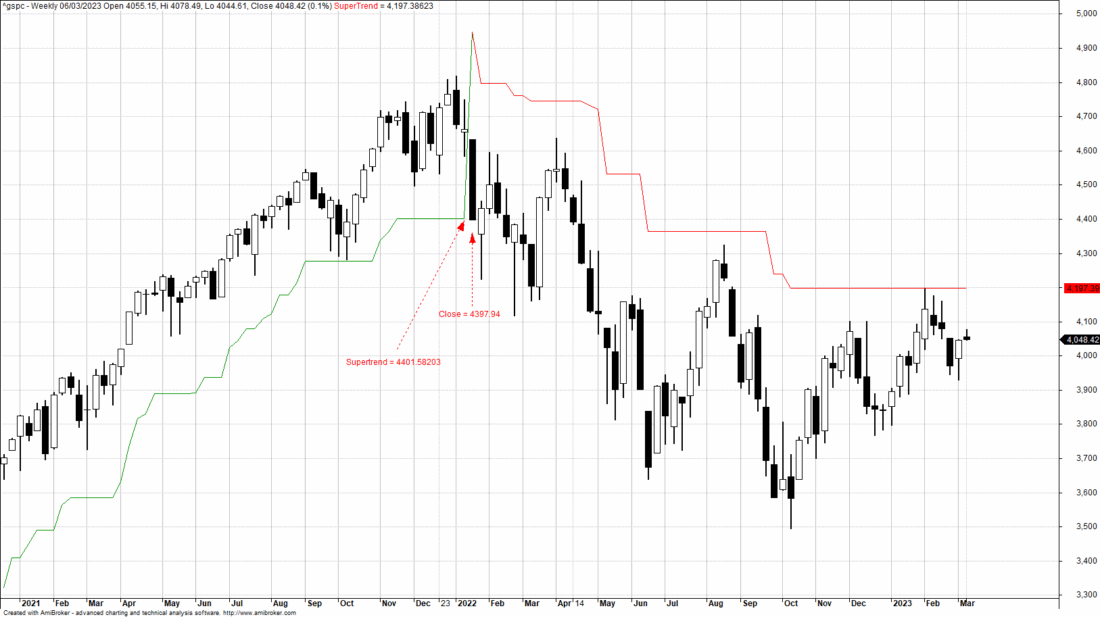
On the chart above (S&P 500 Weekly), you can see how SuperTrend "caught" the entire bull trend of 2021–2022 and exited on time in 2022.
Popular Implementations of the SuperTrend Indicator
Supertrend Indicators on TradingView
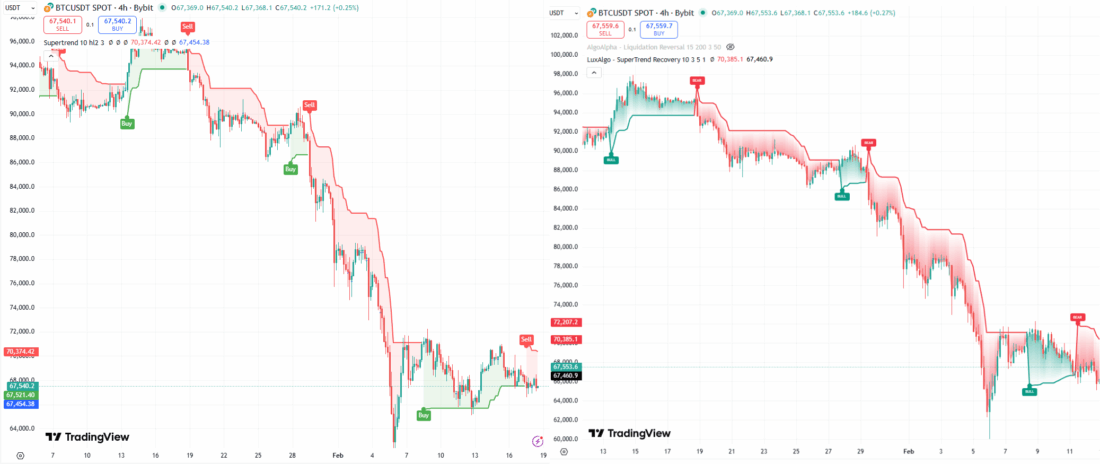
On the TradingView platform, the most popular indicator is SuperTrend by the author KivancOzbilgic. The indicator page has been viewed almost 1.9 million times. The last update was on April 6, 2020.
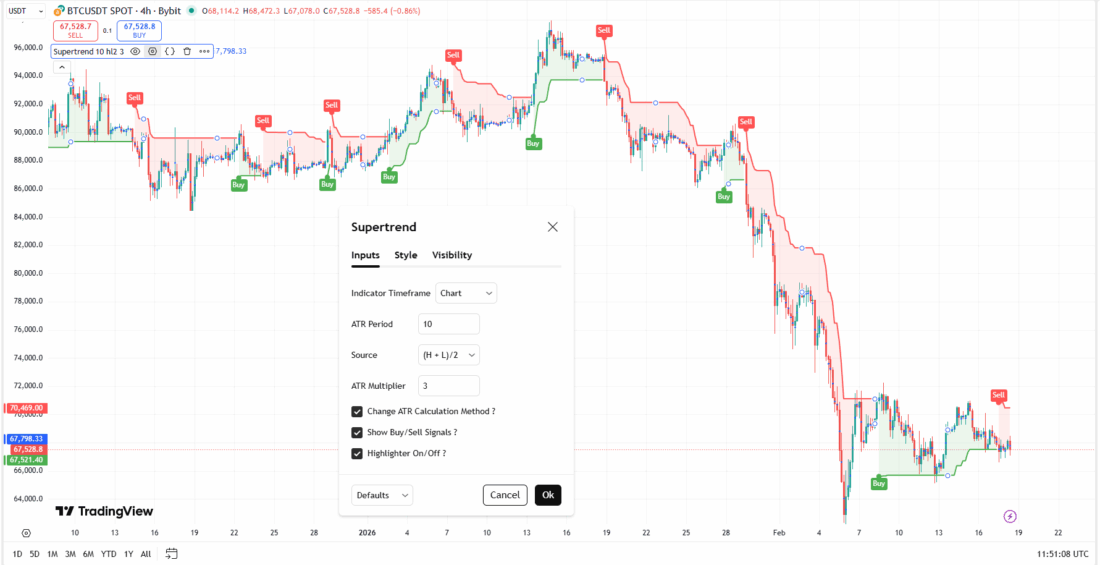
As we can see, this is the classic version of the indicator. On the chart above is H4 BTCUSDT (Binance).
SuperTrend Recovery by LuxAlgo
TradingView features many improved variants of Supertrend. One of them is SuperTrend Recovery by LuxAlgo. The indicator was published on February 17, 2026 and gained more than 4 thousand views in its first day.
The indicator can be used in the same way as the standard SuperTrend, but the unique recovery logic, according to the developer, allows it to react more adaptively to price deviations.
In the standard SuperTrend indicator, the band remains in place if the price moves against the trend (but does not break it).
In the SuperTrend Recovery version, if the price falls significantly below the "switch price" (in a bullish trend) or rises above it (in a bearish trend), the band begins to shift toward the price in accordance with the recovery alpha parameter.
This allows the trailing stop to "catch up" with the price during pullbacks with high volatility, which potentially provides a faster exit from the trade in the event of an unsuccessful recovery.
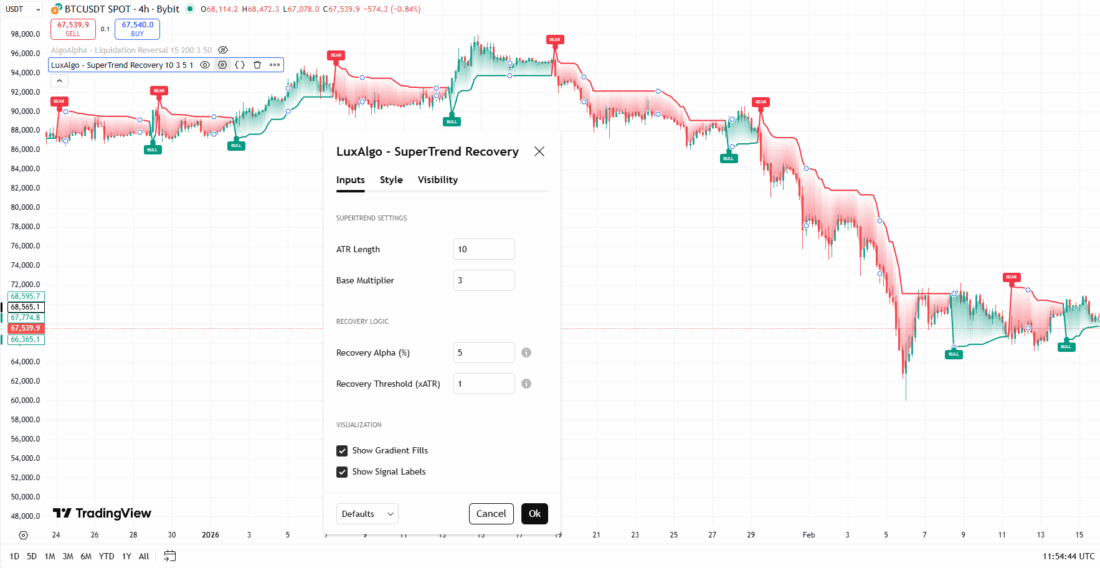
Recovery logic (Recovery)
When the price enters the "loss" zone compared with the price from which the trend began (the switch price), the script checks whether the deviation exceeds the recovery threshold.
If the threshold is reached, the band is calculated as an exponential moving average (EMA) of the current price and the previous band value, weighted using the recovery coefficient.
This creates a "narrowing" effect in which the band aggressively narrows in the direction of the price during deep pullbacks, which helps reduce drawdown because the exit signal arrives earlier than when using the standard static band.
The recovery logic settings are as follows:
- Recovery alpha (%): determines how quickly the band adjusts to the price when the recovery logic is active. The higher the value, the higher the reactivity of the band.
- Recovery threshold (xATR): the distance (in ATR units) by which the price must deviate from the switch price before the recovery mechanism is triggered.
If you compare the basic settings of the classic "SuperTrend" indicator with the recovery logic version, there is no special difference visible, but the newer indicator is indeed visually smoother.
Supertrend Indicators for MT 4/5
The most popular version for MT4 is SuperTrend by jnrtrading1 (published on July 20, 2008, last updated in April 2014), which has gained almost 176 thousand views with a rating of 4 (39 ratings).
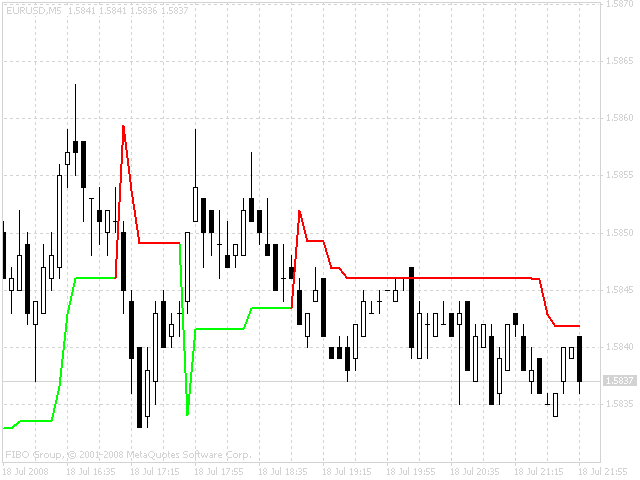
Some users complain that the indicator does not work, while others write that everything works fine.
For MT5, it is worth noting Supertrend by SalmanSoltaniyan (March 15, 2025): more than 37 thousand views, 12 ratings (5 stars), and open code.
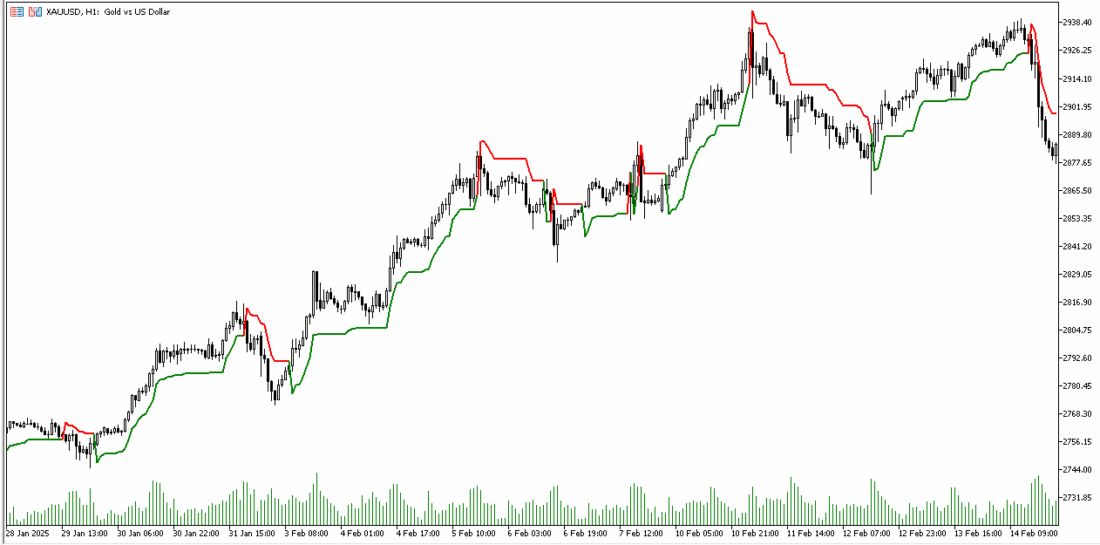
Note that this indicator has an MIT license (a free software license developed by the Massachusetts Institute of Technology).
Among the features: the ATR period in the basic settings is 22, not the standard 10.
Conclusion
SuperTrend is a brilliant example of how a simple indicator can be an excellent assistant if you understand its limitations. Olivier Seban created a tool that simplified trend following for millions of retail traders. It is not a magic wand that replaces analysis, but in combination with trend filters and strict risk management, the indicator delivers a predictable result.
The tips for successful use are as follows:
- Testing on historical data of your asset (TradingView Replay or MT5 Strategy Tester).
- A ban on trading when SuperTrend is in a sideways range.
- Applying a multiplier of 2.5–3.5 in volatile markets, 4–5 in calm ones.
- Adding volume analysis or Price Action for confirmation.
SuperTrend remains a relevant indicator 17 years after its creation precisely because it solves the trader's main problem: "where is the market going and where to take profit." The main thing is to use it as intended: in a trend, with discipline, and together with other tools.