
Global Markets in a Period of Turbulence. Part 3.

Turbulence in global markets is gradually increasing. Although it still seems that things are not all that bleak. What a wonderful time.
To discuss the outlook for oil prices and the Russian ruble exchange rate, let us first assess the overall situation in the global oil market.
To illustrate the extent to which the global economic situation has deteriorated, let us discuss oil consumption. This discussion was initiated not by us but by J.P. Morgan analyst Natasha Kaneva in the global commodities study J.P. Morgan Global Markets Strategy / Global Commodities Research, Oil Markets Weekly — “Dry powder” (September 17, 2026).
J.P. Morgan was among the first global investment banks to state virtually outright that it had no idea how the situation with oil and petroleum-product supplies to global markets would develop. Incidentally, global oil demand fell approximately 4.4 million barrels per day below its level a year earlier. To be clear, this refers specifically to the difference between current actual demand and demand in the comparable period a year earlier.
Incidentally, the IEA (International Energy Agency) provides slightly different figures. According to its data, the decline has averaged “only” −2.8 million barrels per day since the war began.
I will not examine why J.P. Morgan cites 4.4 million barrels per day while the IEA cites 2.8 million barrels per day. But I will try to show briefly what these figures mean and what we should expect very soon as a result.
In 2026, the colossal supply shock was partially mitigated by a sharp decline in inventories and a contraction in demand. Here is the table of global supply and demand.
2026 Q2 | 2026 Q3 | |
|---|---|---|
Global supply | −8.73 million b/d YoY | −7.56 million b/d YoY |
Global demand | −4.0 to −5.3 million b/d YoY | −2.0 to −3.4 million b/d YoY |
Resulting deficit | about −3.9 million b/d | about −3.0 million b/d |
The difference between the decline in supply and the decline in demand is offset by drawing oil from global inventories.
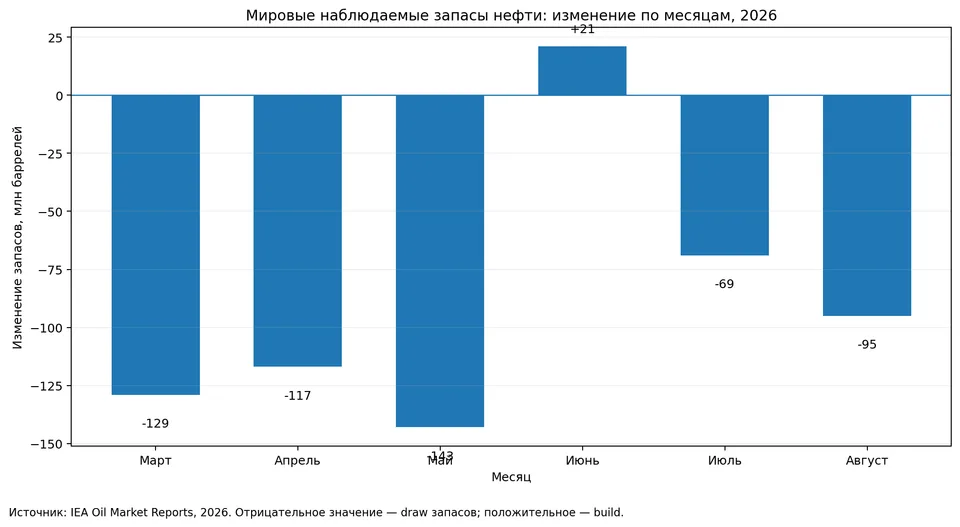
The IEA reports that by the end of August, the cumulative inventory decline since the conflict began in late February had reached 507 million barrels. This is not yet a critical point, but it is already beginning to loom on the horizon.
Let me remind you that J.P. Morgan says it is impossible to model the end of the US–Iran conflict:
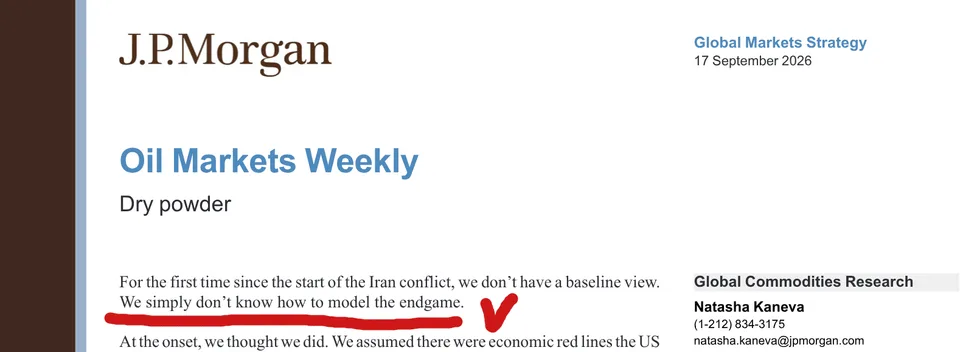
And if there is no clarity, it is worth thinking very seriously about where a world that needs at least some oil reserves is heading. Balancing supply and demand is not enough for inventories to begin recovering.
Restoring the 507 million barrels that were “burned through” would require:
an average surplus of about 0.7 million b/d for 2 years;
an average surplus of about 0.9–1.0 million b/d for 1.5 years.
This is precisely the mechanism the IEA and EIA (US Energy Information Administration) are now factoring in.
The IEA expects global supply, after falling by 5.7 million b/d in 2026, to grow by about 8 million b/d in 2027, while demand recovers by roughly 2.6 million b/d relative to prewar levels.
In its September forecast, the EIA assumed a gradual recovery of flows from the Persian Gulf and the return of most production by the second quarter of 2027. Its model leads to Brent falling to an average of about $74 in 2027 and to about $67 in the second half of the year. At the same time, the EIA expects inventories to continue falling through the end of 2026 and subsequently recover.
But what if things turn out a little differently? What if J.P. Morgan had good reason to qualify its analysis by saying it did not understand what or how to model?
For example, what if supply grows slightly while demand is no longer falling? Then:
inventories continue to fall;
diesel and jet fuel become even scarcer;
countries begin competing for available barrels.
This is precisely the situation in which available barrels become very expensive because the market is no longer capable of using inventories normally as a buffer. In this case, an oil-price range of $130–$150 becomes entirely reasonable. Although there is talk that some shipments are already being made at these prices.
At the same time, the scenario of more or less balanced oil supply and demand but an actual fuel shortage remains in play. Even now, the oil crack spread is rising again and once again reaching historically high levels.
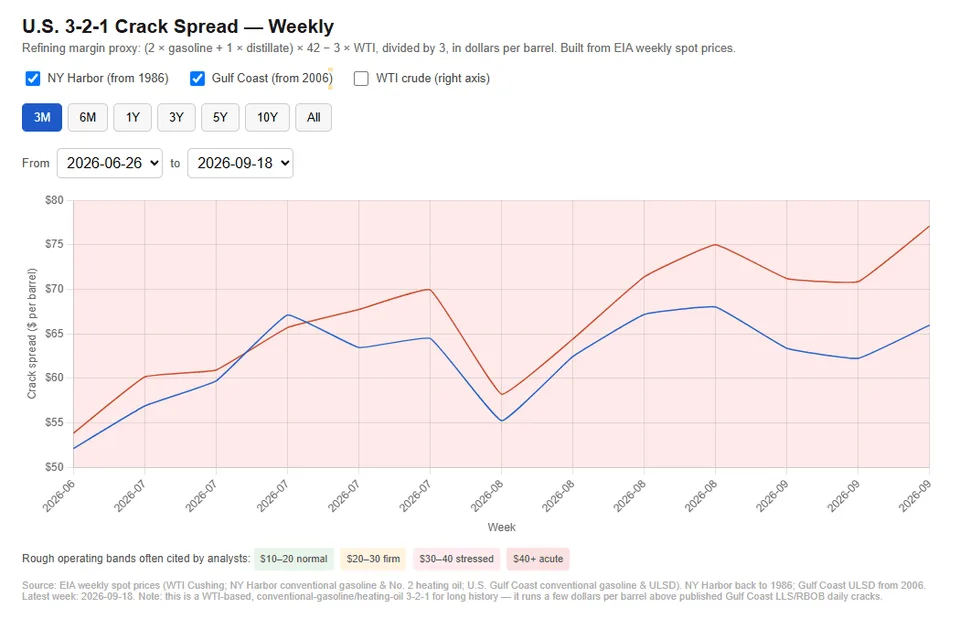
Such a combination could cause overall global GDP to continue growing or stagnating while some developing countries effectively drop out of the catch-up development process. This is especially true of countries in Asia and Africa. The least affluent segments of the population in developed countries will also have to lower their standard of living.
In short, optimistic economists say everything will be fine and oil will become cheaper, pessimistic consumers stock up on fuel in cans, and realistic speculators buy call options on oil.
CL Futures (CME)
The last time we discussed WTI oil was in the first half of September. Since then, it has managed to trade above 105 bucks, while most trading took place in the $100–$105 range per barrel of paper oil.
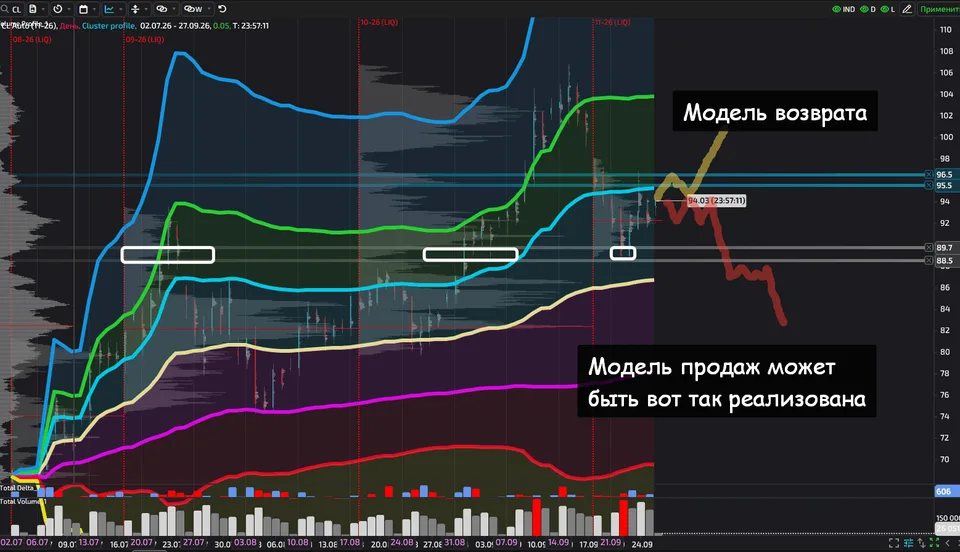
From there, the quote plunged straight into the 89.5–93.5 range. Moreover, there was absolutely no trading at all in the 96.5–100 range. None whatsoever. That was precisely when global agencies released reports saying everything would be fine next year and we only needed to wait.
And what is the outlook? For now, we continue to drift within the year's value area. We could easily see 85–86.5 as well. In any event, it is reasonable to expect some downward balance until around the end of the first ten days of October.
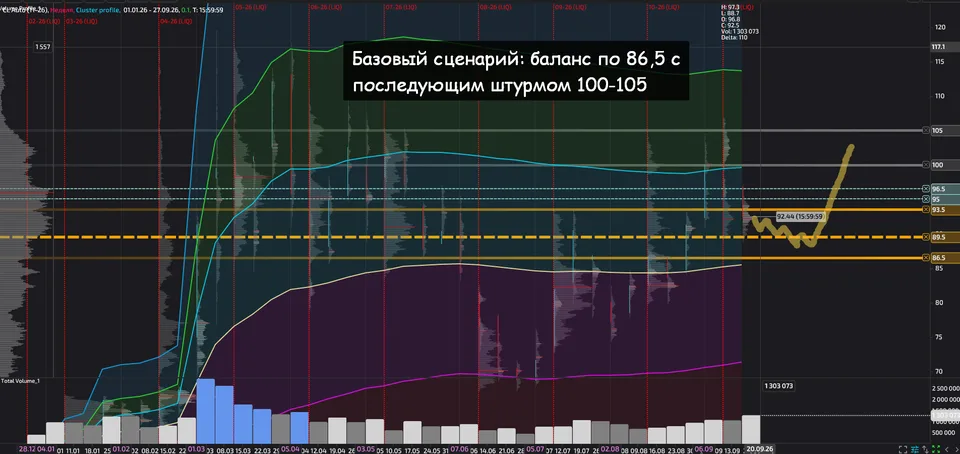
That is one scenario. Then, if J.P. Morgan is right and there are no clear developments in the Iranian and other crises, another assault on 100–105 follows.
Another scenario even implies a move toward 81.5. But we will not consider it for now.
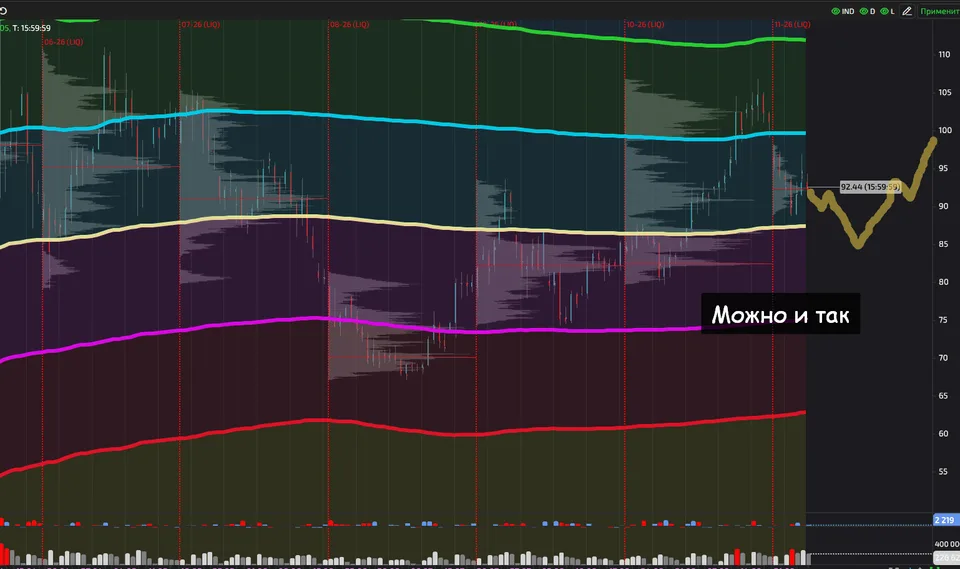
In turn, a third scenario can also be identified. Under this scenario, the 88.5–89.7 range could serve as the price floor in the current phase. In this scenario, buyers need to break above 95.5–96.5 to move comfortably toward 100.
Ruble/Dollar Futures (MOEX)
While oil was cheap, the ruble was strong. Consumers could purchase inexpensive imports without significantly accelerating ruble inflation.
Then June 2026 arrived. On the one hand, oil exports rose sharply, while on the other, petroleum-product output fell just as sharply. Russia stopped exporting distillates to global markets. The ruble began weakening rapidly.
Remarkably, the sharp rise in oil giants' foreign-currency revenue coincided with a decline in the USDRUB exchange rate. In terms of ruble income, it was an outright jackpot.
One of the main questions now is: what comes next for the ruble? Onward to 90–92 and higher, all the way to 100, or a pullback to 80–82?
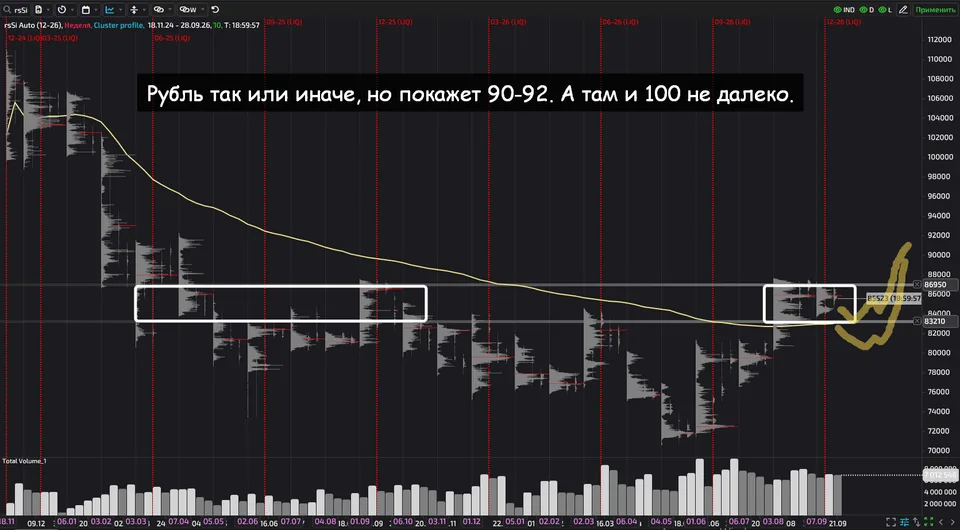
The answer lies in the auction model.
The VWAP (yellow line) is plotted from the start of the short impulse in late 2024. The USDRUB quote moved sharply above the 2-year value area. For 5 weeks now, the ruble has remained comfortably within the 83.2–86.9 range. Moreover, volumes are elevated.
Under this setup, it could touch 83 once more before moving to 90.5–93 rubles per dollar.
Why exactly 83? It is the bottom of the current value area, the VWAP of the short impulse since 2024, and the +0.5 deviation from the VWAP of the buy impulse since the summer of 2026. Everything has converged in one place. There is nowhere else to go.
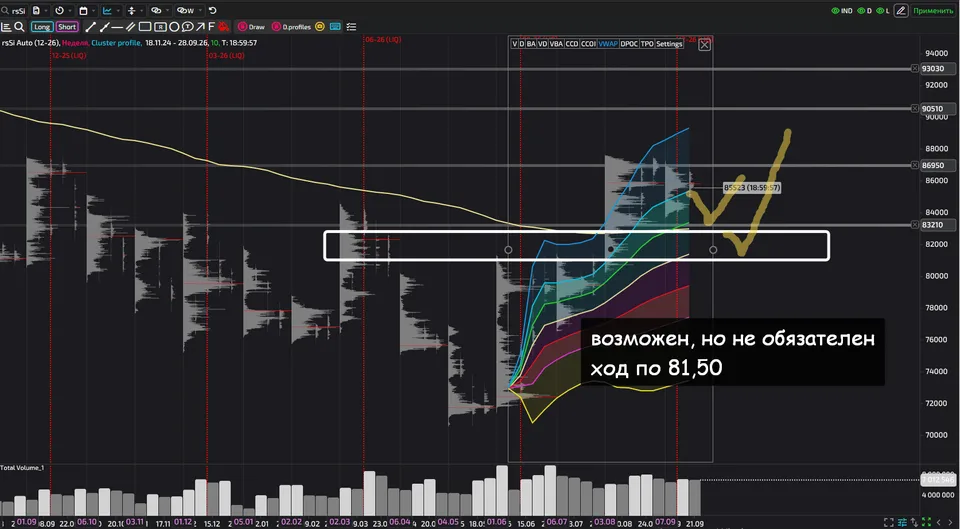
Unless, of course, it makes a highly manipulative touch of 81.5 to let the smartest players enter. Then August's FVG would be fully traded through, and the 81.5–83 area would be used to reposition the range.
How Can the Ruble and Oil Forecasts Be Reconciled?
Medium- and long-term price expectations point to more expensive oil. But downward corrections are possible in the short term.
For now, USD/RUB has only one path: north. The buy-impulse model is not yet complete. Analysts will simply explain the ruble's decline by cheaper oil. Later, when oil begins to rise, a falling exchange rate or the rate remaining above 85 and 90 rubles per dollar can be explained by the continuing shortage of petroleum products or anything else.
In fact, the ruble is substantially decoupled from oil. There is now an opportunity to use oil revenues to cover part of the budget deficit without substantially reducing spending on the economy and social programs—which is simply excellent.