
How to Earn Carry from ZEC, SUI, LINK, ENA, and ONDO Funding on Bybit

Spot-futures arbitrage is often presented as a stable, market-neutral strategy: buying cryptocurrency on the spot market while simultaneously selling an equal amount of perpetual futures.
A different formulation of the task is of interest to an aggressive trader. They do not seek to keep capital in one place but constantly reallocate it wherever funding can cover all expenses and provide positive carry (carry in trading is income that a trader receives not from a change in an asset's value but from holding a position for a certain period).
We discussed spot-futures arbitrage in major cryptocurrencies in greater detail in another article. This article is entirely practical and intended for aggressive traders who understand interest income that does not depend on market direction.
The arbitrage structure is simple: Long Spot + Short Perpetual. For example: buy 1 BTC on Bybit Spot and sell 1 BTC in the BTCUSDT Perpetual. If BTC moves up, the spot position usually makes a profit, while the futures position loses approximately the same amount. The reverse happens when it falls.
The main source of income therefore shifts from market direction to funding. When the funding rate is positive, longs pay shorts. This means the short futures leg receives a payment.
At the end of September 2026, opportunities for aggressive spot-futures arbitrage on Bybit appeared in several liquid perpetual futures at once, with ZEC, SUI, LINK, ENA, ONDO, HYPE, and several others being the most interesting. The coins themselves are in different regimes: some provide consistently positive funding, while others offer a high rate only in the short term, but we will discuss that below.
Perp | 24h volume | OI | Spread | Current funding |
|---|---|---|---|---|
BTC | $4.02 billion | 4.85 billion | 0.01 bps | +0.0068% |
ETH | $2.41 billion | $2.12 billion | 0.04 bps | +0.0069% |
SOL | $879.8 million | $833.2 million | 0.84 bps | +0.0043% |
ZEC | ~$635 million | ~$231 million | ~0.07 bps | +0.0100% |
SUI | ~$198 million | ~$96 million | ~0.87 bps | +0.0100% |
LINK | ~$173 million | ~$108 million | ~0.66 bps | +0.0027% |
ENA | ~$116 million | ~$184 million | ~0.39 bps | +0.0050% |
ONDO | ~$88 million | ~$239 million | ~1.95 bps | +0.0050% |
UNI | ~$87 million | ~$85 million | ~1.15 bps | +0.0100% |
LTC | ~$77 million | ~$93 million | ~1.44 bps | +0.0077% |
DOGE | ~$172 million | ~$137 million | ~1.07 bps | +0.0014% |
HYPE | ~$298 million | ~$261 million | ~1.15 bps | −0.0203% |
The current volume, open interest, and spread values come from monitoring perpetuals on Bybit. Funding figures and historical APYs were obtained from the histories of the corresponding contracts. APY values are funding rates annualized, not forecasts of future returns.
The first thing that stands out is that high funding by no means always indicates the best market for arbitrage.
BTC has enormous liquidity and a virtually zero spread. But the carry here is low.
ZEC, by contrast, shows both high funding and a very narrow spread.
SOL looks liquid, but its 30-day carry is noticeably weaker than the current funding rate.
HYPE shows the opposite picture altogether: current funding is strongly negative, weekly carry is negative, but over 30 days the figure remains positive and even exceeds SOL's monthly value.
It is precisely these discrepancies that create opportunities for an active trader.
Three Groups of Assets for Arbitrage

Ranking the coins in a single list would be an oversimplification: they differ too greatly in market depth, funding stability, and order-book liquidity. It is better to divide them according to their suitability for arbitrage trading under current conditions (autumn 2026).
The coins can reasonably be divided into three groups: the main core, the second tier, and coins to monitor.
The main rule of aggressive spot-futures arbitrage is not obvious. It states that a trader buys not funding itself, but cash flow.
Main Core
BTC, ETH, SOL, XRP, SUI, LINK.
These are relatively large markets with substantial perpetual volume and funding that was predominantly positive in the third quarter of 2026.
Order-book depth here is usually sufficient for medium-sized positions without significant slippage, while the rate is stable enough to plan for a horizon of several weeks.
Second Tier
HBAR, LTC, UNI, HYPE.
These assets require closer attention to order-book depth and funding stability. HYPE is especially interesting as an example of a strong discrepancy between the current rate and 30-day funding: a high rate at a given moment does not guarantee that the accumulated result for the month will be the same.
For this group, the holding horizon should be determined individually, based on the actual settlement history rather than the displayed value.
Markets for Tactical Monitoring
ZEC, DOGE, NEAR, ADA, XLM.
In mid-autumn 2026, they exhibit at least one of the following problems: negative funding, high execution costs, or elevated rate volatility.
Arbitrage windows may open here, but they close quickly—so assets in this group do not fit the logic of “open and hold for a month while collecting funding.” Rather, they are candidates for short-term trades in which entry and exit are tied to a specific moment rather than a calendar plan.
Three Funding Trading Regimes
An aggressive trading strategy should provide for at least three different regimes.

Regime No. 1. Stable Carry
This is the simplest case.
Funding is positive now and remained positive over the past week and throughout the month. This is an ideal market for the Spot Long + Perpetual Short strategy.
Examples at the end of September were ZEC, SUI, LINK, and ENA. ZEC's 30-day APY was around 7.59%, SUI's was 6.22%, LINK's was 5.73%, and ENA's was 6.27%.
The trader's task is not to guess the token's price, but to verify that expected funding covers the cost of entry and exit.
Regime No. 2. Very High Funding
In this regime, the current rate is significantly above average.
For example, in recent settlements ZEC yielded 0.01% over eight hours several times, while SUI also repeatedly reached 0.01%.
For a $100K position: 0.01% of $100,000 is $10 for one eight-hour period. If the rate remains unchanged, daily income will be $30, and income over 30 days will be $900. This is not a forecast, but a calculation based on the assumption that the rate will not change.
High funding attracts aggressive traders. They do not need the rate to remain high all year. It is enough for its expected duration to exceed the cost of the trade.
Regime No. 3. Declining Funding
This is the most interesting and, at the same time, the most dangerous regime.
Suppose:
30 days—funding is positive;
7 days—funding is falling;
the current value is negative.
HYPE looked exactly like this at the end of September: the 30-day figure remained positive at around 3.48% APY, but the 7-day figure was around −4.16%, while the current rate reached −0.0203% over eight hours.
In such a situation, opening a classic short perpetual against spot based only on 30-day statistics is pointless. But for an aggressive trader, this does not necessarily mean a “bad market.” At this point, the market moves from the active carry-collection phase into a state of waiting for the next entry.
Entry requires the opposite signal: funding must return to positive territory and preferably demonstrate stability over several subsequent settlements.
The Arithmetic of a Trade on Bybit
Suppose the basic VIP 0 fee tier is used.
According to Bybit's current structure, the base rates are 0.10% for spot maker/taker and 0.055% for perpetual taker / 0.02% for perpetual maker. The exact rate depends on the region and the account's VIP level, so the My Fee Rate value should be used as the final reference.
If all four operations are executed as taker:
Spot buy = 0.10%
Spot sell = 0.10%
Perpetual open = 0.055%
Perpetual close = 0.055%
Total: 0.31% of notional. For a $100K position, that is $310.
This creates a strict requirement: funding over the entire term of the trade must exceed $310 to cover the basic trading fees.
For 30 days and standard 8-hour periods, the required rate is: 0.31% / 90 ≈ 0.00344% per period. This is approximately 3.76% simple annual interest.
Thus, with a strategy involving four taker operations, funding below a certain level becomes impractical if the position is held for only a month.
With maker execution, fixed fees are substantially lower:
0.10% × 2 + 0.02% × 2 = 0.24%.
The break-even point over 30 days: 0.24% / 90 ≈ 0.00267% per period.
But another problem arises: a maker order may not be filled.
This creates a fundamental choice: taker—expensive but fast; maker—cheap but does not guarantee execution.

A hybrid strategy works best for aggressive arbitrage: use maker in markets where it is possible to wait, and taker in situations where price risk must be closed quickly.
Examples
Suppose a trader opens: $100,000 SUI Spot and $100,000 SUI Perpetual Short. The current rate is around 0.01% over eight hours.
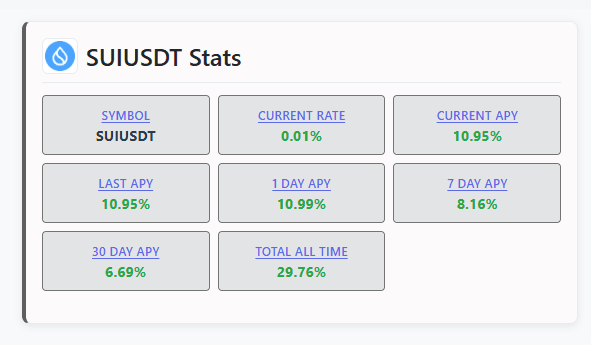
One settlement yields $10 in funding, while three settlements per day already yield $30.
Below is the funding actually collected by month. For example, in September 2026, a total of 0.53%, or $530, was collected from $100,000 in SUI. With total expenses of $310, income amounted to $220.
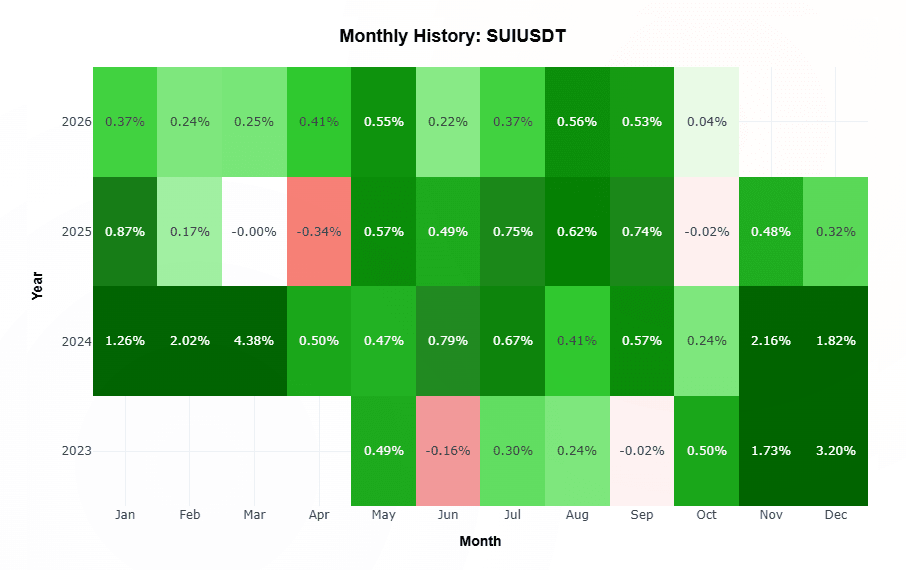
Looking at the market over the year, funding failed to cover the cost of opening the position only in February, March, and June. The cumulative result over 9 months was 3.5%, or $3,500, with expenses of $310.
Let us compare this with ZEC, where the current funding values are similar to SUI's.
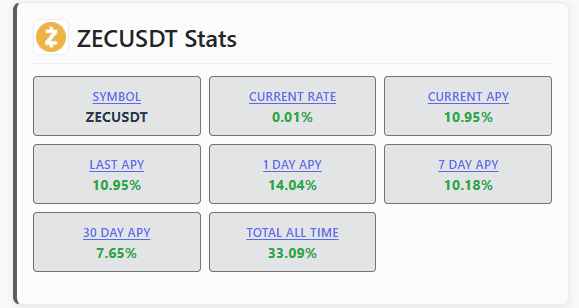
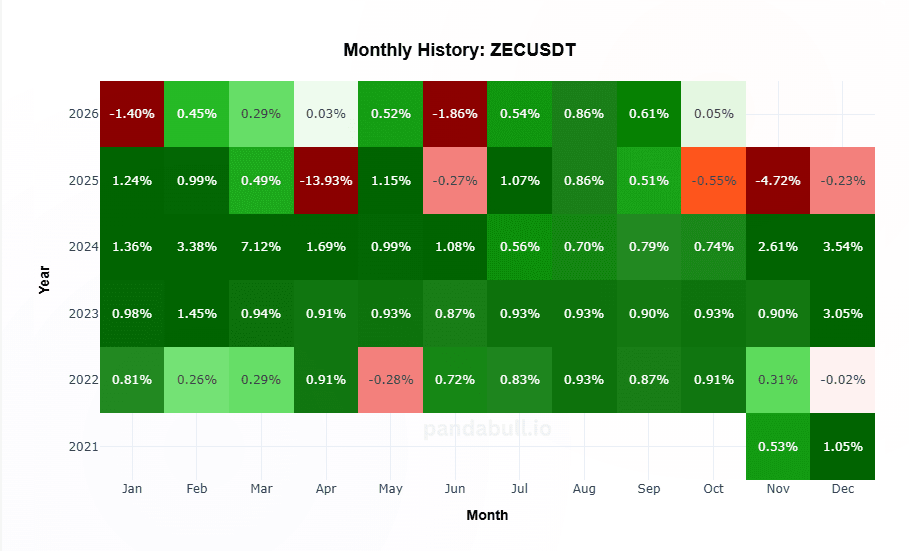
It might seem that there is no difference between choosing SUI or ZEC. But an assessment of total funding clearly shows that ZEC is generally less stable for spot-futures arbitrage: over 9 months of 2026, the actual return was −0.86%.
Now let us look at ENA (ENAUSDT). The instrument is especially interesting for active traders because, under the current regime, Bybit shows four-hour funding for them.
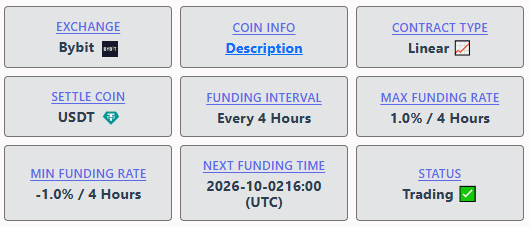
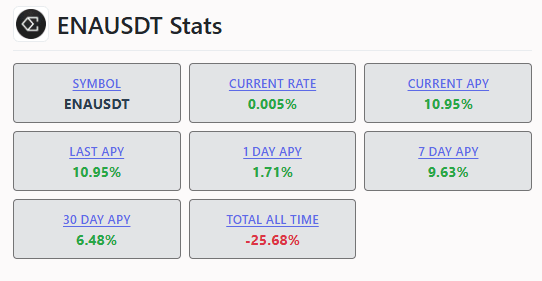
ENA shows around 0.005% every four hours. At first glance, this is half as much as 0.01% over eight hours.
But a day contains 6 4-hour periods and 3 8-hour periods. This means that for ENA, daily funding is 0.03% (0.005% × 6), which is the same figure as funding of 0.01% every 8 hours. Thus, the economics of daily carry are the same.
Where an Aggressive Trader Should Not Venture
Some markets have a very attractive rate but are poorly suited to large cash-and-carry trades. The reason is the spread.
Suppose funding yields several dollars every eight hours, while entering and exiting the position costs tens or hundreds of dollars because of the spread and slippage. The trader is then effectively exchanging capital for a very small cash flow.
ADA and some other illiquid coins have a significantly wider spread than BTC, ETH, ZEC, or LINK. This makes them sensitive to position size: an excessively large volume simply cannot be filled at one price.
Thus, the key question for an aggressive strategy is: “Which funding will be highest after accounting for execution costs?”
What Is Needed to Open and Close an Arbitrage Position
Filters for Selecting Trades at Entry
Liquidity. Choose contracts with high 24-hour volume and substantial open interest—otherwise, high funding may be an illusion in a small market.
Execution cost. Monitor the spread, order-book depth, and actual slippage. For large positions, a narrow spread is more important than an attractive rate.
Funding structure. Compare three windows—the current value, 7 days, and 30 days:
current > 7d > 30d—funding is rising;
all are approximately equal—stable returns;
current < 7d < 30d—returns are compressing, and this is often an exit signal.
Funding after fees. Expected funding must exceed the full cost of the trade (fees + spread + slippage), plus a margin of safety. For example, with a fee of 0.31% for the entry-exit cycle, the funding threshold starts at 0.50% over 30 days.

Rotation scheme. Instead of passively holding BTC, use constant rotation: before each funding period, liquid perpetuals are scanned, and markets with negative funding, low liquidity, wide spreads, and declining funding are filtered out.
The remaining markets are sorted by the “funding / execution cost” ratio. Capital goes wherever this ratio is highest. After several periods, the table changes—the position is closed and moved.
Rotation is a separate source of risk. Every transition involves closing one position and opening another, meaning new fees, spreads, slippage, and the risk that one leg will be executed worse than the other. It is especially dangerous when funding falls sharply in several markets at once: an attempt to chase the highest rate may result in a series of unprofitable switches.
Therefore, it is not worth rotating for a small difference. The difference in funding must comfortably cover the cost of closing the old position and opening the new one. If a switch provides an additional 0.05% in funding but costs 0.10%, it is pointless.
Leverage. An aggressive strategy does not require high leverage.
Funding is charged on the position's notional value, not on the margin: a $100,000 short will receive the same payment whether it is collateralized by $100K or $25K. Leverage only increases ROI relative to margin, but it also brings the liquidation price closer.
It is therefore more important to optimize capital efficiency and maintain a free balance—otherwise, negative funding may be deducted from initial margin, accelerating liquidation.
Exit Rules
The position should be closed when funding stops covering the costs. Specific triggers:
current funding has become negative;
7-day funding has fallen below the minimum threshold;
expected returns no longer cover the closing cost;
the spread has widened or liquidity has fallen;
the margin buffer has fallen to a critical level.
The price of the asset itself is not a reason to exit. The main signal is that the economics of the position have changed: returns no longer cover expenses.
For rotation, the threshold is even stricter: the new market must be more profitable not only than the current one, but also after accounting for switching costs.
Scanner List
BTC, ETH—liquidity benchmarks and core markets.
ZEC, SUI, LINK—search for elevated funding.
ENA, ONDO—active regime with frequent funding (once every 4 hours).
UNI, LTC, DOGE, AVAX—additional markets for rotation.
SOL—liquid, but funding is unstable and requires monitoring.
HYPE—not for passive holding, but for tracking changes in the funding regime.
The best place to study arbitrage instruments is Pandabull. Here you can view funding values both on Bybit and on Hyperliquid.
The point of the list is not that any particular asset is guaranteed to be better. It is a pool for rotation: capital moves wherever the ratio of funding to execution cost is optimal at that moment.
Disclaimer
This material is for informational purposes and does not constitute investment advice.
Trading cryptocurrency derivatives involves the risk of losing capital, including the risk of forced liquidation.
The funding rate, fees, margin requirements, funding intervals, and other Bybit parameters may change. Before making a trade, you must check the current terms for the specific instrument and the account's individual fee tier.