
What Is the Bitcoin NUPL Indicator and How Does It Work?

NUPL (Net Unrealized Profit/Loss) is one of the key indicators for Bitcoin on-chain analysis. It shows whether the Bitcoin market is in a state of unrealized profit or loss and how large that result is relative to market capitalization.
The main difference between NUPL and traditional technical indicators lies in the data source. RSI, MACD, Moving Average, and other tools are calculated using price and, in some cases, trading volume. NUPL uses information from the Bitcoin blockchain: when coins moved and the price at which they last moved.
Therefore, NUPL is more often used not to find an entry point on an intraday chart, but to assess the market's long-term condition and Bitcoin's position within the market cycle.
What the NUPL Indicator Means in Simple Terms
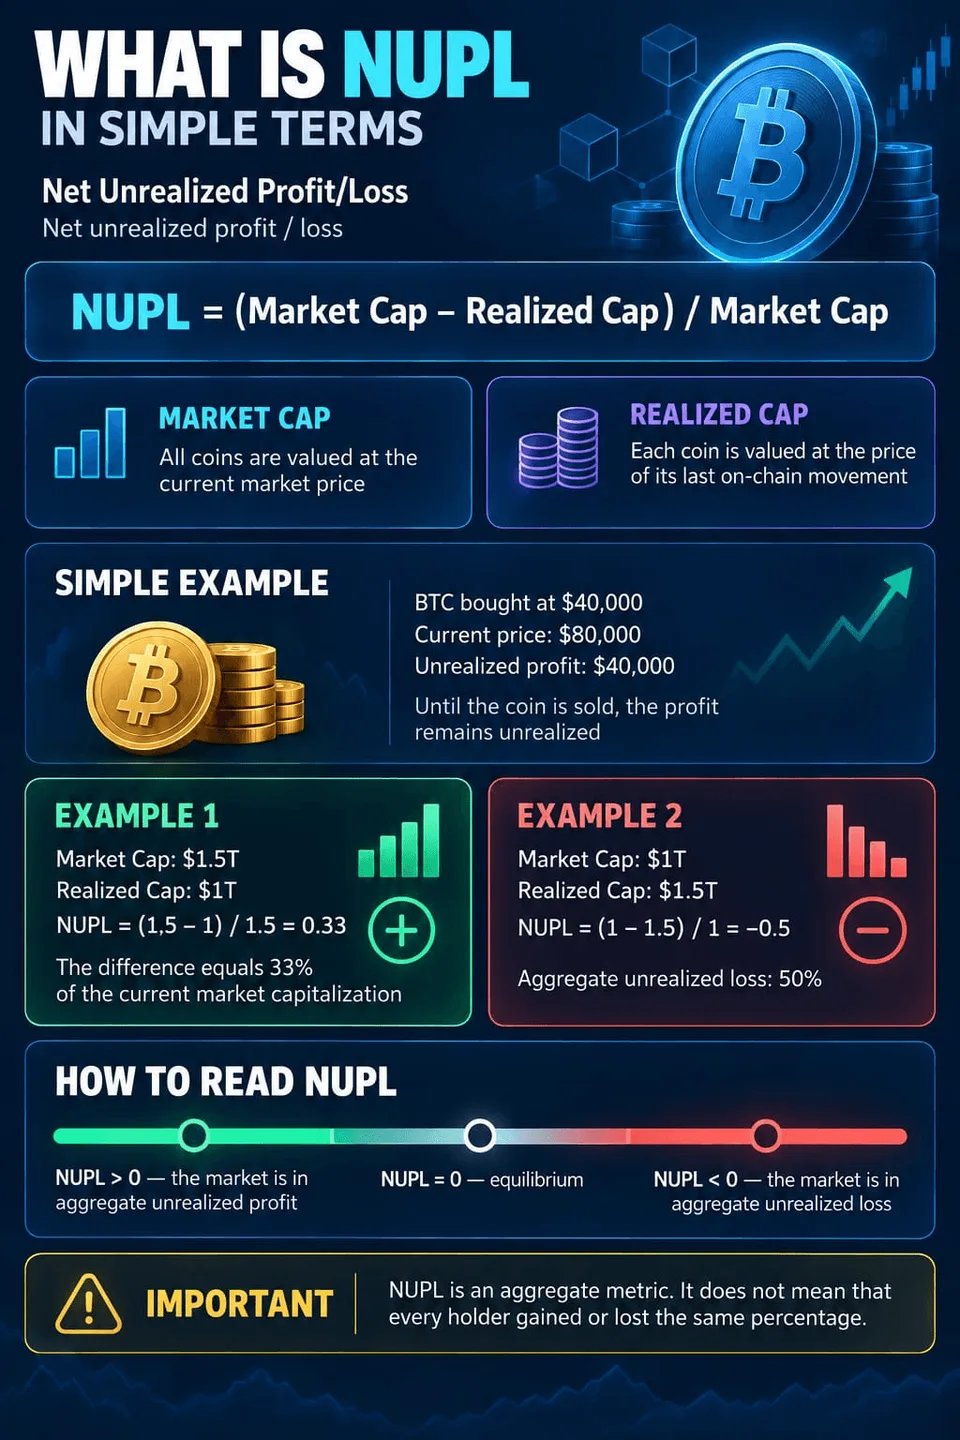
NUPL stands for Net Unrealized Profit/Loss—the net amount of unrealized profit or loss.
The NUPL formula is as follows: NUPL=Market Cap−Realized Cap / Market Cap
Glassnode also defines NUPL as the difference between unrealized profit and unrealized loss, divided by market capitalization.
Bitcoin's standard market capitalization is calculated relative to the current price: all coins are notionally valued at today's market rate.
As for Realized Cap, or realized capitalization, it can be explained in simplified terms as follows.
Each coin is valued at the price at which it last moved on the blockchain. These values are then added together. Thus, Realized Cap can be viewed as an approximate estimate of the aggregate acquisition cost of the coins in circulation.
A simplified example.
Bitcoin was purchased a month ago for $40,000, and its current price is $80,000. Until the coin is sold, the $40,000 profit is unrealized. If the price falls to $30,000, the same position will have an unrealized loss.
NUPL assesses this difference for all coins in the network and then expresses it relative to Market Cap.
For example, if Bitcoin's Market Cap is $1.5 trillion and its Realized Cap is $1 trillion: NUPL=(1.5−1)/1.5=0.33.
The resulting value of 0.33 means that the difference between market and realized value is about $33% of the current market capitalization.
This does not mean that every Bitcoin holder has earned $33% or that every BTC is in profit by exactly $33%. In this case, it means that Bitcoin holders have earned 33% on average.
If, in turn, Bitcoin's market capitalization is $1 trillion and Realized Cap is $1.5 trillion, then NUPL=(1−1.5)/1=−0.5. This means that the average unrealized loss is 50%.
As we have already seen, the NUPL value can be positive or negative.
NUPL > 0 means that Market Cap is higher than Realized Cap. Within the model, this corresponds to aggregate unrealized profit.
NUPL < 0 means that Market Cap has fallen below Realized Cap. This corresponds to an aggregate unrealized loss.
The further the indicator deviates from zero, the greater the difference between the coins' current market valuation and their realized value.
Glassnode uses historical NUPL ranges to analyze different market phases. The classic system identifies levels of 0; 0.25; 0.50; and 0.75. Glassnode itself notes that these boundaries were selected based on historical data and are not mathematically mandatory reversal levels.
NUPL
Historical interpretation
Capitulation, aggregate unrealized loss
0–0.25
Hope / Fear—hope and fear
0.25–0.50
Optimism / Anxiety—optimism and anxiety
0.50–0.75
Belief / Denial—confidence and denial
> 0.75
Euphoria / Greed—euphoria and greed
These names describe the historical characteristics of market phases, not the participants' actual psychological state.
NUPL below zero
A negative value means that the aggregate market value is below Realized Cap.
Historically, such periods occurred during deep Bitcoin bear-market phases. Under such conditions, a significant portion of the coins trades below the price at which they last moved.
For an analyst, this may be a sign of deep capitulation, but a negative NUPL does not automatically mean that the final bottom has formed.
NUPL from 0 to 0.25
In this area, the market is already in aggregate unrealized profit, but its size relative to Market Cap remains comparatively small.
NUPL moving from negative territory above zero can be used to assess a transition from a bear market to a recovery.
NUPL from 0.25 to 0.50
Here, unrealized profit becomes more significant.
Historically, similar values were observed during periods when Bitcoin was already emerging from a deep downturn and sustained growth was beginning. Therefore, this area is often viewed as an intermediate stage between market recovery and a more mature phase of the bull cycle.
NUPL from 0.50 to 0.75
At these values, aggregate unrealized profit becomes substantial.
This matters to an analyst because growing paper profits increase the incentive to realize them. It does not mean that holders necessarily start selling Bitcoin, but it increases the indicator's value when combined with other metrics.
NUPL above 0.75
Historically, values above 0.75 belong to the extreme area that Glassnode associates with the market's euphoric phase. Similar levels were observed near several major historical Bitcoin peaks.
However, the rule “NUPL above 0.75 = time to sell” is incorrect.
A high NUPL indicates a large aggregate unrealized profit, but it cannot determine the exact moment when a bullish move will end. The price may continue to rise while the indicator remains in a high zone.
Why NUPL Is Linked to Market Cycles

Let us consider a typical Bitcoin cycle.
After a sharp decline, most market participants may be near break-even or at a loss. At this point, Market Cap approaches Realized Cap, while NUPL falls toward zero or becomes negative.
Then the price begins to rise. Coins acquired at lower prices enter a state of unrealized profit. At the same time, Market Cap increases faster than Realized Cap — and NUPL begins to rise along with this gap.
As the bullish trend continues, an increasing share of the supply moves into substantial profit. The indicator gradually passes through its historical zones.
At the end of a cycle, NUPL may reach extreme values. This logic makes it possible to use it as an indicator of Bitcoin's position in the macrocycle: it reflects how far the market has “moved” from its underlying on-chain levels.
Glassnode notes that NUPL helps analyze periods of high profitability and the possible strengthening of participants' incentives to realize profits. This is not a sell signal, but a marker of the growing potential for such actions — and it is especially valuable when combined with other metrics.
How to Use NUPL in Analysis and Trading
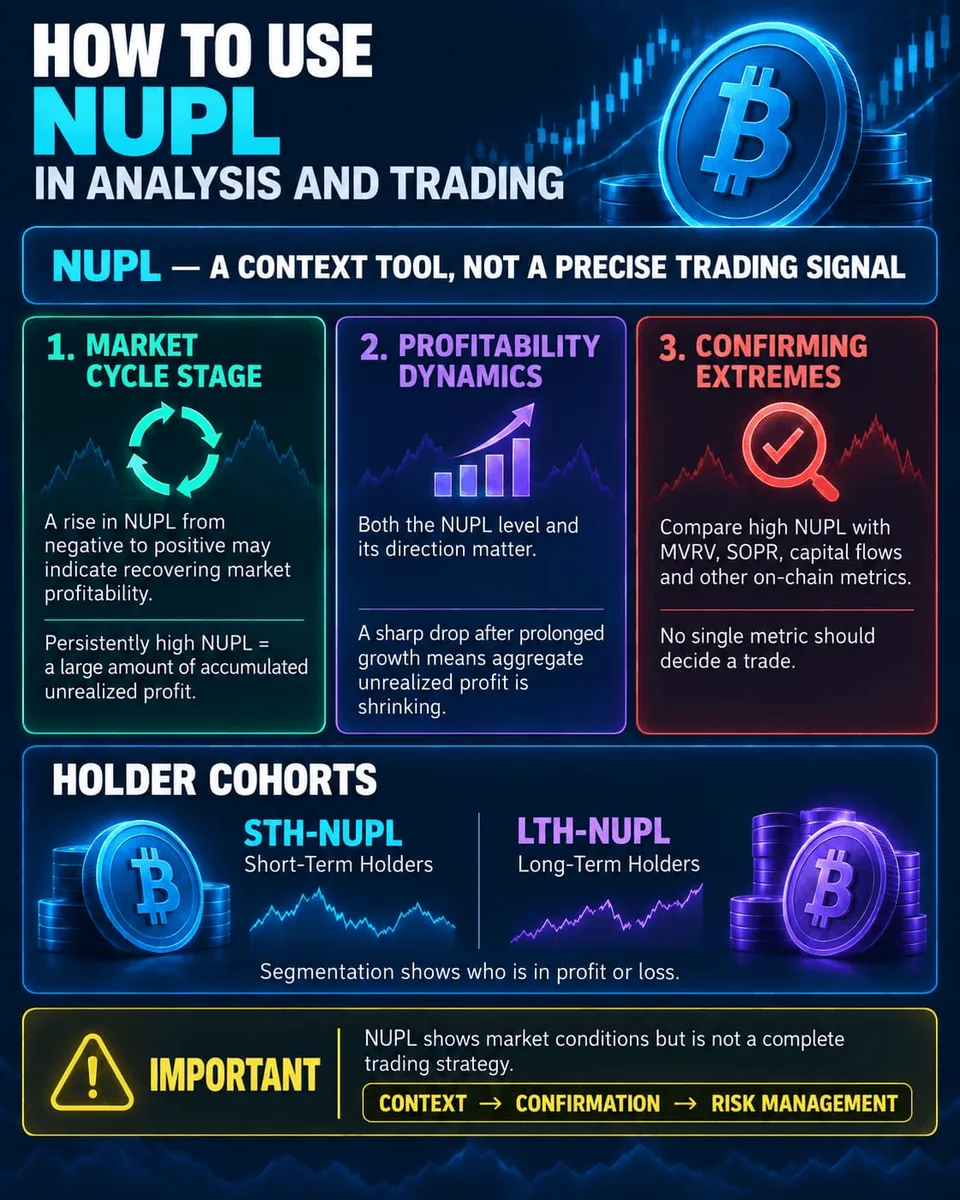
NUPL is a contextual tool, not a precise trading signal.
For example, a trader or investor can use it to assess several parameters.
Market-cycle stage. An increase in NUPL from negative to positive values may indicate a recovery in market profitability. The indicator remaining at high levels for a prolonged period points to a significant amount of accumulated unrealized profit.
Change in holder profitability. Not only the NUPL level itself but also its dynamics are important. A sharp decline after prolonged growth means that aggregate unrealized profit is decreasing.
Seeking confirmation of extreme phases. A high NUPL can be compared with MVRV, SOPR, capital flows, the behavior of long-term and short-term holders, and other on-chain metrics.
Glassnode also calculates NUPL separately for different participant cohorts—for example, short-term and long-term holders. This approach makes it possible to see exactly who is in profit or at a loss, rather than being limited to the aggregate state of the entire market.
NUPL is best viewed as an indicator of market conditions rather than a ready-made trading strategy.
Limitations of NUPL
The indicator has significant limitations.
On-chain coin valuation model. The price at which a coin last moved does not necessarily match its actual purchase price. Coins may have moved between the owner's own wallets, exchanges, and other addresses without changing ownership.
Lost and inactive coins. Coins that have long been inactive and may have been lost are included in the calculation. If Bitcoin was acquired many years ago at a very low price but the wallet keys were lost, it technically continues to be counted as a coin with a large unrealized profit.
Glassnode explicitly points to the problem of Inert Supply—lost coins or coins that have long been inactive. To account for it partially, a modification called Adjusted NUPL (aNUPL) was developed, which excludes the presumed inert portion of coins. As an approximation, Glassnode uses coins that have not moved for seven years or more.
Historical zones are not universal. The structure of the Bitcoin market is changing: institutional participation is growing, coin distribution is changing, and new instruments and methods of storing Bitcoin are emerging. Therefore, historical NUPL zones cannot be regarded as universal signals.
Analyzing NUPL alone can lead to overly simplistic conclusions.
Where can I find the NUPL indicator?
The TLAP team has added NUPL to its list of online cryptocurrency indicators.
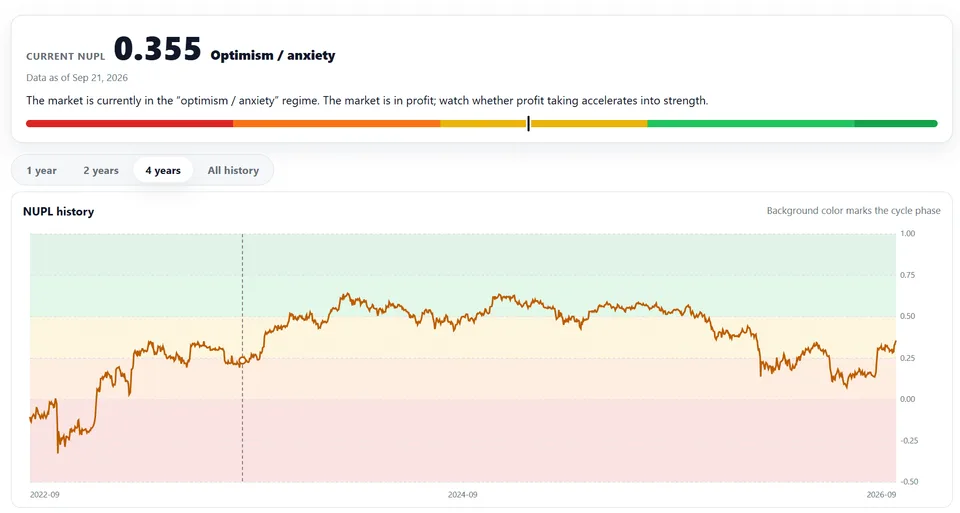
Feel free to use it!
Disclaimer
This material is provided solely for informational and educational purposes and does not constitute investment or financial advice.
NUPL is based on-chain models and historical data, and its values and zones do not guarantee any particular future movement in the price of Bitcoin.
Any trading decisions require independent market analysis and consideration of risks.