
Caution: Two-Sided Liquidity Grab and False Reversal Within Balance

Dangers await a trader at every point on the chart, especially when the instrument is consolidating.
Everyone is familiar with the situation where, within a trading range, price first moves beyond one boundary, quickly returns, and crosses almost the entire balance or even pierces the other boundary. It creates the impression that the market has swept liquidity on one side, reversed, and will now move in the opposite direction.
But after stopping at the extreme or moving beyond it at the other boundary, price reverses again and returns to its previous behavior.
This structure is particularly dangerous for a trader trying to determine market direction from the first impulse after a liquidity sweep.
In ICT/SMC terminology, sequentially sweeping liquidity on both sides of a range is called a double liquidity sweep (Double Liquidity Sweep). The term Double Purge is also used. However, this is not a single standardized term across the entire professional trading community: definitions may differ between schools and individual trading systems.
To interpret this situation correctly, it is necessary to distinguish between two scenarios: a two-sided liquidity grab and a false reversal within balance.
Two-sided liquidity grab: price first takes liquidity on one side, then moves to the other, taking it there as well, and forms a directional move.
False reversal within balance: after the first boundary crossing, price moves sharply in the opposite direction, but reverses at the second boundary without sweeping liquidity.
In both cases, the initial interpretation of the move may prove wrong. But in the second scenario, there are insufficient grounds to claim that liquidity was grabbed on both sides.
How a two-sided liquidity grab forms
Balance is a range within which price fluctuates for some time between relatively stable upper and lower boundaries. Stop orders, pending breakout orders, and other market participants' orders may be located outside it.
When price moves beyond the range boundary, it may trigger some of these orders. However, moving beyond a level alone does not mean that the market is ready to continue in that direction.
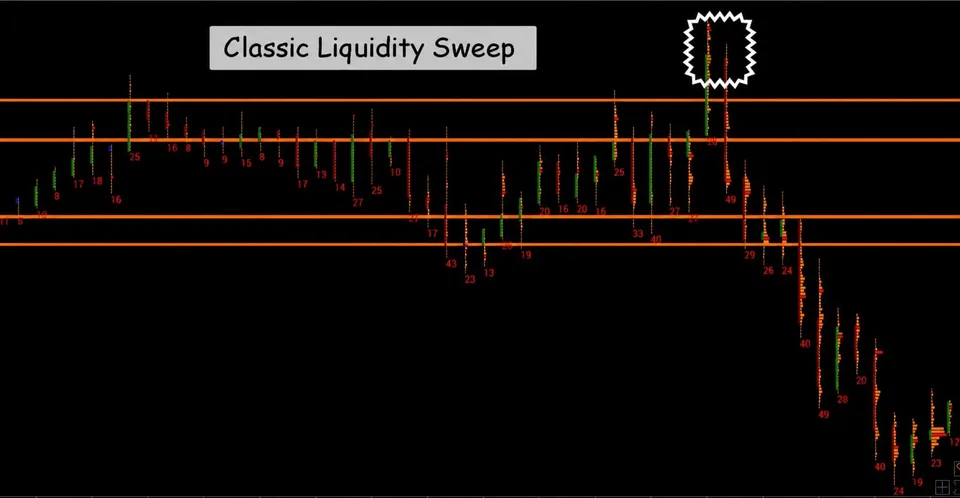
If price returns to balance after setting a new extreme and then begins its main move, this is commonly described as sweeping liquidity from the crowd, as in the image above.
A double liquidity sweep looks different.
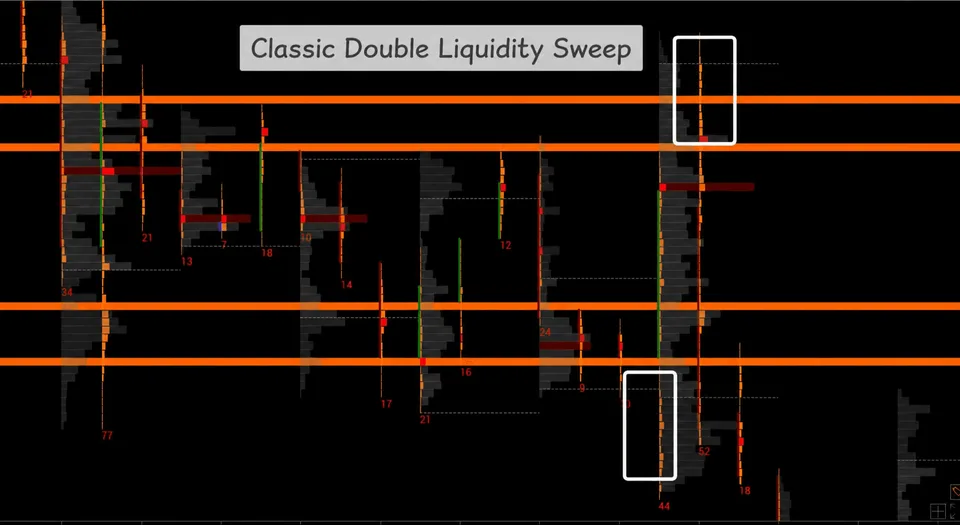
Let's examine the situation step by step.
Stage 1. Sweeping liquidity above the upper boundary of the range.
Price moves beyond the range high, triggers some orders above it, but fails to hold and returns to balance. This looks like a sweep of buy-side liquidity and a potential bearish reversal.
Stage 2. A downward impulse through balance.
Price quickly crosses the range. On a lower timeframe or, as in our case, the trading timeframe, breaks of local lows, a change of character, and other reversal signs may appear, including substantial expansion. Traders begin considering selling, expecting a new downtrend to form.
Stage 3. Sweeping liquidity below the lower boundary.
After triggering short orders, price returns to balance. The anticipated uptrend does not continue.
Stage 4. Resumption of the rise.
After returning inside the balance boundary, price shows a directional bullish move. Ultimately, the market swept liquidity on both sides of the range, while the initial attempt to reverse downward proved unsustainable.
If a decline predominated before balance formed, a downward move can be viewed as a resumption of the previous behavior.
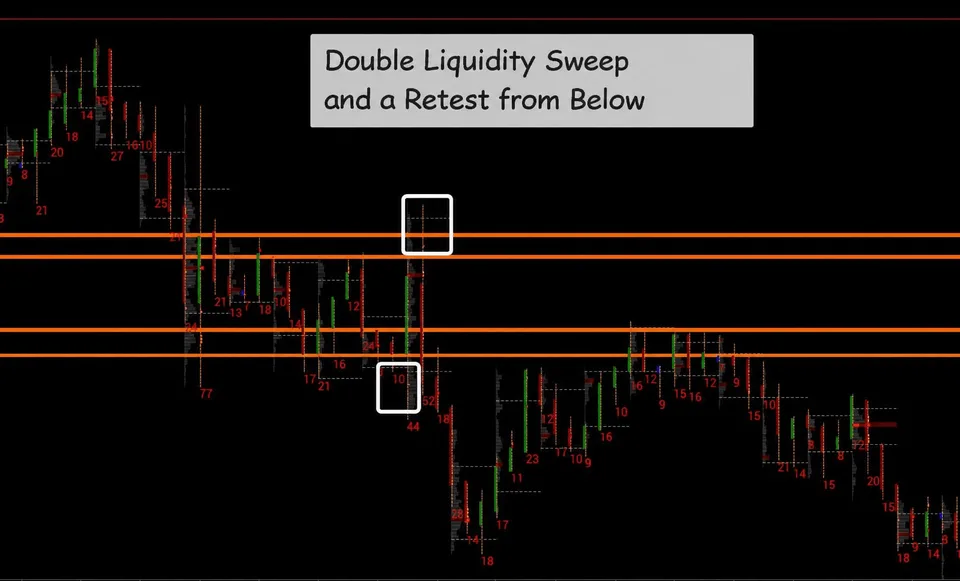
At the same time, two consecutive moves beyond the range boundaries do not, by themselves, prove market manipulation or the existence of a preplanned position held by a large participant.
Thus, a double liquidity sweep occurs when price crosses both boundaries and shows rejection of continuation beyond each of them. Touching the opposite edge is not enough to claim that liquidity has been swept on both sides.
What makes a double sweep dangerous? Primarily, after a new extreme is set and a sharp move in the opposite direction begins, an intense, almost irresistible desire arises to join the emerging move and capture as much of it as possible.
Let's examine a slightly more complex liquidity sweep variation, where one stage may be interpreted less as a liquidity sweep and more as the actual start of a move.
At the very beginning, I showed what a typical sweep of the crowd's stop-losses looks like. Below is the continuation of that example.
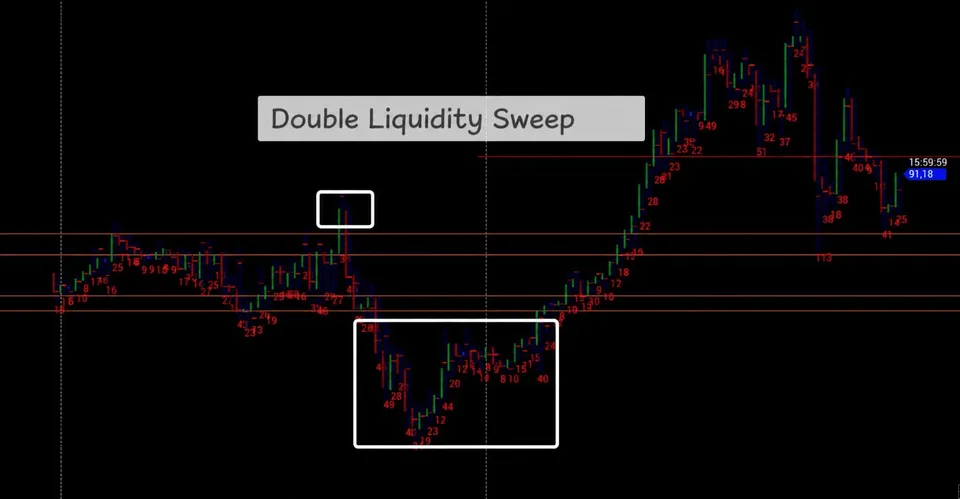
What makes this scenario dangerous? Primarily, it gives traders the impression that the market has truly begun its main move.
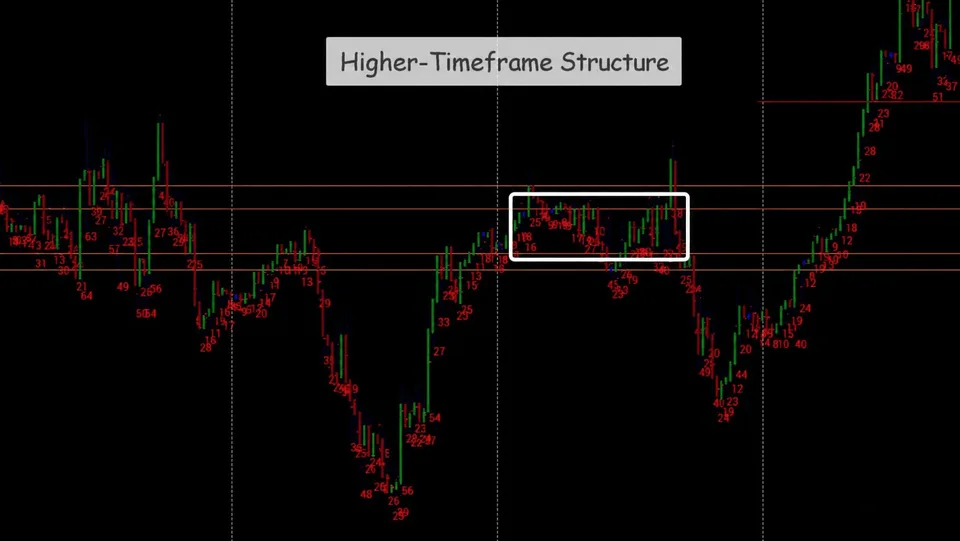
How can you tell that a different scenario is already developing in the market? Quite simply.
You need to closely monitor the structure of a potential retest of the breakout zone.
If, as in our example, some consolidation below the lower balance boundary is followed by a return to balance instead of a sharp decline, this is a very strong argument that we are seeing repositioning. Pay particular attention to the higher timeframe's point of control: if the trading timeframe is M30, use the POC from H4 to D1.
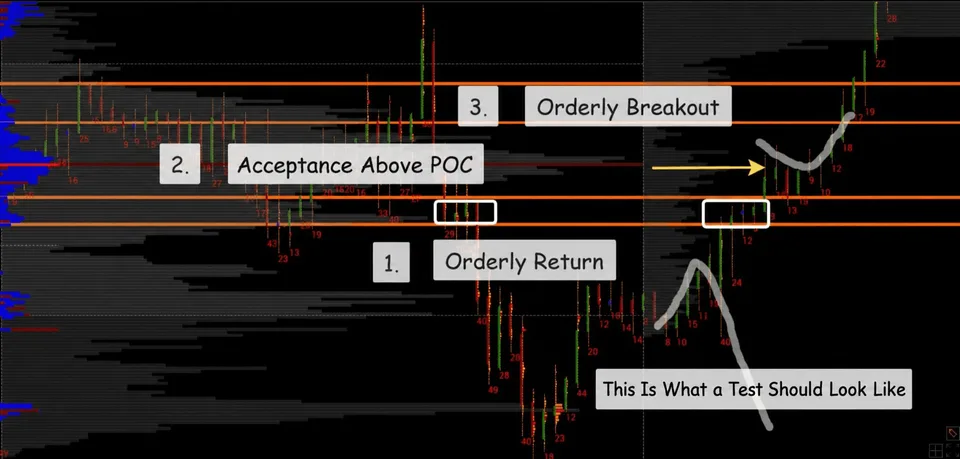
If price then breaks through the upper boundary calmly and confidently, we can confidently speak of a double sweep and an entry into a buying impulse.
In this case, the stop goes below the POC.
False reversal within balance
The second scenario looks similar to the first, but its structure differs.
Suppose price moves above the upper balance boundary, returns inside, and falls sharply. This looks like a bearish reversal following a sweep of buy-side liquidity. However, at the lower boundary, buyers stop the decline and sellers stop selling (this is visible in order flow).
If price reverses without moving below the low, the liquidity grab is unconfirmed. The market has simply rotated through the range and met rejection at the opposite boundary.
As a result, the initial reversal signal proved false: the strong downward move did not produce a sustained exit from the previous structure, and the rise resumed.
Let's examine this in more detail.
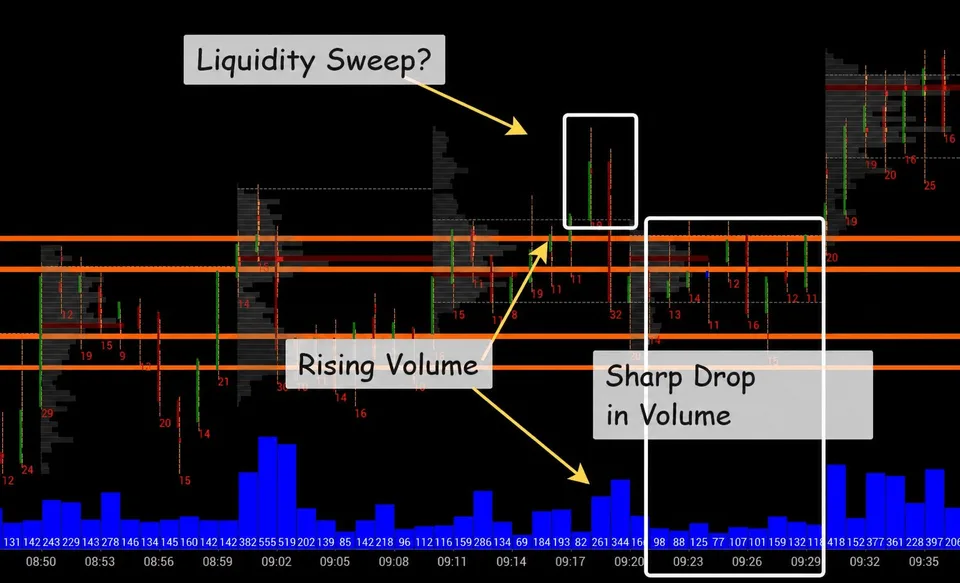
Price enters an accumulation phase.
The potential liquidity sweep occurred on elevated volume.
Volume drops sharply at the lower boundary, and price remains near the middle of the balance zone for a long time (relative to the trading timeframe).
The move in the original direction begins on relatively low volume, followed by an aggressive surge in market orders.
An important signal is the presence of very high volume at the potential liquidity sweep location. On the one hand, this is indeed a sweep attempt; on the other, it is a place where a large player can collect liquidity from the opposite side.
In our example, market buyers could find limit sellers only above the balance boundary. The initial aggression was not supported by the entire market, but after such a burst of market orders, smart sellers lost their desire to expand the range in the opposite direction.
Participants adopted a wait-and-see stance, which is why volume declined. Then those who were more aggressive at that moment took control of the situation.
How to trade a two-sided liquidity grab and a false reversal within balance
Identification procedure
The identification procedure is quite simple.
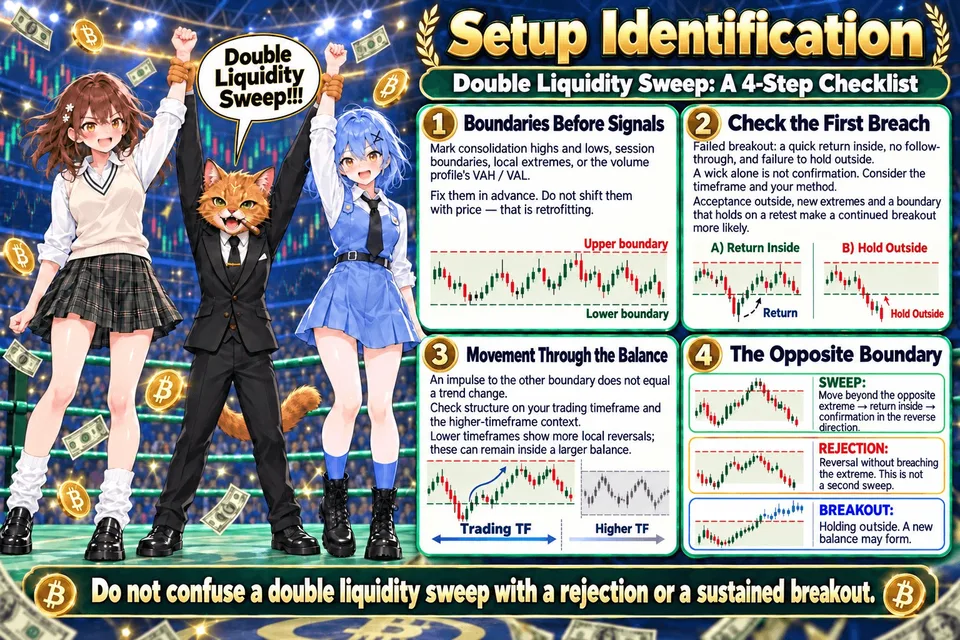
1. Define the balance boundaries in advance.
The boundaries must be marked before the presumed signal appears. They may be consolidation highs and lows, trading session boundaries, local extremes, or the Value Area High and Value Area Low zones on the volume profile. In the examples above, these are precisely the zones used to define the range boundaries.
If you constantly move the boundaries to follow price, practically any move can retrospectively be labeled a liquidity grab.
2. Check the first move beyond the range.
What matters is not only whether price pierced a high or low, but also how it behaved afterward.
A quick return inside the range, lack of continuation, and inability to hold beyond the boundary support a failed breakout interpretation. A candle wick alone is insufficient confirmation: the rules for identifying a move outside must account for the timeframe and the analysis method used.
If price establishes itself outside, forms new local extremes, and holds the broken boundary on a retest, the probability of breakout continuation increases. In this situation, calling the move a liquidity grab is premature.
3. Assess the move through balance.
A strong impulse through the range may confirm the market's readiness to move toward the other boundary, but does not necessarily mean a change in trend.
It is useful to check whether a real structural change is occurring on the trading timeframe. Breaking several internal highs after sweeping a low may look like a change in behavior, even though price is still moving within the previous balance on a higher timeframe.
The smaller the timeframe, the more local changes in direction can be found within a single large consolidation.
4. Examine the reaction at the opposite boundary.
If price moves beyond the opposite extreme, then returns inside and receives confirmation in the reverse direction, this can be described as a two-sided liquidity grab.
If price stops at the boundary and reverses without setting a new extreme, this is a bounce from the edge of balance. It may lead to a resumption of the original trend, but is not itself a second liquidity grab.
If price breaks through the boundary and begins holding outside, an alternative scenario should be considered: an exit from balance with the formation of a new price range.
Analysis tools
No indicator identifies a two-sided liquidity grab automatically. It is more reliable to assess a combination of market context, price behavior, and confirming data.
Price Action. Candle wicks, closes relative to boundaries, impulse candles, and breaks of local extremes help assess whether a move outside occurred and how quickly the market returned. The sequence of highs and lows helps distinguish a local reversal from a change in the larger structure.
Volume Profile and Market Profile. The profile shows where trading activity is concentrated. A quick return to the previous value area after moving outside it supports the failed breakout hypothesis. Conversely, sustained volume buildup and a shift of the value area beyond the previous balance support acceptance of new prices.
Volume, delta, and footprint charts. A sharp increase in aggressive buying at the upper boundary without further price progress may indicate absorption of buying flow by opposing orders. A similar situation is possible with selling at the lower boundary. However, absorption should be interpreted in the context of price movement, rather than from a single delta reading.
RSI and MACD. Divergence between an indicator and price may provide an additional indication of weakening momentum. However, divergence does not prove that liquidity has been swept or that a reversal has already occurred. Such signals may appear repeatedly within balance.
How to use the structure in trading
The main mistake is opening a position immediately after the first move beyond a boundary, assuming that the market has already chosen a direction.
A more systematic procedure looks like this:
Identify the range, its boundaries, and the higher timeframe context.
Record the first move beyond an extreme and check whether price returns inside.
Do not treat the first move as final confirmation of a reversal. Wait for the reaction at the opposite boundary.
Establish whether the second extreme was actually swept or price merely reversed at the boundary.
Look for confirmation of the anticipated direction in price structure and, where data is available, in volume and order flow.
Before entering, define the scenario's invalidation point, stop-loss, and position size. Targets may include the middle of the range, the opposite boundary, or the next significant level, depending on the structure and the ratio of potential reward to risk.
In a two-sided liquidity grab, the direction of the subsequent move cannot be determined solely by which side was swept last. You need to wait for confirmed rejection of further movement beyond the second extreme.
In a false reversal within balance, price may return to the original boundary, but this is not guaranteed. The range may continue oscillating or, with the arrival of a new flow of orders, transition into a directional move.
Common trader mistakes
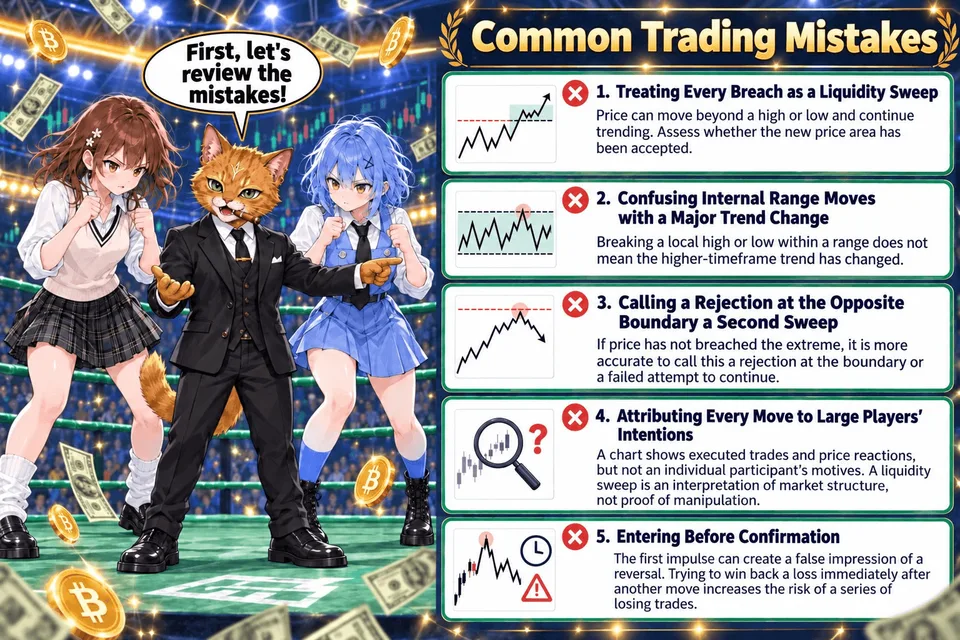
Equating every boundary penetration with a liquidity grab. Price may move beyond a high or low and continue the trend. You need to assess whether the new price area has been accepted.
Confusing internal balance movements with a change in the overall trend. A break of a local extreme within balance does not yet mean a change in direction on the higher timeframe.
Treating a bounce from the opposite edge as a second grab. If the extreme was not crossed, it is more accurate to describe this as price rejection at the boundary or a failed continuation attempt.
Explaining every move through the intentions of large participants. The chart shows trade execution and price reactions, but does not reveal a specific participant's motives. A liquidity grab is an interpretation of market structure, rather than proof of manipulation.
Entering before confirmation. The first impulse can create a false impression of reversal, while an attempt to immediately recover a loss after the subsequent move increases the risk of a series of losing trades.
Disclaimer
This material is educational and does not constitute an investment recommendation. The market structures described do not guarantee a particular price movement.
Before opening a position, you need to assess volatility, the instrument's liquidity, potential slippage, and acceptable risk.