
Why Historical Quotes Are Needed in Trading

A novice trader often sees historical quotes as nothing more than a chart archive: you can open a previous day, look at where the price moved, and end the analysis there.
In reality, historical data is needed not so much to learn about the past as to understand exactly how the market behaves and whether that behaviour changes over time.
Price on its own is only one part of the information. It is far more important to see how volatility, volumes, the time of peak activity, the reaction to economic events, the character of trends and ranges, liquidity and other parameters change.
It is the comparison of history with the current situation that makes it possible to tell whether today's market really resembles the one the trader is used to analysing.
Imagine that a currency pair covered 100 points during the day. At first glance this is an ordinary move. But without historical context it is impossible to tell whether that is a lot or a little.
If the average daily range of this pair used to be 60 points, a 100-point move indicates increased activity. If, however, a few years ago the market regularly covered 150-200 points, today's 100 points may instead indicate a decline in volatility.
That is why historical quotes are needed first and foremost to answer the question: how much does the current market situation differ from the usual one?
The trader compares current parameters with historical ones and gains context. It is context that turns a set of candles into information.
What Historical Quotes Are Needed For
Analysing historical quotes is essential for traders who intend to make a profit from the market. Below we look at what historical quote data helps to study.
Changes in Volatility
Volatility is one of the most important parameters that has to be compared over time.
The market can move from a calm state to an active one and back again. The reasons vary: changes in interest rates, crises, elections, geopolitical events, changes in liquidity, seasonality, or simply a change of market regime.
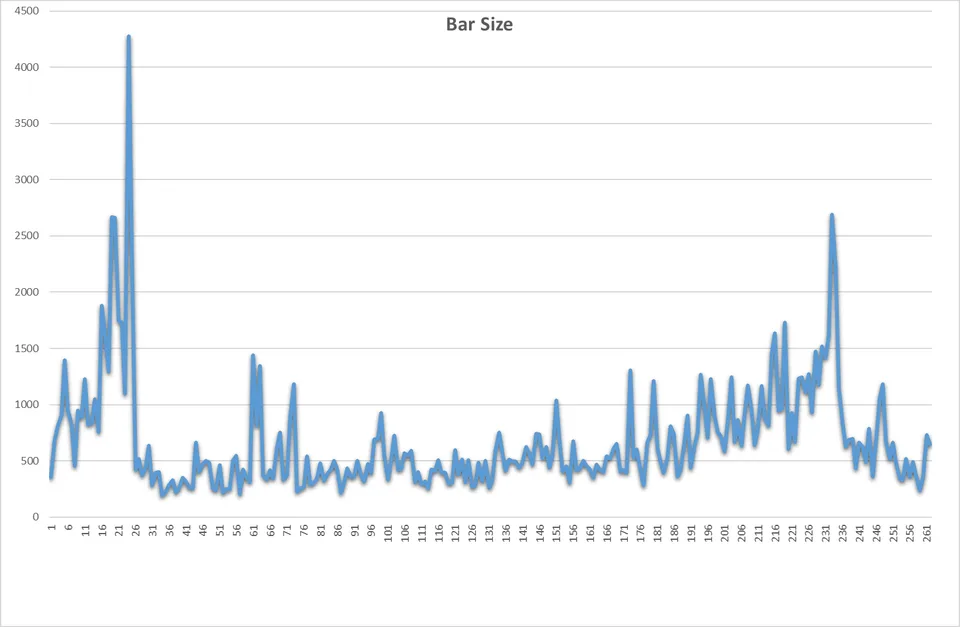
Here is an example of volatility on CL futures (WTI crude oil) over the past five years (from 16 August 2021 to 16 August 2026).
After the start of the war in Ukraine, volatility rose sharply, but from mid-2022 to mid-2023 it settled around a norm of 500 points per week. From mid-2023 a volatile increase began, with the average reaching 800 points and a typical range of 600 to 1,000 points.
Interestingly, once the market had adapted to the war between Russia and Ukraine and to the confrontation between the United States and Iran, volatility fell sharply and reached certain average minimum values.
A change in volatility affects practically every element of a strategy:
stop-loss size;
position size;
potential take-profit;
trade duration;
how often strong impulses appear;
the probability of false breakouts;
risk requirements.
If a trader uses historical data, they can see how volatility changed over months and years instead of drawing conclusions from just the last few candles.
It is especially useful to compare volatility by period: for example, to study the average range of the day, the week and the month separately. It then becomes clear whether market activity is increasing or gradually declining.
It is important to understand that historical volatility does not guarantee future volatility. Its job is to provide a reference point relative to the current state of the market.
Changes in Volume
Price shows where the market moved, but volume helps assess how actively market participants took part in that move.
Historical data makes it possible to compare not only absolute volume but also its structure.
For example, you may discover that:
volumes are gradually growing;
volumes are falling along with activity;
strong moves have started to occur on lower volume;
impulses are accompanied by unusually high volume;
volume is concentrated in certain hours;
the market's usual volumes have changed sharply.
This matters particularly because an identical price move can have a completely different meaning.
Suppose the price rose by 1%. If historically such moves happened on a sharp increase in volume, and now the price is rising against a background of relatively weak activity, the market may be in a completely different state.
Historical comparison helps determine whether the current volume is really unusual.
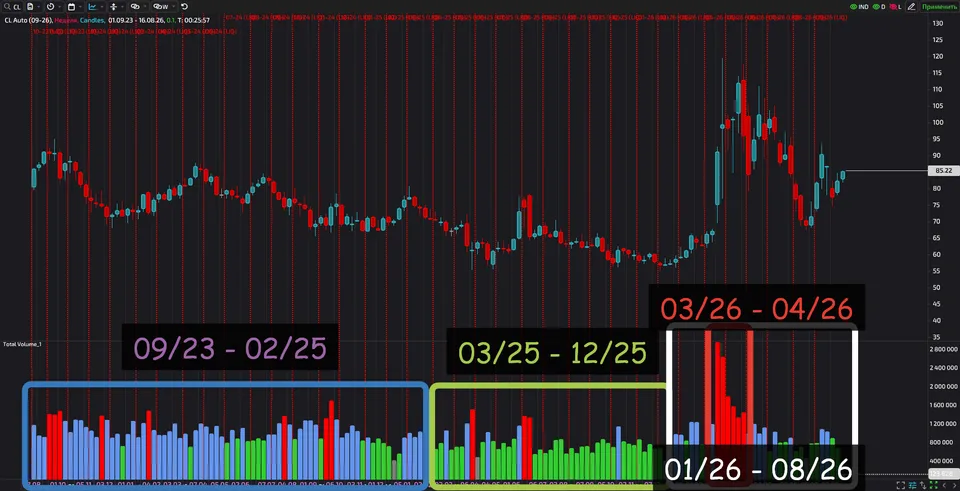
For example, a level of 900,000 contracts on CL crude oil was the norm in the second half of 2023 and early 2025. From March 2025 to December 2025 the norm was 500,000 contracts and above. Since January 2026 the picture has been mixed.
March and April clearly stand out as the acute phase of the conflict in the Strait of Hormuz. After that, volumes returned to the 2023-2024 norm. Volatility, however, increased. That means the relationship between volume and volatility changed, and so did the statistics.
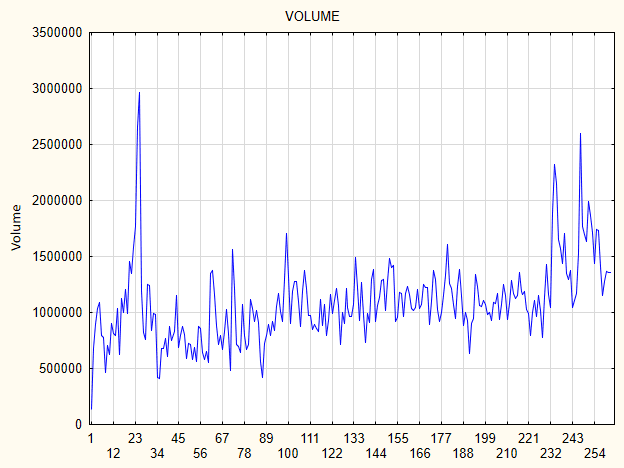
That is why it is useful to look not only at volume itself, but also at its deviation from the historical norm.
Shifts in Activity Within the Trading Session
Another aspect that novice traders often underestimate is the time at which a move actually occurs.
A trading session is not uniform. At different hours the number of participants, liquidity and the intensity of trades can differ substantially.
Historical data lets you see:
at what time an active move usually begins;
when the daily high or low is formed;
when volume rises;
when breakouts happen more often;
during which hours the market becomes less active;
at what moment sharp impulses appear.
It is especially interesting to watch how this structure changes over time.
Here, for example, is an hourly CL chart. You can see reasonably well how activity shifts during the European session (the vertical lines at 6:00 CT). It is possible to speak of both increases and decreases in volatility.
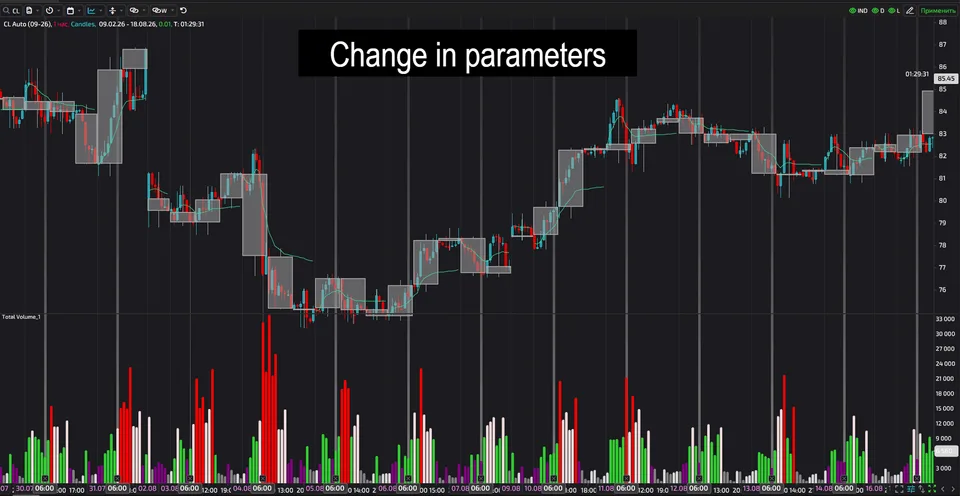
Suppose that several years ago the instrument's peak activity was observed mainly at the start of the European and American sessions. A few years later the bulk of the volume may have shifted closer to the American market open or to the release of important statistics.
For a trader this means that the rule about the best time to trade cannot be considered permanent.
Historical quotes make it possible to check whether market activity today really occurs at the same time as before.
Different Reactions to Economic News
Economic news is a particularly good illustration of why historical data needs to be downloaded and studied.
The same release can trigger a completely different market reaction in different periods.
For example, an inflation release used to produce a move of 50 points, and later the reaction grew to 100-150 points. In another period the market may almost stop reacting to a similar event.
It is important to study not just the fact that the price changed, but the structure of the reaction:
before the news, the moment of release, the first minutes, the first hour, the end of the trading day.
History makes it possible to compare:
the size of the initial impulse;
the speed of the move;
the number of false breakouts;
the depth of the pullback;
the duration of the move;
the direction of the reaction relative to expectations;
price behaviour after the initial impulse.
This is especially useful for news-based strategies.
For example, a trader may discover that CL crude oil effectively stopped reacting to US oil inventories in 2023-2026, whereas earlier this release worked quite well. In 2017-2020 the instrument often made a sharp move in one direction first and then reversed completely. Or the opposite: the initial impulse usually turned out to be the beginning of a lasting trend.
But it is important not to turn a statistical observation into a rigid rule. The fact that something happened in 30 cases out of 40 does not mean the forty-first case will be the same.
Changes in the Character of Trends
Historical quotes make it possible to study not only the strength of a move but also its structure.
The market can be in various regimes:
a trending market - the price consistently forms a directional move;
a sideways market - the price stays inside a range most of the time;
a high-volatility market - the move is accompanied by large candles and sharp changes;
a low-volatility market - the price moves in small steps;
a transitional regime - the market begins to leave the range and form a new directional move.
For a novice trader this is a very important distinction.
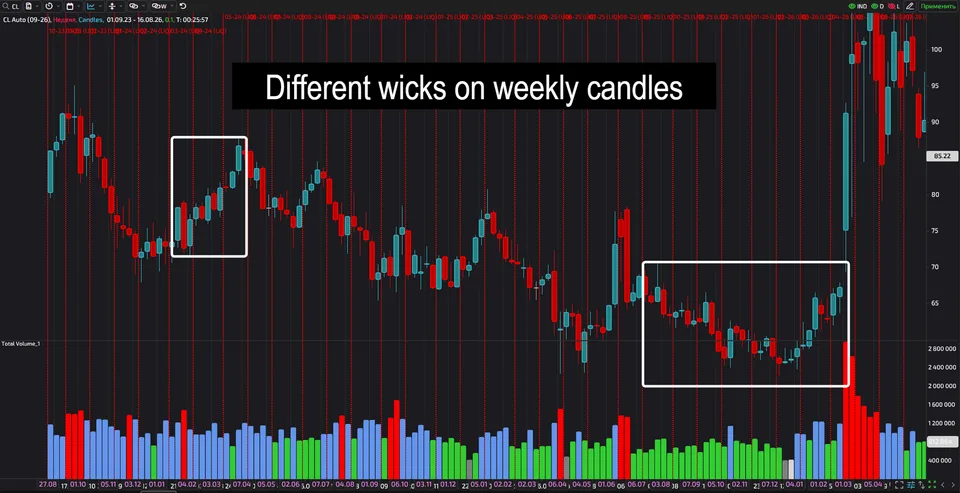
Here is the CL chart again, from September 2023.
The instrument behaved differently in different periods.
In the first half of 2024 the wicks on the weekly candles are fairly short relative to the candle bodies. In the second half of 2025, however, the wicks are substantially longer relative to the bodies.
At the same time, in the first half of 2023 the candle bodies are longer than in the second half of 2025 - and that is against generally higher volatility in the second period.
A strategy that works well in a flat market can produce a string of losses in a strong trend. A trend-following system, conversely, can lose money for a long time in a sideways market.
History makes it possible to check how often regimes change and how long they last.
Changes in Liquidity and Market Structure
Historical quotes help study one more parameter: the quality of price movement.
Everything discussed above points to a change in market structure.
The price can move gradually, forming a relatively stable structure, or it can jump between levels with sharp impulses.
Liquidity is affected by the number of participants, the time of day, important news and the specifics of the particular instrument.
This is especially noticeable in less liquid markets.
History helps determine:
how large the usual spreads and price gaps are;
how often sharp jumps occur;
how quickly the price passes through levels;
how activity changes at different hours;
how the market behaves before the close and open of the major exchanges.
This is directly related to trade execution. A strategy may look profitable on a historical chart, yet the result in live trading will be worse because of slippage, commissions and the specifics of liquidity.
Seasonality and Recurring Patterns
Another reason to use historical data is the search for seasonal effects.
Some markets show characteristic features in certain months, days of the week or periods of the year.
For example, you can compare:
average volatility by month;
market behaviour by day of the week;
the frequency of rises and falls at certain times of the year;
changes in volume ahead of holidays;
activity at the beginning and end of the month;
market behaviour after long weekends.
Seasonality, however, cannot be treated as a standalone trading signal.
For example, heavy petroleum products and natural gas generally become more expensive in summer, ahead of the heating season.
If a historical effect is weak and unstable, its value for decision-making may be minimal. History is there to test a hypothesis, not to build a neat explanation after the fact.
Historical Quotes and Testing Algorithmic Strategies
For an algorithmic trader, historical data has one more fundamental use: testing a trading strategy on past data.
An algorithm can be thought of as a set of rules. Under certain conditions it opens a position, sets a stop-loss and a take-profit, changes the position size or closes the trade. Historical quotes make it possible to check what the result of such a system would have been had it traded in the past.
But the purpose of testing is not merely to obtain an attractive profit figure.
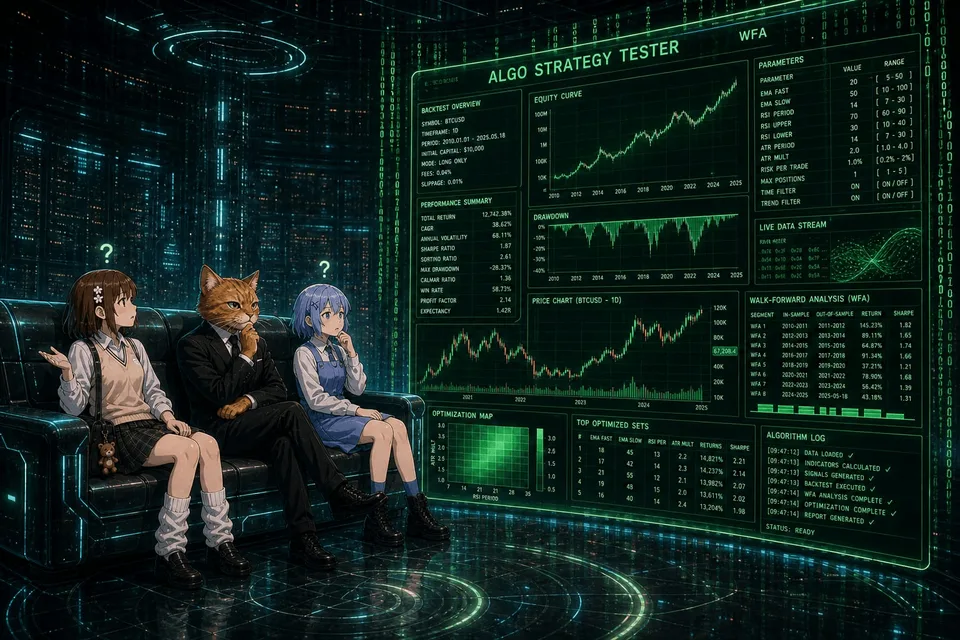
What needs to be studied is how the effectiveness of the strategy changed under different market conditions.
For example, one and the same system may show:
high profitability in a trending market;
a small loss in a flat market;
a sharp drop in results when volatility rises;
good results when liquidity is high;
deteriorating performance during news releases;
a change in the average holding time of a position;
an increase in the number of stop-losses;
a change in maximum drawdown.
Historical testing therefore makes it possible to explore not only the question of whether the strategy made money, but a far more important one: under which conditions does the strategy make money, and under which does it stop working?
Changing Strategy Parameters
Algorithmic strategies often have parameters that influence trading decisions.
For example:
the moving average period;
the ATR period length;
the stop-loss multiplier;
the take-profit size;
the entry threshold;
the minimum volume;
the maximum drawdown;
the position size;
the trading session time filter.
Historical data makes it possible to check how changing these parameters affects the result.
Suppose a strategy uses a stop-loss of 1 ATR. Testing may show that under some conditions 1.5 ATR works better, and under others 2 ATR. But an important problem arises here: the optimal parameter found in history will not necessarily be optimal in the future.
This is called over-optimisation, or overfitting.
If parameters are selected exclusively to fit already known history, the algorithm may learn to reproduce the past too well while performing poorly on new data.
The goal of testing, therefore, is not to find a single perfect set of parameters, but to find a stable range of parameters.
For example, if a strategy delivers a good result only at an RSI value of 47 and suddenly becomes unprofitable at 46 and 48, that is a warning sign. Such a system may be too sensitive to specific historical data.
A far more reliable situation is when the strategy remains acceptable across a wide range of values: for instance, RSI from 45 to 50 gives similar results. In that case one can assume the result is driven more by the logic of the strategy than by a random feature of the historical period.
It Is Not Only Profit That Changes
When comparing different versions of an algorithm, it is important to look at more than the final profit.
Historical data makes it possible to track changes in:
return - how much the strategy earned over the chosen period;
maximum drawdown - how deeply capital fell from a local peak;
profit factor - the ratio of total profit to total loss;
the share of profitable trades - how many positions ended in profit;
average profit and average loss;
the return-to-risk ratio;
the number of trades;
the holding time of a position;
the stability of results across months and years.
For example, an increase in annual return from 20% to 30% may look positive. But if maximum drawdown grew from 10% to 35% at the same time, the quality of the strategy may in fact have deteriorated.
Conversely, a fall in profit from 30% to 25% is sometimes an acceptable price for a substantial reduction in risk.
Testing must therefore evaluate the whole set of characteristics, not a single number.
How a Strategy Changes When the Market Changes
Historical data is especially valuable when the market passes through several different phases.
Imagine a strategy tested on ten years of history. Over that period there could have been calm stretches, crises, sharp increases in volatility, long trends and prolonged flat markets.
If the strategy shows relatively stable characteristics across different regimes, that is a good sign.
But something else may emerge: for example, the algorithm made money in 2018-2020, deteriorated sharply in 2021, recovered in 2022, and then began to lose money again.
A result like this forces you to look for the cause.
Perhaps volatility changed. Perhaps the correlation between assets changed. Perhaps market participants started reacting to news differently. Perhaps the trading session began distributing volume differently.
A historical test is thus simultaneously a test of the strategy itself and a study of how the market has changed.
Walk-Forward and Testing on New Data
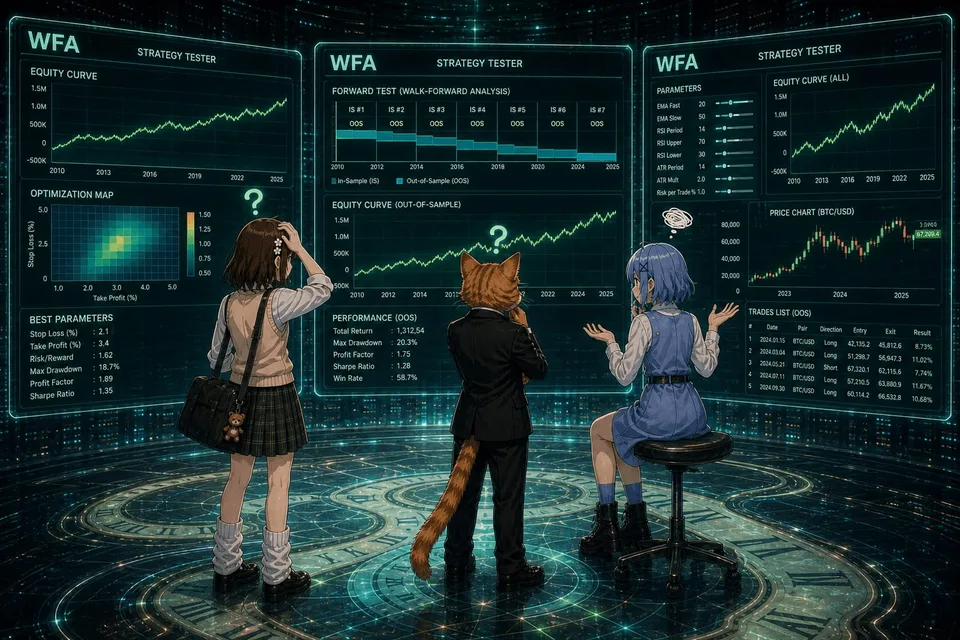
You cannot simply take all the available history, fit the parameters and then treat the result as objective.
A more reliable approach involves splitting the data into periods. On one segment the strategy is studied and tuned; on another it is tested on data that was not used when selecting the parameters.
This approach makes it possible to check how well the strategy can work on data it has not seen.
Better still is to repeat the process regularly: fit the parameters on one period, test on the next, then shift the window forward and repeat.
This approach is known as walk-forward analysis.
The goal of WFA is to assess how robust a strategy is to changing market conditions and to reduce the risk of overfitting, where the model adapts too precisely to historical data and performs poorly in live trading.
It is especially useful for strategies whose parameters may change along with the market regime.
For example, if market volatility has risen, the algorithm may require a different stop-loss size. But instead of taking that for granted, the trader should check on history whether changing the parameter really improves the result on data that was not used to select it.
Historical Data Helps Detect the Moment a Strategy Broke Down
This is one of the most practical tasks.
An algorithm may work for several years and then its metrics begin to deteriorate:
profitability falls, drawdown increases, average profit per trade decreases, and the number of false signals grows.
Historical analysis helps pinpoint when exactly the change began.
After that, market parameters before and after that moment can be compared:
volatility, volumes, liquidity, correlations, trend structure, intraday activity and the reaction to news.
As a result, a link can be found between the change in the market and the deterioration of the algorithm.
This is far more useful than simply switching the strategy off after a series of losses.
The Main Conclusion for an Algorithmic Trader
Historical quotes make it possible to test not only a strategy, but also its robustness over time.
A good historical check should answer several questions at once:
How much does the strategy earn?
What risk does it take on?
How does its profitability change across different market regimes?
How sensitive are the results to changes in the parameters?
Does its effectiveness hold up on data that was not used for optimisation?
What happens to the strategy when volatility, volumes and market structure change?
This is exactly why historical quotes are so important for algorithmic trading. They make it possible not just to find a working set of rules, but to investigate why it worked, how robust it is and what will happen when market conditions change.
At the same time, no historical testing result guarantees future profit. A backtest shows the behaviour of a strategy on a past data set and may not account for changes in liquidity, slippage, commissions, execution delays and other real trading conditions. Test results should therefore be treated as a way of checking a hypothesis, not as proof of future returns.
How to Use Historical Data in Practice

A novice trader does not have to start by building complex statistical models.
You can begin with a simple comparison.
For example, ask yourself a few questions before trading:
What is volatility right now relative to the average of the past few months?
Is current volume above or below normal?
At what time of day is the market most active now, and does that match the historical picture?
How did the instrument react to similar news in the past?
Is the market in a trend or in a range?
Has the correlation with other assets changed?
Has the strategy started working in conditions that differ from the historical conditions in which it was created?
This sequence gradually moves the trader from analysing individual candles to analysing the market regime.
History Is Not for Finding the Perfect Signal

One of the most useful habits a trader can develop is to stop looking for a magic entry point in the past.
It is far more important to understand:
what the market was like when the strategy worked;
what the market is like now;
which parameters have changed;
which changes are critical for the strategy;
and which are of no real significance.
For example, if a strategy was developed when the average daily range was 80 points and today the market consistently covers 140, that may matter far more than a change in any single indicator.
The same applies to volumes, activity times, reactions to news, correlations and the structure of movement.
Historical quotes are therefore not just an archive of prices. They are a basis for comparing different states of the market.
The deeper a trader studies history, the better they understand that the market is constantly changing. And that means a trading system must not exist in a vacuum. It has to be checked regularly against current volatility, volumes, liquidity, activity times, reactions to news, correlations and other characteristics of the instrument.
This is exactly why historical data is one of the main learning tools for a trader. It shows not only where the price moved, but under what conditions it did so.
And that is far more important information for making trading decisions.
The Main Mistake: Treating History as an Unchanging Future

The most dangerous mistake is to use historical quotes as proof that the market will necessarily repeat the past.
History does not say: this is exactly how it will be in the future. It says: under similar conditions the market previously behaved this way. That is a fundamental difference.
Market conditions change constantly. Participants become different, and so do the structure of liquidity, regulation, trading technology, the share of algorithmic systems, the influence of individual financial centres and investors' reactions to macroeconomic events.
Good historical data is therefore needed not to predict the future with absolute accuracy, but to assess probabilities.